AI Generated Quiz
A Level H2 Geography Fieldwork Quiz
Free A Level H2 Geography Fieldwork quiz, LongCat AI version, with questions, answers, and A Level-style practice for Singapore students.
These static practice materials are generated from the site's syllabus and paper-generation workflow, with source and model context shown so students and parents can evaluate the material before use.
Questions
A-Level Geography H2 Quiz - Fieldwork
Name: ___________________________
Class: ___________________________
Date: ___________________________
Score: ________ / 60
Duration: 90 minutes
Instructions
- Answer all questions in the spaces provided.
- Read each question carefully before answering.
- Where data or source materials are referenced, study them thoroughly before responding.
- For questions requiring evaluation or analysis, ensure your response is well-structured, uses appropriate geographical terminology, and is supported by evidence where applicable.
- The number of marks allocated to each question is shown in brackets [ ]. This indicates the depth and length of response expected.
- Total marks: 60.
Section A: Research Design and Planning (Questions 1–5)
1. Define the term hypothesis as used in geographical fieldwork. Give one example of a testable hypothesis for a study investigating urban heat islands. [3]
2. A student plans to investigate whether vegetation cover affects soil infiltration rates in a local park.
(a) State one independent variable and one dependent variable for this investigation. [2]
(b) Identify two control variables the student should keep constant to ensure a fair test. [2]
3. Explain why a pilot study is important before carrying out a full fieldwork investigation. [3]
4. A group of students is designing a questionnaire to investigate residents' perceptions of flood risk in a coastal town.
(a) State two characteristics of a well-designed questionnaire for geographical fieldwork. [2]
(b) Write one closed question and one open question the students could include in their questionnaire. [2]
5. Explain the difference between primary data and secondary data in geographical fieldwork. Give one example of each. [4]
Section B: Data Collection Methods (Questions 6–10)
6. A student is investigating changes in beach profile along a stretch of coastline.
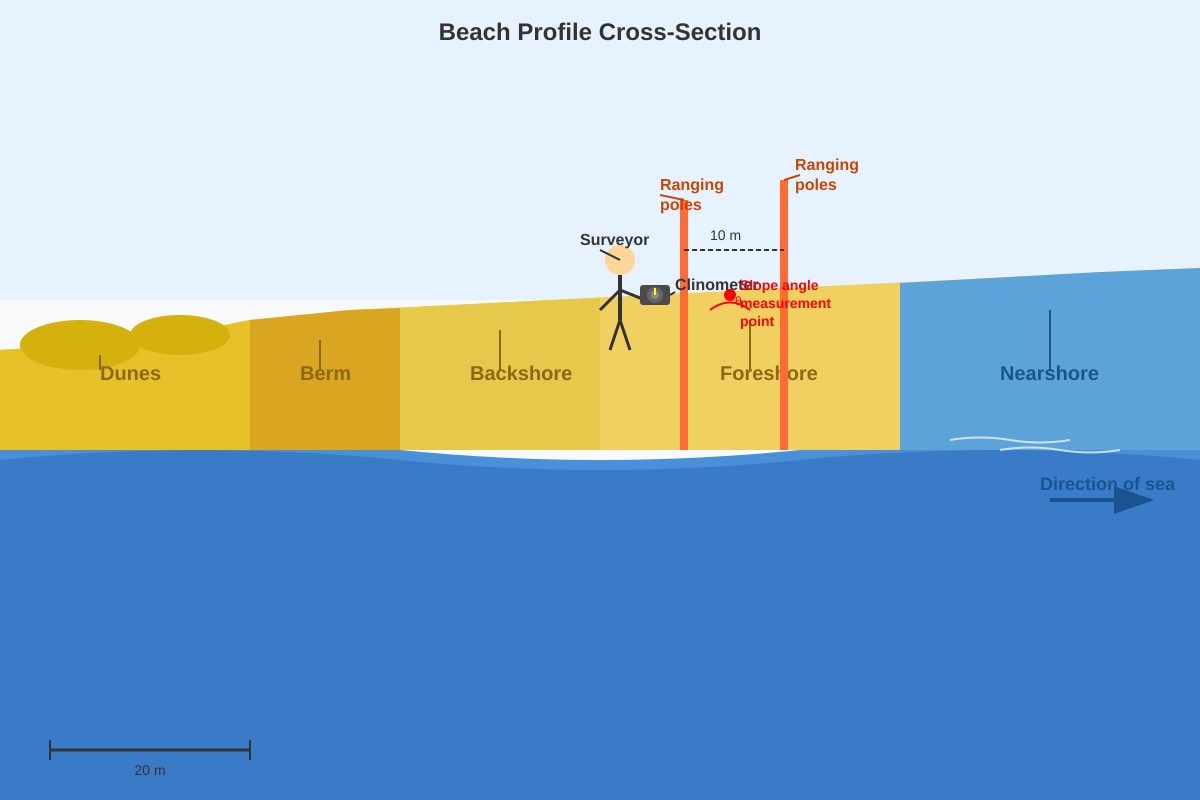
Generated diagram for Q6.
(a) Using the diagram above, name the technique the student is using to measure beach slope. [1]
(b) Describe how the student would use this method to calculate the slope angle at one point on the beach. [3]
(c) Suggest one limitation of this method when used on a busy public beach. [1]
7. Describe the systematic sampling method. Explain one situation in which it would be more appropriate than random sampling for a fieldwork investigation. [4]
8. A student is measuring discharge of a small stream.
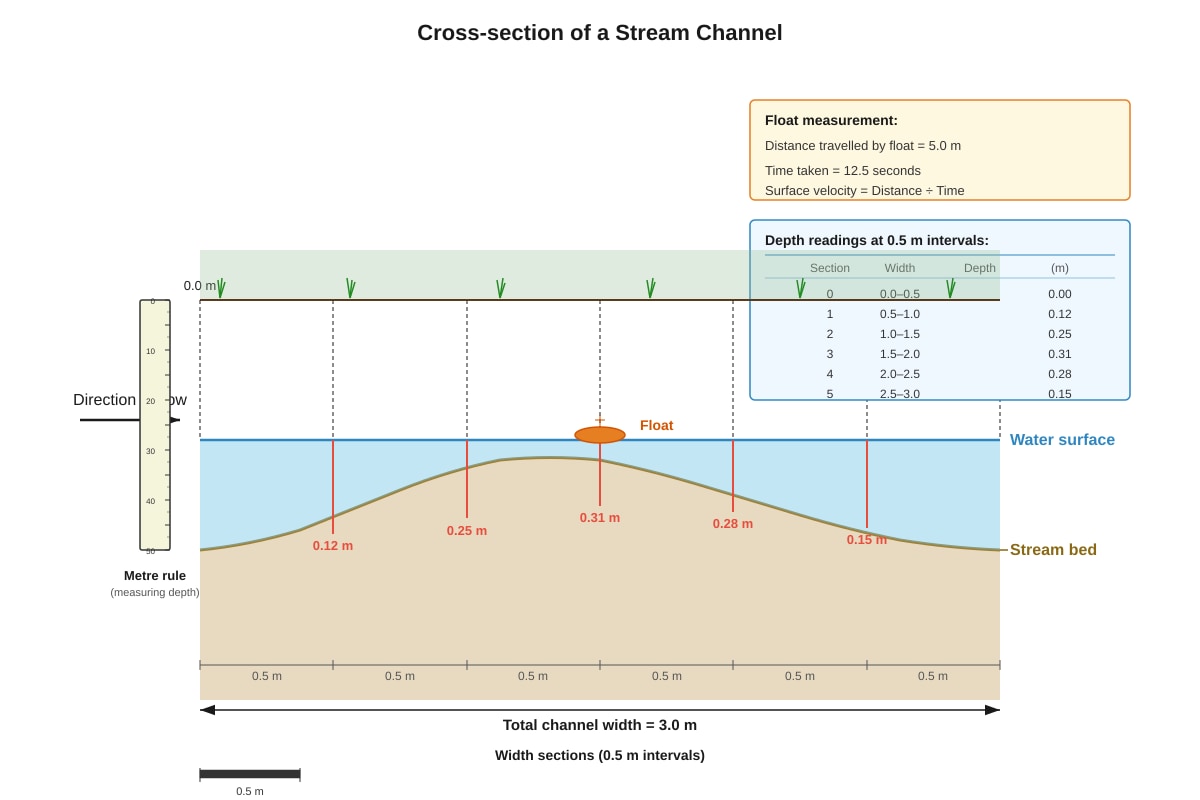
Generated diagram for Q8.
(a) Using the information in the diagram, calculate the cross-sectional area of the stream. Show your working. [3]
(b) The float took 12.5 seconds to travel 5.0 metres. Calculate the surface velocity of the stream in m/s. [2]
(c) Explain why the actual mean velocity of the stream is lower than the surface velocity, and state the correction factor typically applied. [2]
9. A student is investigating land use changes in an urban area using field sketching and photographic evidence.
(a) State two pieces of information a field sketch should include to be useful as geographical evidence. [2]
(b) Explain one advantage and one limitation of using photographs as a method of data collection in fieldwork. [2]
10. Describe how stratified random sampling could be used to select households for a questionnaire survey about water consumption across three different residential zones (high-income, middle-income, low-income). [4]
Section C: Data Presentation, Analysis, and Evaluation (Questions 11–15)
11. The table below shows the results of a student's investigation into the relationship between distance from a city centre and pedestrian flow (people per 5 minutes).
| Distance from city centre (km) | Pedestrian flow (people per 5 min) |
|---|---|
| 0.0 | 142 |
| 0.5 | 118 |
| 1.0 | 89 |
| 1.5 | 64 |
| 2.0 | 41 |
| 2.5 | 28 |
| 3.0 | 15 |
(a) Name an appropriate graphical technique to present this data. Justify your choice. [2]
(b) Describe the relationship between distance from the city centre and pedestrian flow shown in the data. [2]
(c) Calculate the percentage decrease in pedestrian flow between 0.0 km and 3.0 km from the city centre. Show your working. [2]
12. A student collected soil moisture content data at 10 sites along a transect from a riverbank into a grassland area. The results are shown below.
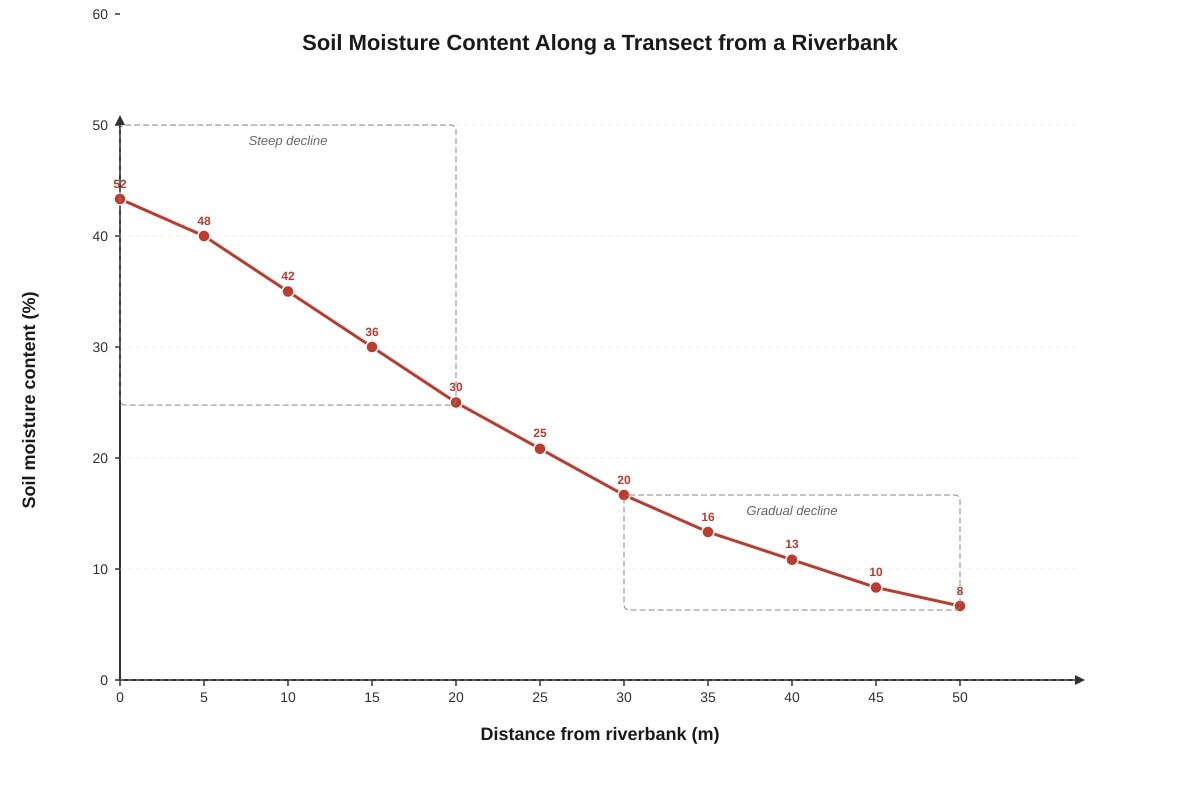
Generated graph for Q12.
(a) Describe the trend shown in the graph. [3]
(b) Suggest a geographical reason for the pattern observed. [2]
13. A student used Spearman's rank correlation coefficient to analyse the relationship between shop rental cost (S/month)anddistancefromaMassRapidTransit(MRT)stationinacommercialdistrict.Thecalculatedvalueofr_swas-0.87$.
(a) State what this value indicates about the relationship between the two variables. [2]
(b) The critical value for rs at the 0.05 significance level for 10 pairs of data is 0.648. Explain whether the student's result is statistically significant. [2]
(c) Explain one limitation of using Spearman's rank correlation to draw conclusions about the relationship between rental cost and distance from the MRT station. [2]
14. A student conducted a χ2 (chi-squared) test to determine whether there is a significant association between type of land use (residential, commercial, industrial) and level of air pollution (low, moderate, high) in a study area. The calculated χ2 value was 12.34 and the critical value at the 0.05 significance level was 9.488.
(a) State the null hypothesis for this test. [1]
(b) Explain whether the student should reject or accept the null hypothesis. Justify your answer. [2]
(c) Explain one reason why statistical significance does not necessarily imply a causal relationship between land use type and air pollution level. [2]
15. The following data was collected by students measuring the velocity of a river at two cross-sections (A and B).
| Cross-section | Width (m) | Mean depth (m) | Mean velocity (m/s) |
|---|---|---|---|
| A | 4.2 | 0.85 | 0.62 |
| B | 6.8 | 1.20 | 0.45 |
(a) Calculate the discharge at each cross-section. Show your working. [4]
(b) Suggest one reason why the discharge values at Cross-sections A and B might differ, assuming no tributaries join the river between the two sections. [2]
Section D: Evaluation and Conclusions (Questions 16–20)
16. A student investigated the effectiveness of coastal management strategies at two sites: Site X (protected by groynes) and Site Y (unprotected). Sediment size was measured at both sites.
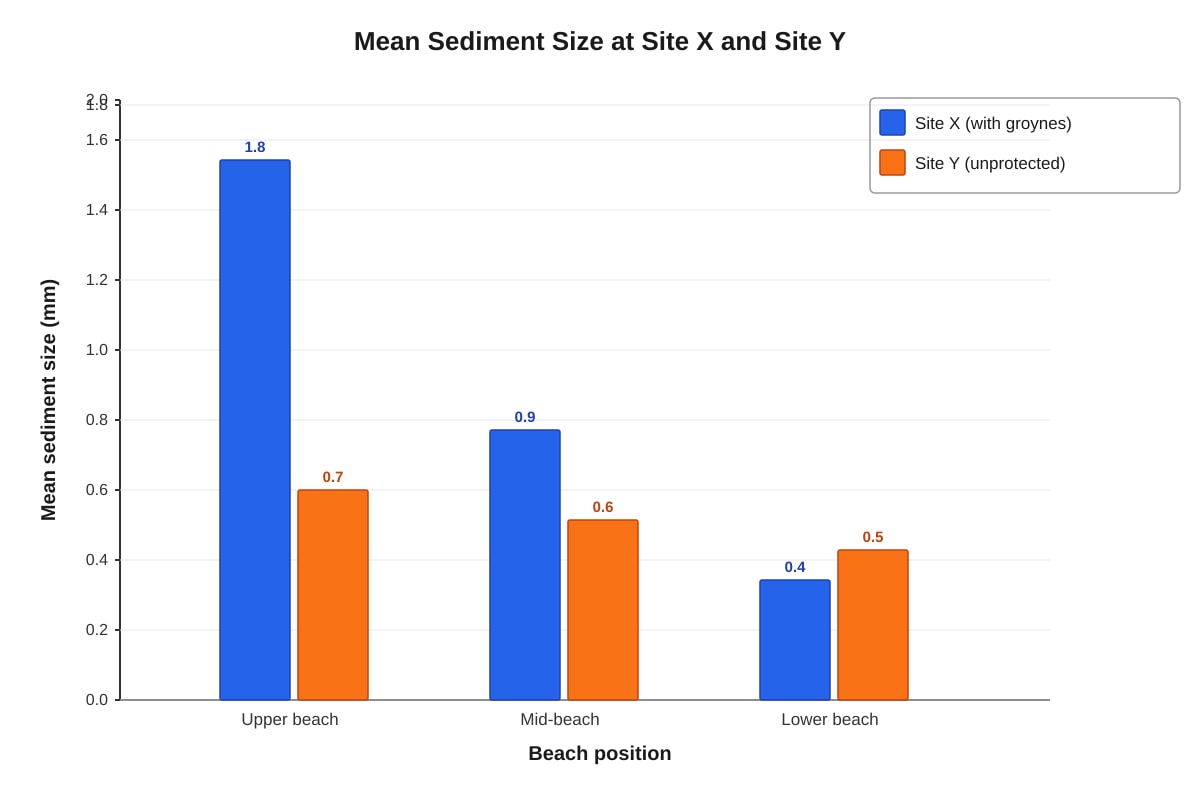
Generated chart for Q16.
(a) Compare the sediment size data for Site X and Site Y. [3]
(b) Using the data, evaluate the effectiveness of groynes as a coastal management strategy. [4]
17. A student conducted a fieldwork investigation on the impact of tourism on a tropical island ecosystem. The student used a combination of quadrat sampling, water quality testing, and semi-structured interviews with local residents.
Discuss the strengths and limitations of using a mixed methods approach in this investigation. [6]
18. A student investigated whether building height affects wind speed at street level in a central business district (CBD). Wind speed was measured at 15 locations using an anemometer. The student concluded that taller buildings significantly reduce wind speed at street level.
Evaluate the reliability of this conclusion. In your answer, consider the sampling strategy, sample size, and potential sources of error. [6]
19. A student used GIS (Geographic Information Systems) to analyse deforestation patterns in Borneo over a 20-year period.
(a) Explain two advantages of using GIS for this type of geographical investigation. [4]
(b) Explain one limitation of relying solely on GIS data to draw conclusions about deforestation. [2]
20. A group of students completed a fieldwork investigation on urban quality of life across five neighbourhoods in Singapore. They used environmental quality surveys, questionnaires, and secondary data from government sources. Their findings showed significant variation in quality of life scores between neighbourhoods.
To what extent do you think fieldwork is the most effective way to investigate urban quality of life? In your answer, consider the value of fieldwork compared to other approaches such as remote sensing, secondary data analysis, and desktop studies. [8]
End of Quiz
Total Marks: 60 | Duration: 90 minutes
Answers
A-Level Geography H2 Quiz - Fieldwork: Answer Key
Section A: Research Design and Planning
Question 1 [3 marks]
Answer: A hypothesis is a testable, predictive statement that proposes a relationship between two or more variables in a geographical investigation. It is usually written as a formal statement that can be supported or refuted through data collection and analysis.
Example hypothesis: "Areas with less than 20% vegetation cover in [City] will record surface temperatures at least 3°C higher than areas with more than 60% vegetation cover during midday in July."
Marking notes:
- 1 mark for a correct definition (must include the idea of a testable/predictive statement about a relationship).
- 1 mark for identifying the two linked variables (vegetation cover and temperature).
- 1 mark for making the hypothesis testable/measurable (includes quantifiable values or clear comparison).
- A hypothesis that is too vague (e.g., "vegetation affects temperature") loses the third mark.
Question 2 [4 marks]
(a) [2 marks]
Answer:
- Independent variable: Vegetation cover (e.g., percentage of ground covered by vegetation, or type of surface: grass, bare soil, paved area).
- Dependent variable: Soil infiltration rate (e.g., time for a fixed volume of water to infiltrate, measured in mm/min or seconds).
Marking notes: 1 mark each. The independent variable is what the student changes/manipulates; the dependent variable is what is measured as a result.
(b) [2 marks]
Answer (any two of the following):
- Volume of water used in each test
- Type of soil (same soil type/location)
- Temperature at the time of testing
- Slope gradient of the test area
- Initial moisture content of the soil
- Method of pouring water (height, rate)
Marking notes: 1 mark each. Answers must be variables that could affect infiltration rate and that should be kept constant to ensure a fair test.
Question 3 [3 marks]
Answer: A pilot study is a small-scale trial run of the full investigation carried out before the main data collection. It is important because:
- It allows the researcher to test and refine data collection methods (e.g., questionnaire wording, equipment use, sampling technique) to identify practical problems before committing to the full study.
- It helps estimate the time and resources required for the full investigation, improving planning and feasibility.
- It enables the researcher to check whether the chosen methods will actually generate useful, relevant data to answer the research question or test the hypothesis.
Marking notes: 1 mark for defining a pilot study; 2 marks for explaining its importance (at least two valid points, or one well-developed point with detail).
Question 4 [4 marks]
(a) [2 marks]
Answer (any two of the following):
- Questions should be clear, unambiguous, and easy to understand
- Questions should be relevant to the research question/aim
- The questionnaire should be concise (not too long) to avoid respondent fatigue
- A mix of closed and open questions should be used
- Questions should be neutral (not leading)
- There should be a logical sequence/order to the questions
Marking notes: 1 mark each.
(b) [2 marks]
Answer:
- Closed question example: "On a scale of 1 (very low) to 5 (very high), how would you rate your risk of flooding?" OR "Have you experienced flooding in the past 5 years? (Yes / No)"
- Open question example: "What do you think are the main causes of flood risk in this area?" OR "How has flood risk affected your daily life?"
Marking notes: 1 mark each. The closed question must have fixed response options. The open question must allow the respondent to answer freely in their own words.
Question 5 [4 marks]
Answer:
- Primary data is data collected firsthand by the researcher specifically for their investigation. It is original and has not been previously published. Examples: measurements of river velocity taken in the field, responses from a questionnaire survey, field sketches, photographs taken by the researcher, soil samples collected and tested.
- Secondary data is data that has already been collected by someone else for a different purpose and is being reused by the researcher. Examples: census data from the Singapore Department of Statistics, satellite imagery from Google Earth, published research articles, topographic maps from the Singapore Land Authority, rainfall data from the Meteorological Service.
Marking notes: 2 marks for a clear distinction between primary and secondary data (must include the idea of firsthand vs. pre-existing data). 1 mark each for a valid example of each type.
Section B: Data Collection Methods
Question 6 [5 marks]
(a) [1 mark]
Answer: The technique is the ranging pole and clinometer method (also known as the slope and clinometer method or gradient survey).
(b) [3 marks]
Answer:
- Two ranging poles are placed vertically at two points on the beach slope, a known horizontal distance apart (e.g., 10 m).
- The student stands at one pole and uses a clinometer to sight the other pole at the same height (eye level).
- The clinometer reading gives the angle of slope between the two points. This angle, combined with the distance between the poles, allows the gradient to be calculated or directly read.
Marking notes: 1 mark for placing poles at a known distance; 1 mark for using the clinometer to measure the angle; 1 mark for explaining that the angle reading gives the slope.
(c) [1 mark]
Answer (any one of the following):
- Members of the public may obstruct the measurement or walk between the ranging poles
- The beach surface may be uneven, making it difficult to place poles vertically
- Safety concerns if the beach is busy or the area is hazardous
Question 7 [4 marks]
Answer: Systematic sampling involves selecting samples at regular, fixed intervals from a sampling frame or along a transect. For example, every 5th person entering a shopping centre could be surveyed, or measurements could be taken every 10 metres along a beach transect.
Systematic sampling is more appropriate than random sampling when:
- The study requires even spatial coverage across a study area (e.g., measuring vegetation change along a transect from a river into a forest). Random sampling might cluster samples in one area and leave gaps elsewhere, whereas systematic sampling ensures the entire area is represented.
- It is more practical and time-efficient in the field, as the researcher follows a simple, repeatable rule rather than using random number generators.
Marking notes: 2 marks for a clear description of systematic sampling (must include the idea of fixed/regular intervals). 2 marks for a valid explanation of when it is more appropriate than random sampling (must include a clear reason, not just a restatement of the definition).
Question 8 [7 marks]
(a) [3 marks]
Answer: The cross-sectional area is calculated by dividing the channel into vertical strips and summing the area of each strip.
Each strip has a width of 0.5 m.
| Section | Width (m) | Depth (m) | Area of section (m²) |
|---|---|---|---|
| 1 | 0.5 | 0.0 | 0.00 |
| 2 | 0.5 | 0.12 | 0.06 |
| 3 | 0.5 | 0.25 | 0.125 |
| 4 | 0.5 | 0.31 | 0.155 |
| 5 | 0.5 | 0.28 | 0.14 |
| 6 | 0.5 | 0.15 | 0.075 |
| 7 | 0.5 | 0.0 | 0.00 |
Total cross-sectional area = 0.00+0.06+0.125+0.155+0.14+0.075+0.00=0.555 m²
Marking notes: 1 mark for the correct method (summing strip areas); 1 mark for correct individual calculations; 1 mark for the correct final answer (0.555 m² or 0.56 m² to 2 s.f.).
(b) [2 marks]
Answer: Velocity=TimeDistance=12.5 s5.0 m=0.40 m/s
Marking notes: 1 mark for correct formula; 1 mark for correct answer with unit.
(c) [2 marks]
Answer: The actual mean velocity is lower than the surface velocity because friction between the water and the stream bed slows down water near the bottom of the channel. The surface moves fastest because it experiences the least friction.
The correction factor typically applied is 0.85 (i.e., mean velocity = surface velocity × 0.85).
Marking notes: 1 mark for explaining friction at the stream bed; 1 mark for stating the correction factor of 0.85.
Question 9 [4 marks]
(a) [2 marks]
Answer (any two of the following):
- A title describing the location and subject of the sketch
- A compass direction/orientation
- Labels identifying key features
- A scale or indication of relative size/distance
- Annotations explaining features or processes observed
- The date and time of the sketch
Marking notes: 1 mark each.
(b) [2 marks]
Answer:
- Advantage: Photographs provide a permanent, objective visual record of conditions at the time of the visit, which can be analysed later and compared with other sites or time periods. They capture detail that might be missed in a field sketch.
- Limitation: Photographs may not clearly show the specific features the researcher is interested in if the angle, lighting, or framing is poor. They can also be subjective in terms of what the photographer chooses to include or exclude from the frame.
Marking notes: 1 mark for a valid advantage; 1 mark for a valid limitation.
Question 10 [4 marks]
Answer: Stratified random sampling involves dividing the population into distinct subgroups (strata) based on a relevant characteristic, then randomly sampling within each stratum.
In this case:
- The researcher divides all households in the study area into three strata based on residential zone: high-income, middle-income, and low-income.
- Within each zone, households are randomly selected (e.g., using a random number generator applied to a list of addresses or a map grid).
- The number of households sampled from each zone could be proportional to the total number of households in that zone (proportional stratified sampling) or equal across zones to allow direct comparison.
This method ensures that all three residential types are represented in the sample, which simple random sampling might not guarantee if one zone has far fewer households than the others.
Marking notes: 1 mark for defining stratified sampling (dividing into subgroups/strata); 1 mark for explaining random selection within each stratum; 1 mark for applying the method to the three residential zones; 1 mark for explaining why this is more appropriate than simple random sampling in this context.
Section C: Data Presentation, Analysis, and Evaluation
Question 11 [6 marks]
(a) [2 marks]
Answer: A scatter graph (scatter plot) with a line of best fit is appropriate. This is because both variables are continuous/quantitative data, and the graph would allow the relationship (correlation) between distance and pedestrian flow to be clearly visualised.
Alternative acceptable answer: A line graph could also be used since the data shows a continuous change along a distance gradient.
Marking notes: 1 mark for naming an appropriate technique; 1 mark for justifying the choice with reference to the data type or purpose.
(b) [2 marks]
Answer: As distance from the city centre increases, pedestrian flow decreases. The relationship is inversely proportional — pedestrian flow is highest at the city centre (142 people per 5 min) and decreases steadily to a minimum of 15 people per 5 min at 3.0 km. The rate of decrease is steepest between 0.0 and 1.5 km, and becomes more gradual beyond 2.0 km.
Marking notes: 1 mark for describing the overall trend (decrease with distance); 1 mark for referencing specific data values or noting the changing rate of decrease.
(c) [2 marks]
Answer: Percentage decrease=142142−15×100=142127×100=89.4%
Marking notes: 1 mark for correct method (showing the calculation); 1 mark for the correct answer (89.4% or 89%).
Question 12 [5 marks]
(a) [3 marks]
Answer: Soil moisture content decreases with increasing distance from the riverbank. At 0 m from the riverbank, soil moisture is approximately 52%, and it declines steadily to approximately 8% at 50 m. The decline is steepest in the first 20 m (from 52% to 30%, a drop of 22 percentage points), after which the rate of decrease becomes more gradual, with moisture content falling from 20% at 30 m to 8% at 50 m (a drop of only 12 percentage points over 20 m).
Marking notes: 1 mark for stating the overall trend (decrease with distance); 1 mark for quoting specific values from the graph; 1 mark for describing the changing rate of decline (steep then gradual).
(b) [2 marks]
Answer: The pattern can be explained by the proximity to the river. Soils closest to the riverbank receive more lateral seepage of water from the river and have a higher water table, resulting in greater soil moisture. As distance from the river increases, the influence of river water diminishes, the water table drops, and the soil becomes drier. The steep decline near the riverbank reflects the rapid decrease in the river's influence over short distances.
Marking notes: 1 mark for linking the pattern to proximity to the river/water table; 1 mark for explaining the mechanism (lateral seepage, water table depth).
Question 13 [6 marks]
(a) [2 marks]
Answer: The value of rs=−0.87 indicates a strong negative (inverse) correlation between shop rental cost and distance from the MRT station. This means that as distance from the MRT station increases, shop rental cost tends to decrease. The value is close to -1, indicating the relationship is strong.
Marking notes: 1 mark for identifying the direction (negative/inverse); 1 mark for identifying the strength (strong, as it is close to -1).
(b) [2 marks]
Answer: Since the calculated value of ∣rs∣=0.87 is greater than the critical value of 0.648 at the 0.05 significance level, the result is statistically significant. This means there is less than a 5% probability that the observed correlation occurred by chance, and the student can reject the null hypothesis of no correlation.
Marking notes: 1 mark for comparing the calculated value to the critical value; 1 mark for concluding that the result is significant and explaining what this means.
(c) [2 marks]
Answer (any one of the following):
- Spearman's rank correlation only measures the strength and direction of a monotonic relationship; it does not prove that one variable causes the other. Other factors (e.g., shop size, foot traffic, type of business) may also influence rental cost.
- The test does not account for confounding variables — for example, shops near the MRT may also be in older buildings or have different lease terms, which could independently affect rental cost.
- The correlation is based on ranked data, which loses some of the precision of the original data.
Marking notes: 2 marks for a clear, well-explained limitation. 1 mark for identifying a valid limitation without sufficient explanation.
Question 14 [5 marks]
(a) [1 mark]
Answer: The null hypothesis (H0) is: There is no significant association between type of land use and level of air pollution in the study area.
(b) [2 marks]
Answer: Since the calculated χ2 value (12.34) is greater than the critical value (9.488) at the 0.05 significance level, the student should reject the null hypothesis. This means there is a statistically significant association between land use type and air pollution level — the observed differences in pollution levels across land use types are unlikely to have occurred by chance.
Marking notes: 1 mark for stating "reject the null hypothesis"; 1 mark for justifying with reference to the comparison of calculated and critical values.
(c) [2 marks]
Answer: Statistical significance only tells us that an association exists in the data; it does not prove that land use type causes differences in air pollution. There may be confounding variables (e.g., traffic volume, industrial activity, wind patterns) that are associated with both land use type and pollution levels. Additionally, the χ2 test does not indicate the direction or mechanism of the relationship — it only confirms that the variables are not independent.
Marking notes: 1 mark for explaining that correlation ≠ causation; 1 mark for identifying a confounding variable or explaining why the test alone is insufficient to establish causation.
Question 15 [6 marks]
(a) [4 marks]
Answer: Discharge (Q) = Cross-sectional area (A) × Mean velocity (v) And A = Width (w) × Mean depth (d)
Cross-section A: QA=w×d×v=4.2×0.85×0.62=2.21 m3/s
Cross-section B: QB=w×d×v=6.8×1.20×0.45=3.67 m3/s
Marking notes: 1 mark for the correct formula for each cross-section; 1 mark for correct substitution for each; 1 mark for correct answer for A; 1 mark for correct answer for B. Allow follow-through if the formula is correct but arithmetic is wrong.
(b) [2 marks]
Answer (any one of the following):
- Measurement error: The anemometer (or flow meter) readings may not be perfectly accurate, or the mean depth/width may have been estimated rather than precisely measured.
- Temporal variation: Velocity fluctuates over time due to turbulence, so a single measurement may not represent the true mean velocity.
- Channel irregularities: The cross-section may not be uniform between the two points, or there may be groundwater seepage adding to the flow.
- Human error in measurement: Parallax error when reading depth, or inconsistent timing of velocity measurements.
Marking notes: 2 marks for a plausible reason with brief explanation. 1 mark for identifying a reason without explanation.
Section D: Evaluation and Conclusions
Question 16 [7 marks]
(a) [3 marks]
Answer: At the upper beach, Site X (with groynes) has a much coarser mean sediment size (1.8 mm) compared to Site Y (0.7 mm). At the mid-beach, Site X has coarser sediment (0.9 mm) than Site Y (0.6 mm). At the lower beach, Site X has finer sediment (0.4 mm) than Site Y (0.5 mm). Overall, sediment size at Site X varies considerably across the beach profile (range of 1.4 mm), while sediment at Site Y is relatively uniform (range of only 0.2 mm).
Marking notes: 1 mark for comparing upper beach values; 1 mark for comparing mid or lower beach values; 1 mark for commenting on the overall variation/range at each site.
(b) [4 marks]
Answer: The data suggests that groynes are effective at trapping sediment on the upper beach. At Site X, the upper beach sediment is much coarser (1.8 mm) than at Site Y (0.7 mm), indicating that the groynes are trapping larger sediment that would otherwise be transported alongshore by longshore drift. This is a key function of groynes — to build up the beach and provide coastal protection.
However, the data also reveals a potential downside: the lower beach at Site X has finer sediment (0.4 mm) than Site Y (0.5 mm), suggesting that while sediment is being trapped on the upper beach, the lower beach may be starved of sediment supply. This could lead to increased erosion downdrift or at the lower beach over time.
Overall, the groynes appear effective at their primary purpose of trapping sediment and building up the upper beach, but the uneven distribution of sediment across the profile suggests that their effectiveness may come at the cost of sediment deficit elsewhere.
Marking notes:
- Level 3 (3–4 marks): Detailed evaluation with reference to the data; considers both effectiveness and limitations; uses geographical terminology.
- Level 2 (2 marks): Some evaluation with reference to the data; may be one-sided.
- Level 1 (1 mark): Simple description of the data without evaluation.
Question 17 [6 marks]
Answer:
Strengths of a mixed methods approach:
-
Triangulation: Using multiple methods allows the researcher to cross-check findings. For example, if quadrat data shows vegetation damage in high-tourism zones AND interview data reveals that residents have observed increased litter and trampling, the convergence of evidence strengthens the validity of the conclusions.
-
Comprehensive understanding: Quantitative methods (quadrat sampling, water quality testing) provide measurable, objective data about the physical impacts of tourism, while qualitative methods (semi-structured interviews) capture the lived experiences, perceptions, and local knowledge of residents. Together, they provide a more complete picture than either approach alone.
-
Overcoming individual method limitations: Quadrat sampling alone cannot explain why vegetation has changed, and interviews alone cannot provide statistically robust evidence of environmental change. Combining methods compensates for the weaknesses of each.
Limitations of a mixed methods approach:
-
Time and resource intensive: Conducting three different types of data collection requires significantly more time, equipment, and expertise than a single-method approach. This may be challenging within the constraints of a student fieldwork investigation.
-
Difficulty in integrating findings: Quantitative and qualitative data may not always align. For example, water quality tests might show acceptable pollution levels, but residents might still perceive the water as polluted. Reconciling contradictory findings can be challenging.
-
Increased complexity in analysis: The student must be competent in both statistical analysis (for quadrat and water quality data) and qualitative analysis (coding interview transcripts), which demands a broader skill set.
Marking notes:
- Level 3 (5–6 marks): Balanced discussion of at least two strengths and two limitations, clearly linked to the context of the investigation; well-structured response.
- Level 2 (3–4 marks): Some strengths and limitations identified; may be unbalanced or lack contextual detail.
- Level 1 (1–2 marks): Generic points about mixed methods without clear application to the investigation.
Question 18 [6 marks]
Answer:
Sampling strategy: The student measured wind speed at 15 locations, but the sampling method is not specified. If the locations were selected conveniently (e.g., only near the tallest buildings), the sample may be biased and not representative of the CBD as a whole. A systematic or stratified sampling approach would improve representativeness.
Sample size: 15 locations may be insufficient to draw a reliable conclusion, especially in a CBD with diverse building heights and street orientations. A larger sample size would reduce the impact of anomalous readings and increase confidence in the result.
Potential sources of error:
- Temporal variation: Wind speed varies constantly due to weather conditions. If measurements were not taken simultaneously or under similar weather conditions, differences may reflect temporal variation rather than the effect of building height.
- Anemometer accuracy and height: If the anemometer was not held at a consistent height above ground level at all locations, readings would not be comparable.
- Street canyon effect: Wind patterns in urban areas are complex. Tall buildings can create wind tunnels that increase wind speed at street level in some locations, which could contradict the student's conclusion if not accounted for.
- Confounding variables: Proximity to open spaces, coastal influences, or prevailing wind direction could independently affect wind speed.
Conclusion: While the finding is plausible based on geographical theory, the reliability of the conclusion is limited by the small sample size, potential sampling bias, and uncontrolled variables. The student should acknowledge these limitations and suggest improvements such as increasing the sample size, using stratified sampling, and taking simultaneous measurements under controlled weather conditions.
Marking notes:
- Level 3 (5–6 marks): Detailed evaluation addressing at least three aspects (sampling strategy, sample size, sources of error); clearly linked to the specific investigation; well-reasoned conclusion about reliability.
- Level 2 (3–4 marks): Some evaluation of reliability with reference to at least two aspects; may lack depth or specificity.
- Level 1 (1–2 marks): Generic comments about reliability without clear application to the investigation.
Question 19 [6 marks]
(a) [4 marks]
Answer (any two of the following, 2 marks each):
-
Spatial analysis capability: GIS allows the researcher to overlay multiple data layers (e.g., forest cover, road networks, settlement patterns, administrative boundaries) to identify spatial relationships and patterns of deforestation that would be difficult to detect from raw data alone. For example, the researcher could analyse whether deforestation is concentrated near roads or in specific administrative regions.
-
Temporal comparison: GIS enables the comparison of satellite imagery from different time periods, allowing the researcher to quantify the rate and extent of deforestation over the 20-year period and identify areas of most rapid change.
-
Large-scale coverage: GIS can process vast amounts of spatial data covering the entire island of Borneo, which would be impossible to survey on foot. This provides a comprehensive overview of deforestation patterns across a large and often inaccessible area.
-
Data visualisation: GIS can produce clear, professional maps and visualisations that effectively communicate findings to different audiences, supporting analysis and presentation of results.
Marking notes: 2 marks per advantage. 1 mark for identifying the advantage; 1 mark for explaining how it benefits the investigation.
(b) [2 marks]
Answer (any one of the following):
- Resolution limitations: Satellite imagery may not detect small-scale or selective logging, meaning GIS data could underestimate the true extent of deforestation.
- Data accuracy: The classification of land cover from satellite imagery may contain errors (e.g., confusing cloud cover with cleared land, or young regrowth with intact forest), leading to inaccurate conclusions.
- Lack of ground truthing: GIS data alone cannot verify what is happening on the ground. Without field verification, the researcher cannot confirm whether areas classified as "deforested" have actually been cleared or are simply experiencing seasonal variation.
- Cannot explain causes: GIS can show where and how much deforestation has occurred, but it cannot explain why — the underlying social, economic, and political drivers require other research methods.
Marking notes: 1 mark for identifying the limitation; 1 mark for explaining why it is a limitation for this investigation.
Question 20 [8 marks]
Answer:
Introduction: Fieldwork involves the direct collection of primary data through observation, measurement, and interaction in the real world. While fieldwork is a powerful approach to investigating urban quality of life, it has both strengths and limitations compared to other methods such as remote sensing, secondary data analysis, and desktop studies. This essay evaluates the extent to which fieldwork is the most effective approach.
Strengths of fieldwork:
- Fieldwork captures lived experience and perception in ways that secondary data cannot. Environmental quality surveys allow researchers to record subjective assessments of noise, cleanliness, greenery, and safety at a granular, neighbourhood level. Questionnaires capture residents' personal experiences, satisfaction, and concerns — dimensions of quality of life that are not captured in census data.
- Fieldwork allows the researcher to observe the actual conditions of the neighbourhoods firsthand, rather than relying on potentially outdated or aggregated secondary data. For example, a researcher can observe the condition of public spaces, the quality of infrastructure, and the presence of amenities that may not be recorded in official statistics.
- The use of primary data means the information is directly relevant to the research question and collected under the researcher's control, ensuring consistency in methodology across the five neighbourhoods.
Limitations of fieldwork:
- Fieldwork is time-consuming and resource-intensive, limiting the scale of the investigation. Five neighbourhoods may not be representative of all urban areas in Singapore, and the sample size of questionnaire respondents may be too small to draw generalisable conclusions.
- Fieldwork data can be subjective and inconsistent. Different researchers may rate environmental quality differently, and questionnaire responses may be influenced by the respondent's mood, social desirability bias, or misunderstanding of questions.
- Fieldwork provides only a snapshot in time and cannot easily capture long-term trends in quality of life.
Value of other approaches:
- Remote sensing (e.g., satellite imagery, LiDAR) can provide objective, large-scale data on urban green cover, building density, surface temperature, and land use across all of Singapore simultaneously. This would allow the researcher to compare neighbourhoods more comprehensively and identify spatial patterns that fieldwork alone might miss. However, remote sensing cannot capture subjective dimensions of quality of life such as residents' satisfaction or sense of community.
- Secondary data analysis (e.g., using data from the Singapore Department of Statistics, Housing Development Board, or National Environment Agency) provides reliable, large-scale, longitudinal data on indicators such as income levels, housing quality, crime rates, and air quality. This data is collected using rigorous, standardised methods and covers the entire population, overcoming the small sample size limitation of fieldwork. However, secondary data may not align perfectly with the researcher's specific focus, and it may be aggregated at a scale that masks neighbourhood-level variation.
- Desktop studies (e.g., reviewing academic literature, government reports, and policy documents) provide context and theoretical framing for the investigation, helping the researcher interpret their findings and understand the broader drivers of urban quality life. However, desktop studies alone cannot generate new, location-specific data.
Conclusion: Fieldwork is a highly effective way to investigate urban quality of life because it captures the subjective, experiential dimensions that other methods cannot. However, it is most effective when combined with other approaches. A mixed-methods strategy that integrates fieldwork with secondary data analysis and remote sensing would provide the most comprehensive and reliable understanding of urban quality of life. Therefore, while fieldwork is essential, it is not sufficient on its own — it is most effective as part of a broader, multi-method approach.
Marking notes:
- Level 4 (7–8 marks): Comprehensive, well-structured response that evaluates fieldwork in detail and compares it with at least two other approaches; uses specific examples relevant to urban quality of life in Singapore; reaches a clear, well-justified conclusion.
- Level 3 (5–6 marks): Good evaluation of fieldwork with some comparison to other approaches; may lack depth in the comparison or the conclusion.
- Level 2 (3–4 marks): Describes fieldwork and mentions other methods but with limited evaluation or comparison.
- Level 1 (1–2 marks): Generic response with little reference to urban quality of life or other approaches.
End of Answer Key
Total Marks: 60
Free quiz and exam paper access
Enter your details to view this paper
Your access is remembered on this device.