AI Generated Quiz
A Level H2 Geography Fieldwork Quiz
Free A Level H2 Geography Fieldwork quiz, HY3 AI version, with questions, answers, and A Level-style practice for Singapore students.
These static practice materials are generated from the site's syllabus and paper-generation workflow, with source and model context shown so students and parents can evaluate the material before use.
Questions
Free quiz and exam paper access
Enter your details to view this paper
Your access is remembered on this device.
Answers
A-Level Geography H2 Quiz - Fieldwork (Answer Key)
Total Marks: 40
Topic: Fieldwork (syllabus-first, AI-inferred from Stage 4 patterns; not claimed as past-year derived)
Q1. [1]
Answer: Fieldwork is the collection of geographical data outside the classroom through direct observation, measurement, and interaction with the environment or people.
Teaching note: Define as experiential learning. Key idea: primary data gathered in real-world settings. Accept any clear definition emphasising direct field observation.
Q2. [2]
Answer: (1) To test methods and equipment for feasibility; (2) To estimate time and resource needs / refine sampling design.
Marking: 1 mark each. Common mistake: confusing pilot with main study.
Q3. [2]
Answer: Type: quantitative primary data (continuous). Limitation: tape may sag or banks irregular, reducing accuracy; single cross-section misses channel variability.
Marking: 1 for type, 1 for limitation.
Q4. [2]
Answer: Primary = collected firsthand by student (e.g., river depth). Secondary = existing data from agencies (e.g., NEA rainfall).
Marking: 1 each. Teach: primary gives control; secondary saves time but less site-specific.
Q5. [2]
Answer: Quadrat sampling; appropriate for vegetation density in a defined area. (Or systematic line transect for gradient.)
Marking: 1 name, 1 context.
Q6. [1]
Answer: Obtain informed consent / respect privacy of residents.
Marking: any ethical point.
Q7. [2]
Answer: Field sketch; purpose = record spatial arrangement of features at site. (Or annotated photo.)
Marking: 1 type, 1 purpose.
Q8. [2]
Answer: Interval = 1 hour. Weakness = no spatial comparison; may miss microclimate variation elsewhere.
Marking: 1 + 1.
Q9. [2]
Answer: To identify hazards (e.g., slippery rocks) and plan mitigation, ensuring student safety and legal compliance.
Marking: 1 identify, 1 explain.
Q10. [1]
Answer: Avoid trampling vegetation / use existing paths.
Marking: 1 mark.
Q11. [2]
Answer: (1) Standardise question wording; (2) Increase sample size / pilot questionnaire.
Marking: 1 each. Teach: reliability = consistency.
Q12. [3]
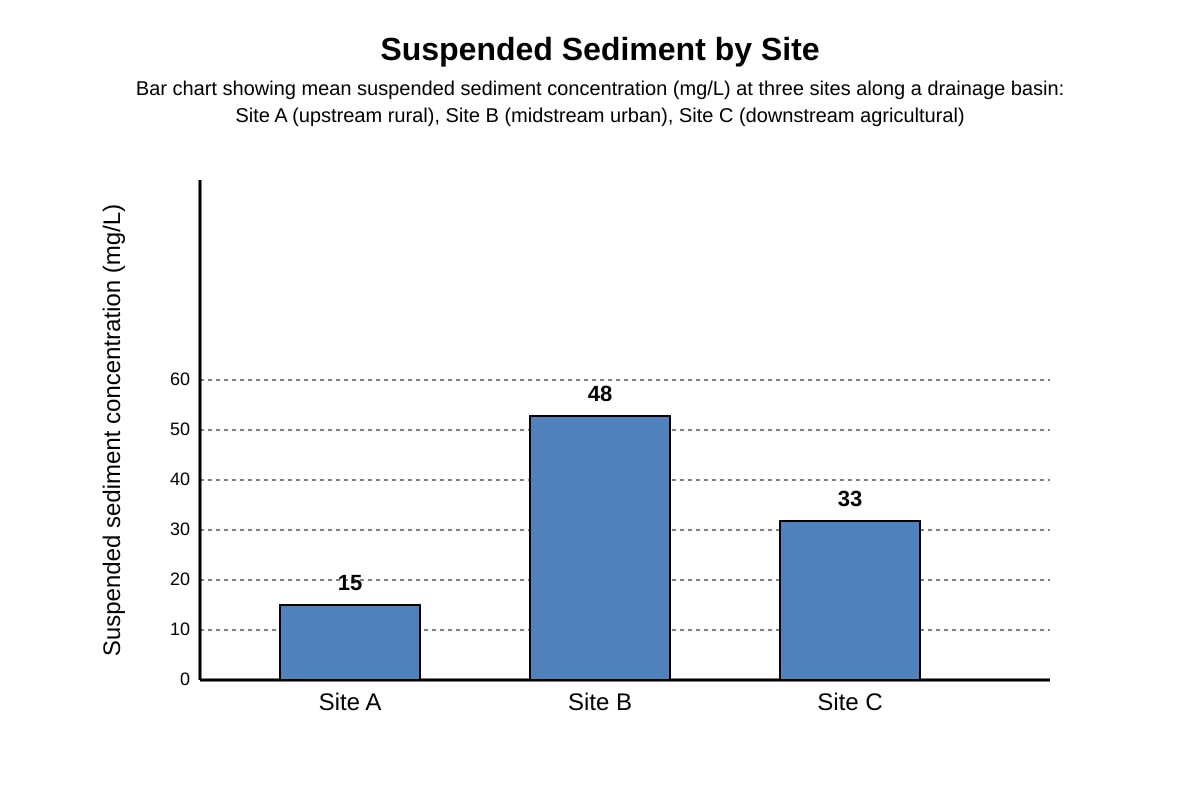
Answer: Sediment rises from 15 mg/L at A to 48 at B (urban peak), then falls to 33 at C. Urban site has highest due to runoff; agricultural lower than urban but above rural.
Marking: 1 for values, 1 for trend, 1 for contextual reason. Image must show bars 15/48/33.
Q13. [3]
Answer: Lay grid over area; place quadrats at regular intervals (e.g., every 5 m); record species at each. Ensures even coverage and reduces bias.
Marking: 1 method, 1 spacing, 1 purpose.
Q14. [3]
Answer: IV = % impervious cover; DV = runoff volume (L); Control = slope / rainfall intensity.
Marking: 1 each. Teach: IV manipulated, DV measured.
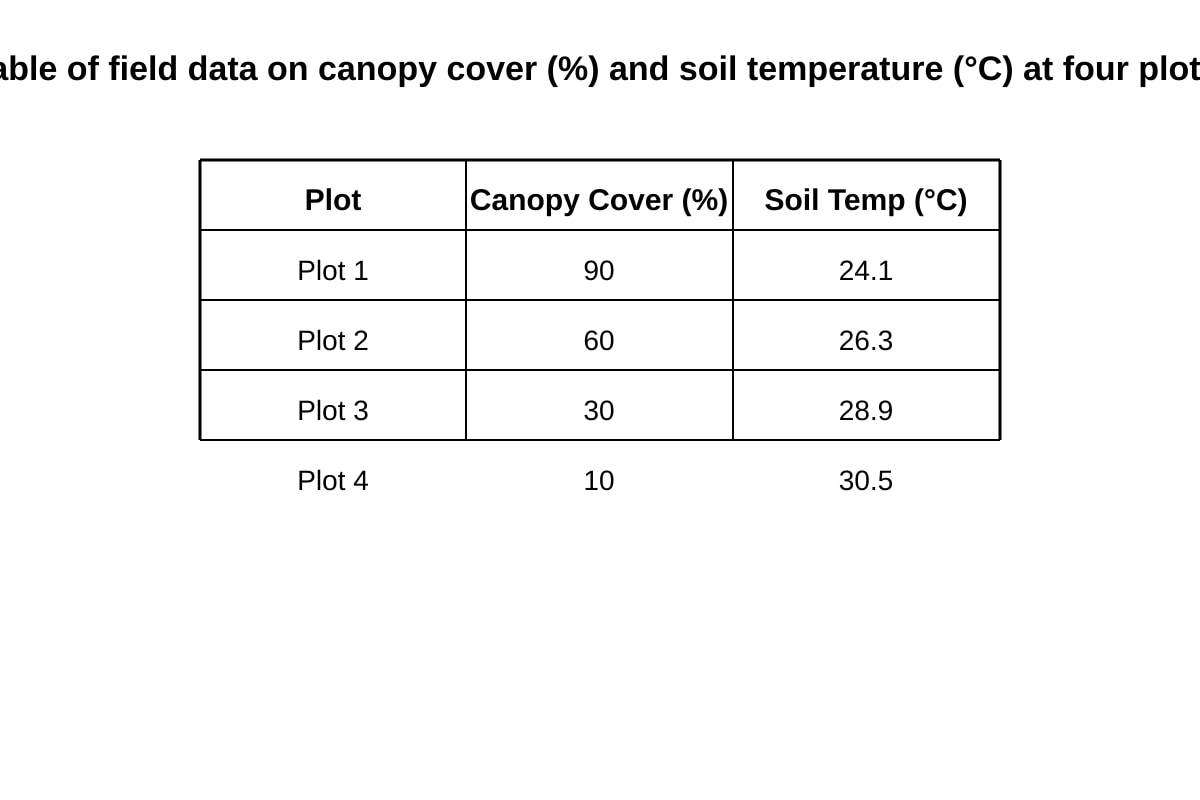
Q15. [3] Answer: As canopy cover decreases (90→10%), soil temp increases (24.1→30.5°C). Canopy shades soil; less cover = more solar heating.
Marking: 1 trend, 1 data, 1 explanation. Table values used.
Q16. [4]
Answer: Strengths: GPS precise, real-time location, route logging. Limitations: battery failure, signal loss in canopy. Paper: no power need but less precise, harder to georeference.
Marking: 2 strengths, 2 limitations (or balanced 2+2). Descriptors: clear comparison.
Q17. [3]
Answer: Method = systematic interval sampling. Advantage = regular, comparable. Limitation = misses off-interval peaks.
Marking: 1 + 1 + 1.
Q18. [3]
Answer: Line graph shows continuous change/trend over time; bar chart compares discrete categories. Wrong choice obscures trend or implies false continuity.
Marking: 1 each aspect.
Q19. [3]
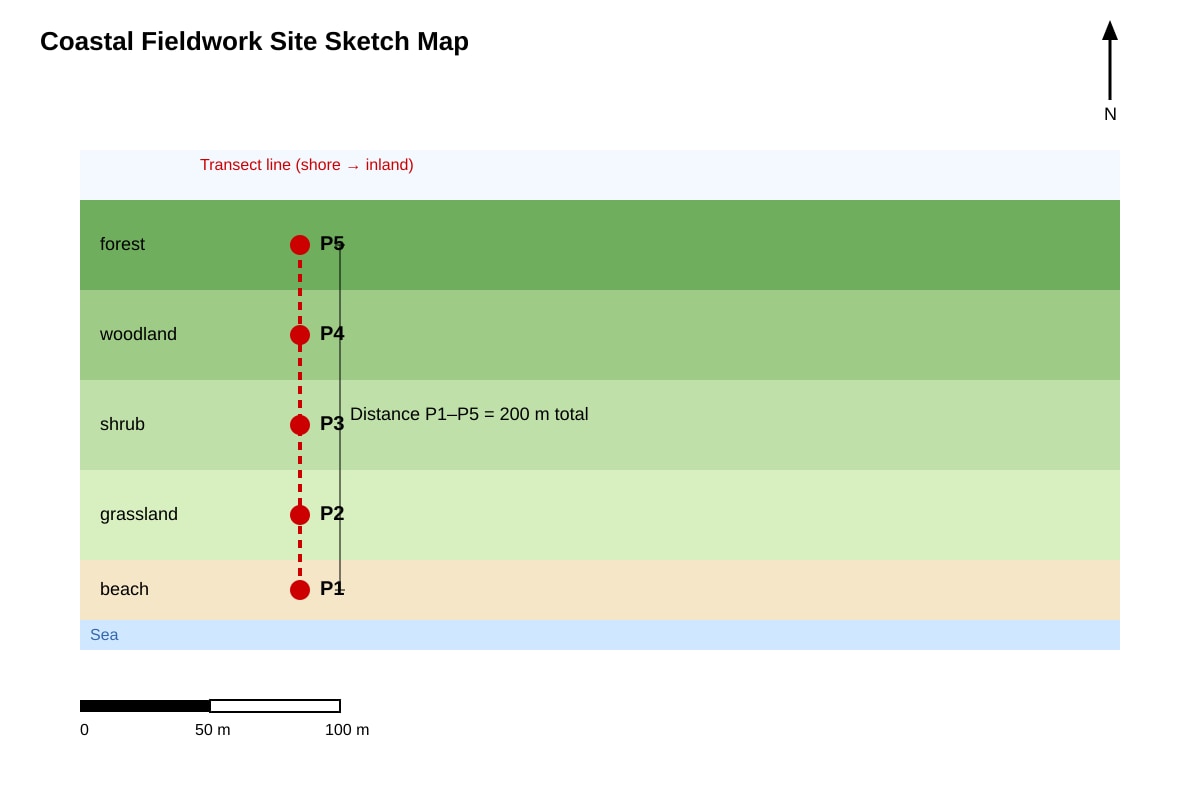
Answer: Space points evenly along 200 m transect (e.g., 40 m apart); captures zonation from shore to forest. Map shows P1–P5 with zones.
Marking: 1 spacing, 1 reason, 1 link to map.
Q20. [4]
Answer: Strength: snapshot of conditions, cost-effective. Limitation: no seasonal variation, weather-specific, cannot infer annual regime.
Marking: 2 strength, 2 limitation. Teach: seasonal discharge needs repeat visits.