From Real Exams Quiz
A Level H2 Geography Human Geography Quiz
Free A Level H2 Geography Human Geography quiz, HY3 Exam version, with questions, answers, and A Level-style practice for Singapore students.
These static practice materials are generated from the site's syllabus and paper-generation workflow, with source and model context shown so students and parents can evaluate the material before use.
Questions
Free quiz and exam paper access
Enter your details to view this paper
Your access is remembered on this device.
Answers
A-Level Geography H2 Quiz - Human Geography: Answer Key
Total Marks: 40
Topic: Human Geography (Cluster 1.2)
Section A Answers (2 marks each)
Q1. [2]
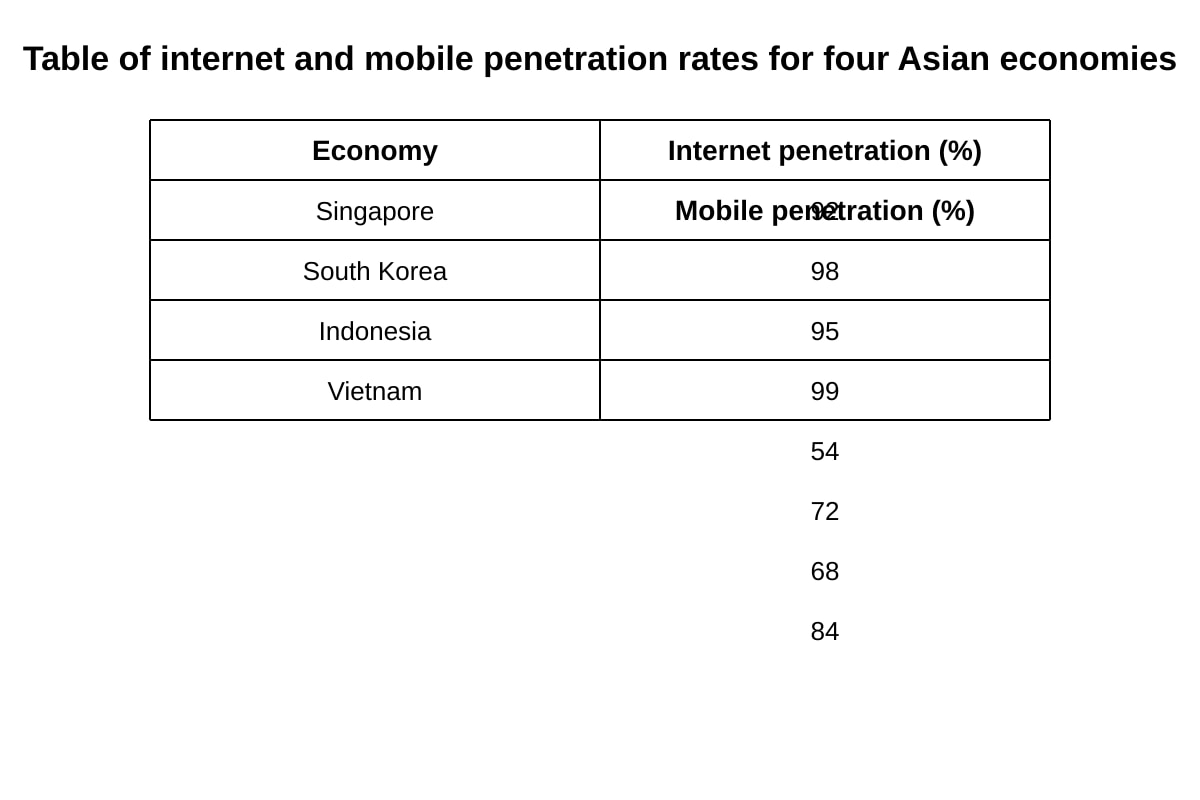
Singapore’s internet penetration (92%) and mobile penetration (98%) are both substantially higher than Indonesia’s 54% and 72% respectively. The gap is 38 percentage points for internet and 26 for mobile, showing a clear digital divide between a high-income city-state and a lower-middle-income large economy.
Marking: 1 mark for correct comparison of internet, 1 mark for mobile + comparative language.
Q2. [2]
East Asia (represented by South Korea 99% mobile) and Southeast Asia (Singapore 98%) both show high mobile penetration; among the four economies listed, Singapore (98%) and South Korea (99%) are highest. If forced to name one macro-region from the table: Southeast Asia (Singapore) or East Asia (South Korea). Accept either with value.
Marking: 1 mark macro-region named, 1 mark correct value referenced.
Q3. [2]
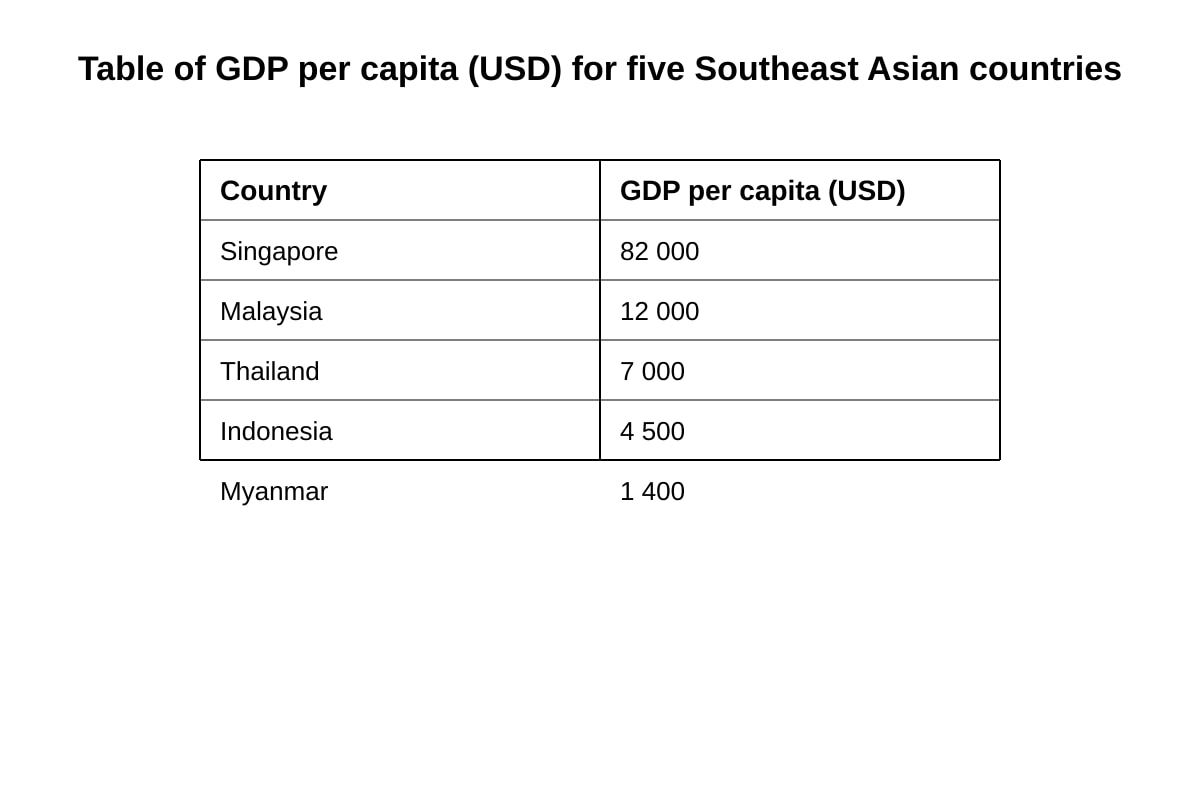
GDP per capita shows uneven development: Singapore (1 400), a ratio of ~59:1 within Southeast Asia.
Marking: 1 mark indicator (GDP per capita), 1 mark use of resource values.
Q4. [2]
Global Production Networks (GPNs).
Marking: 2 marks for full term; 1 mark for "production network".
Q5. [2]
ASEAN, WTO, or World Bank (any one).
Marking: 2 marks for naming one correctly; 1 mark if vague.
Section B Answers
Q6. [6]
ICT: Zara uses point-of-sale (POS) data sent in real time to Spain HQ, allowing rapid demand sensing and replenishment (2m). Transport: air freight moves garments from Morocco to Europe in 48h; regional hubs consolidate shipments (2m). Result: short lead times and flexible response to trends (2m).
Teaching: GPNs rely on info + movement tech to compress time-space.
Q7. [5]
Inter-firm networks link Zara with external suppliers for fabric, trim, and finishing (2m). They allow outsourcing of non-core steps while keeping design in-house (2m). This reduces cost and increases agility (1m).
Marking: 2+2+1.
Q8. [4]
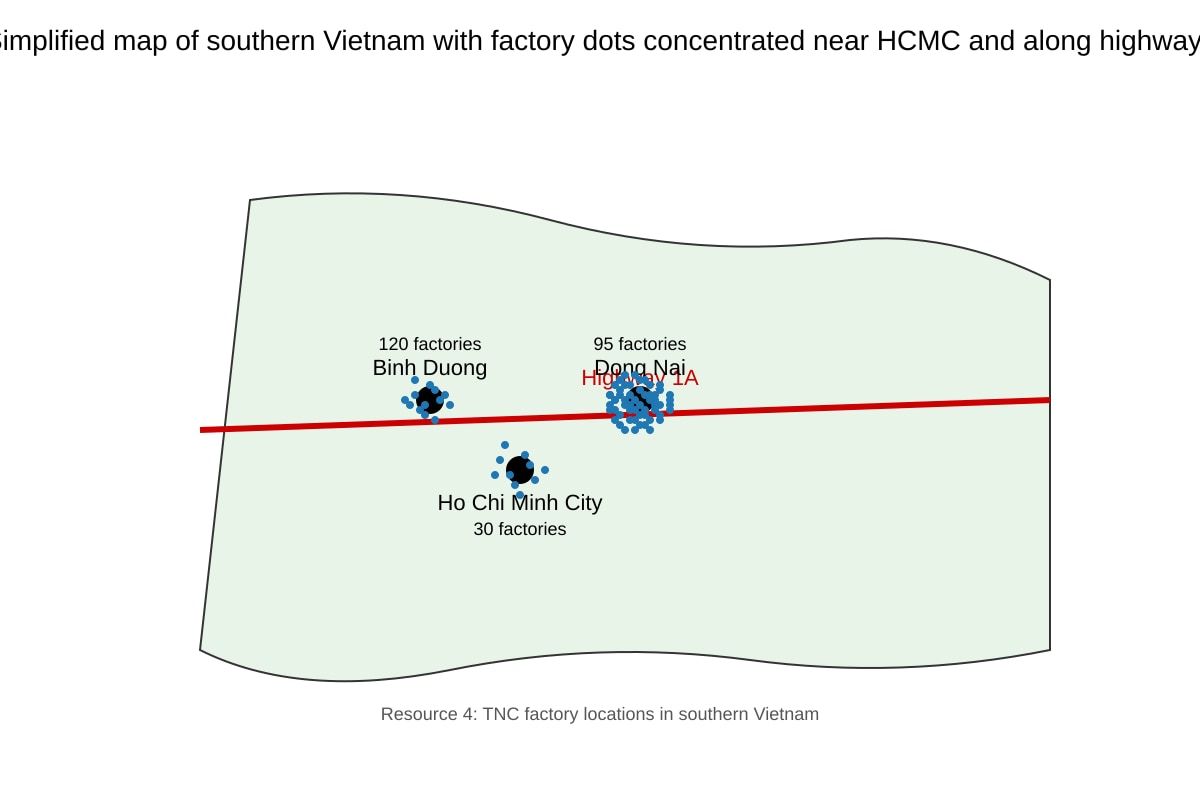
(1) Proximity to HCMC port reduces logistics cost (2m). (2) Highway 1A connectivity enables fast distribution (2m). Also accept cheap labour in Binh Duong/Dong Nai.
Marking: 2 marks per valid reason with reference to map.
Q9. [5]
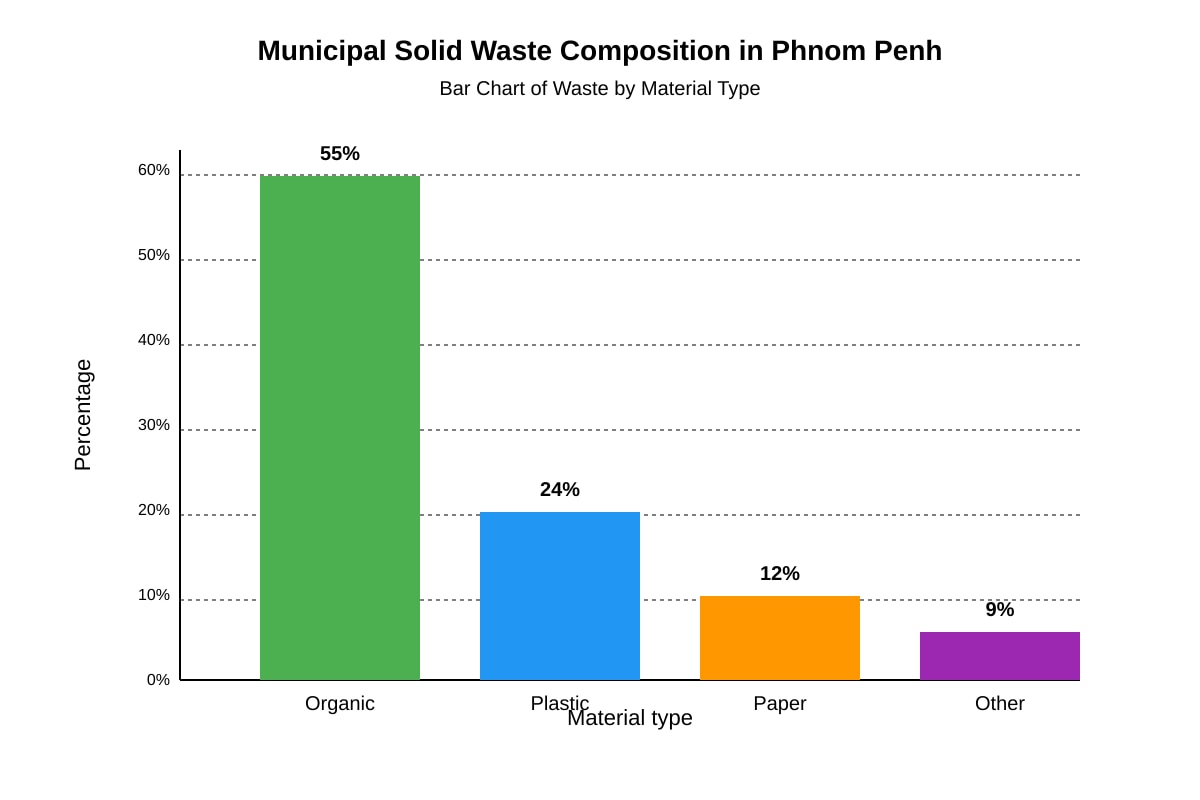
Plastic is 24% of MSW (2m). Account: rapid urban consumption, low recycling infrastructure, import of packaged goods (3m).
Marking: 2 for data, 3 for explanation.
Q10. [5]
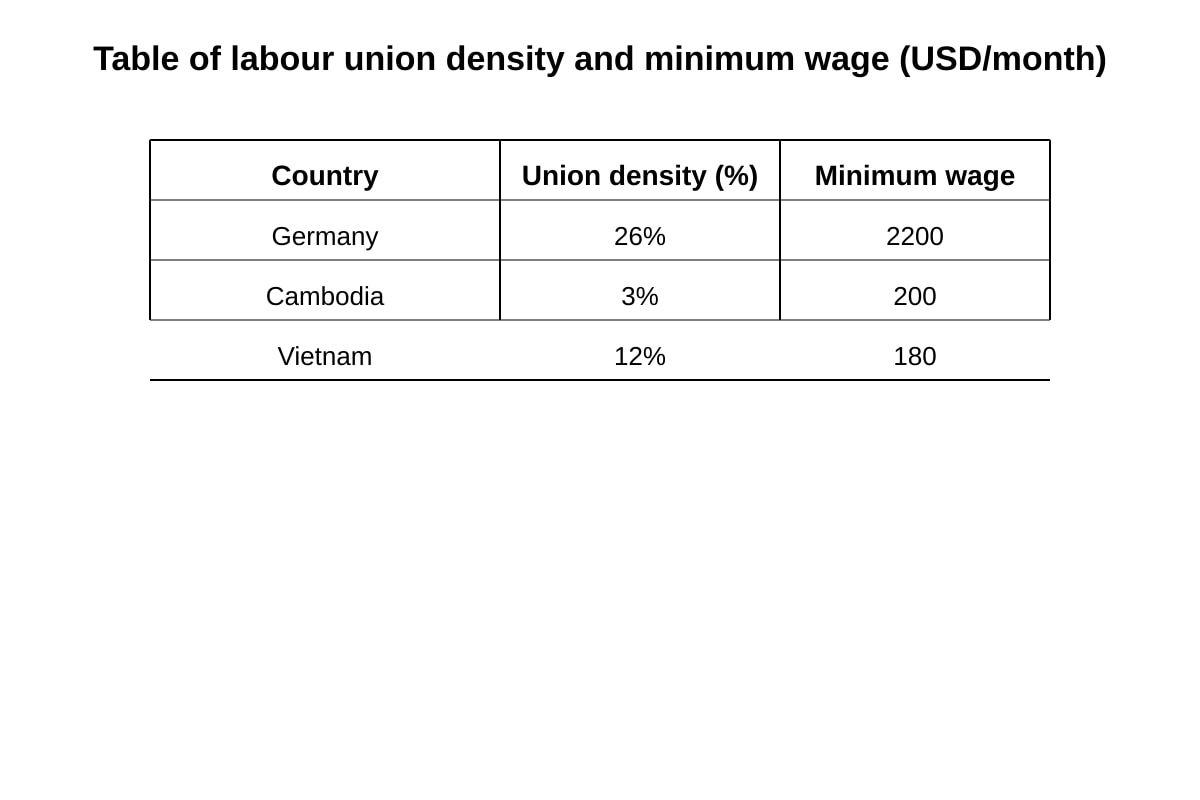
Germany union density 26% vs Cambodia 3% (2m). Germany stronger labour regulation, higher wage (200) (2m). Implication: TNCs face stricter labour constraints in Germany (1m).
Marking: compare + implication.
Q11. [5]
NGOs (e.g., Fair Wear Foundation) audit factories (2m), pressure TNCs via campaigns (2m), support worker unions (1m).
Marking: example + 2 mechanisms.
Q12. [3]
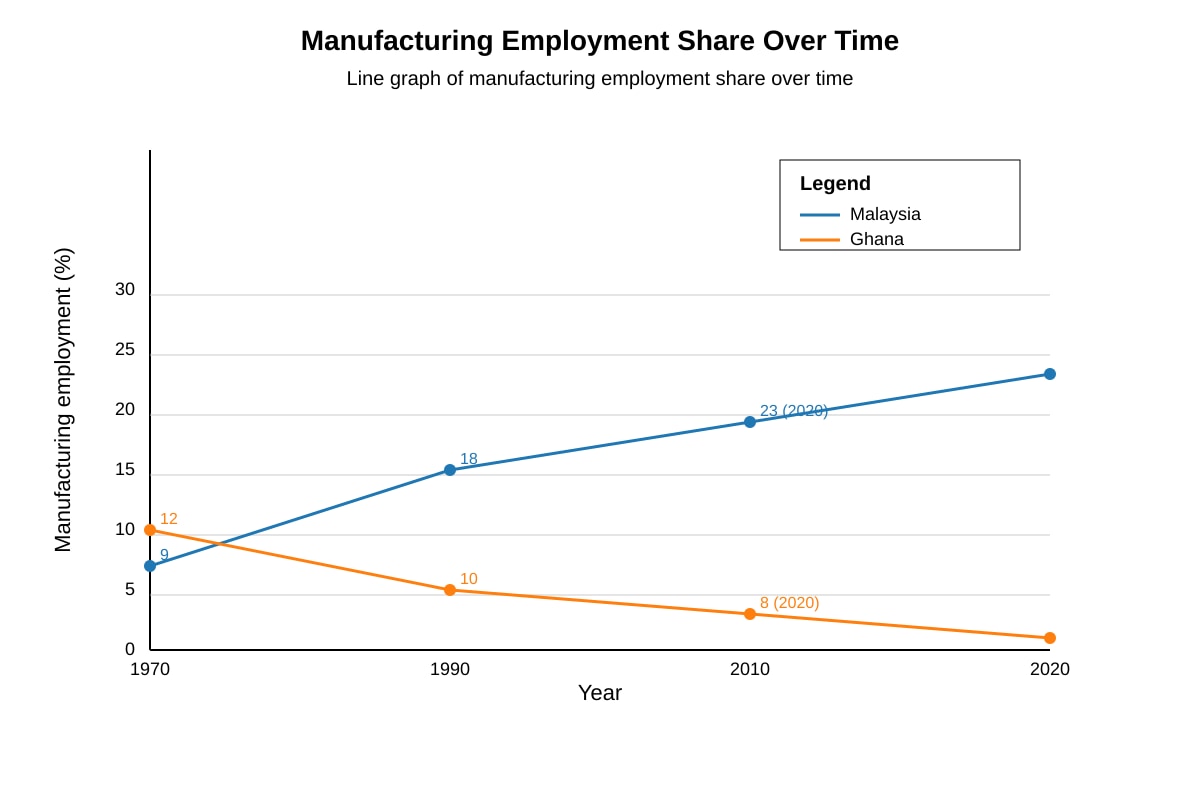
Malaysia rose from 9% (1970) to 23% (2020) (2m), indicating industrialisation (1m).
Marking: trend + interpretation.
Q13. [6]
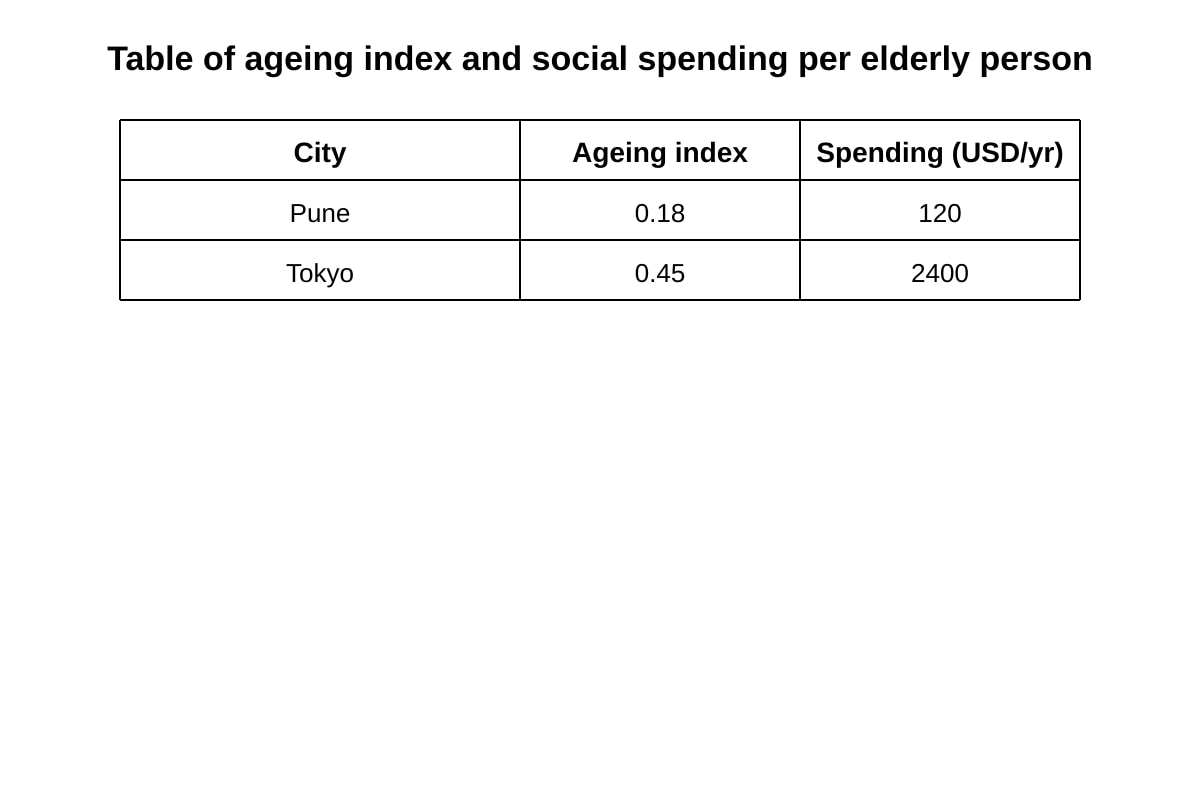
Build elderly care centres (2m), raise social spending toward Tokyo level (2m), train geriatric workers (2m).
Marking: 2 each, linked to low spending/index.
Section C Answers
Q14. [5]
Capital flowed to regions with infrastructure (2m), leaving others marginalised (2m). Result: core-periphery unevenness (1m).
AO2 analysis.
Q15. [5]
Positive: jobs, tech transfer (2m). Negative: profit repatriation, labour exploitation (2m). Conclusion balanced (1m).
Q16. [5]
States set labour/environment laws (2m); but TNCs can relocate if rules strict (2m); examples: Vietnam incentives vs Germany rigidity (1m).
Q17. [5]
From Q1 table: compare SG/KR high vs ID/VN lower (2m). Implication: higher penetration = better integration into knowledge economy (3m).
Q18. [4]
Labour important (2m) but infrastructure, market also matter (2m). Evaluate: not sole factor.
Q19. [3]
ASEAN frees trade, harmonises rules, attracts TNCs (3m: 1 each).
Q20. [5]
Boserup: tech expanded food base (2m). But access uneven, Malthus limits remain for poor (3m). Assess: partially overcome.