From Real Exams Quiz
A Level H2 Geography Fieldwork Quiz
Free A Level H2 Geography Fieldwork quiz, LongCat Exam version, with questions, answers, and A Level-style practice for Singapore students.
These static practice materials are generated from the site's syllabus and paper-generation workflow, with source and model context shown so students and parents can evaluate the material before use.
Questions
A-Level Geography H2 Quiz - Fieldwork
Name: ___________________________ Class: ___________________________ Date: ___________________________ Score: _________ / 60
Duration: 60 minutes
Instructions:
- Answer ALL questions in the spaces provided.
- Read each question carefully and use appropriate geographical terminology.
- Where data or resources are referenced, study them closely before answering.
- For questions requiring evaluation or analysis, ensure responses are well-structured and supported with evidence.
- The number of marks allocated to each question is shown in brackets [ ].
Section A: Research Design and Planning (Questions 1–5)
1. Define the term hypothesis as used in geographical fieldwork. Give one example of a testable hypothesis for a study investigating urban heat islands. [3]
2. A student plans to investigate whether vegetation cover affects soil infiltration rates in a local park.
(a) State one independent variable and one dependent variable for this investigation. [2]
(b) Identify two control variables the student should keep constant to ensure a fair test. [2]
3. Explain why a pilot study is important before undertaking a full geographical investigation. [3]
4. A group of students is planning fieldwork along a river to investigate changes in channel characteristics from source to mouth.
(a) List three potential risks the students might encounter during river fieldwork. [3]
(b) For one of the risks identified in (a), describe a specific risk mitigation measure. [2]
5. Distinguish between primary data and secondary data, giving one example of each that could be used in a coastal fieldwork investigation. [4]
Section B: Sampling and Data Collection Methods (Questions 6–10)
6. A student wants to investigate land use patterns across a town centre. Explain why systematic sampling may be more appropriate than random sampling for this investigation. [3]
7. The table below shows the results of a biotic survey conducted at two sites along a woodland transect.
| Species | Site A (Near Path) | Site B (Deep Woodland) |
|---|---|---|
| Bluebell | 12 | 38 |
| Bracken | 25 | 8 |
| Oak seedling | 3 | 22 |
| Ivy | 30 | 15 |
| Dog's mercury | 2 | 34 |
(a) Calculate the total number of species recorded at each site. [2]
(b) Compare the species composition at the two sites. Suggest one reason for the difference. [4]
8. Describe how you would use a clinometer to measure the angle of a slope during a coastal fieldwork investigation. Include the key steps in your answer. [3]
9. A student is investigating the effect of urbanisation on drainage density. They collect data from six catchments with different levels of impermeable surface cover.
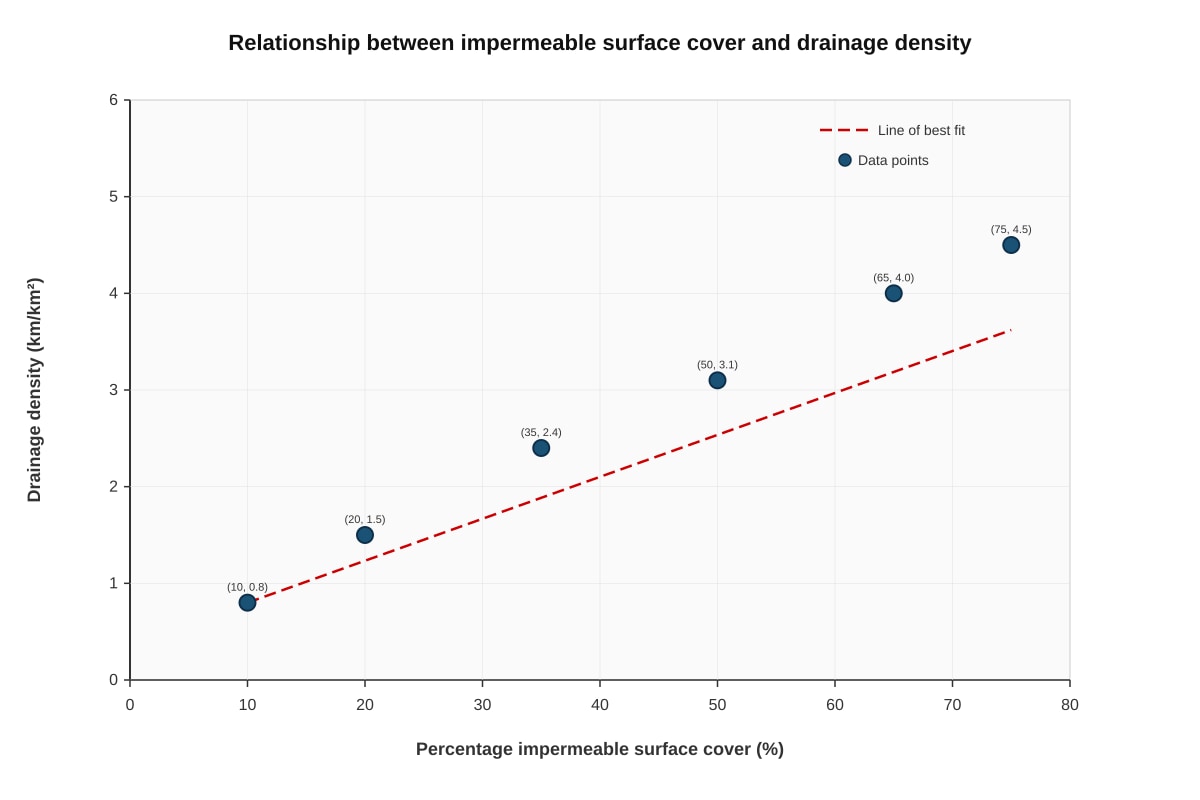
Generated graph for Q9.
(a) Describe the relationship shown in the graph. [3]
(b) Using the data, estimate the drainage density for a catchment with 45% impermeable surface cover. Show your working. [2]
(c) Explain why the relationship shown might not hold true for catchments with over 90% impermeable surface cover. [2]
10. Evaluate the use of questionnaires as a method of data collection for investigating residents' perceptions of flood risk in a low-lying urban area. [5]
Section C: Data Presentation and Analysis (Questions 11–15)
11. State two advantages of using a choropleth map to present spatial data collected during fieldwork. [2]
12. The following data was collected at five sampling points along a beach transect, measured from the waterline landward:
| Distance from waterline (m) | Mean sediment size (mm) | Beach angle (°) |
|---|---|---|
| 0 | 0.3 | 2 |
| 10 | 0.5 | 5 |
| 20 | 1.2 | 8 |
| 30 | 2.1 | 12 |
| 40 | 3.5 | 15 |
(a) Name an appropriate graphical technique to show the relationship between distance from the waterline and mean sediment size. Justify your choice. [2]
(b) Describe the pattern shown by the data for both sediment size and beach angle. [3]
13. A student collected soil moisture content data at 20 locations in a farmland. The results ranged from 8.2% to 34.7%. Explain how the student could use standard deviation to analyse the spread of this data set. [3]
14. The Spearman's Rank Correlation Coefficient was calculated for two variables measured during an investigation into the relationship between distance from a city centre and pedestrian flow rate. The result was rs=+0.89.
(a) Interpret this result. [2]
(b) The critical value at the 0.05 significance level for 10 pairs of data is 0.648. State whether the correlation is statistically significant and explain your reasoning. [2]
(c) Explain why a strong correlation does not necessarily mean there is a causal relationship between the two variables. [2]
15. A student used GIS to map the distribution of air quality index (AQI) values across a city.
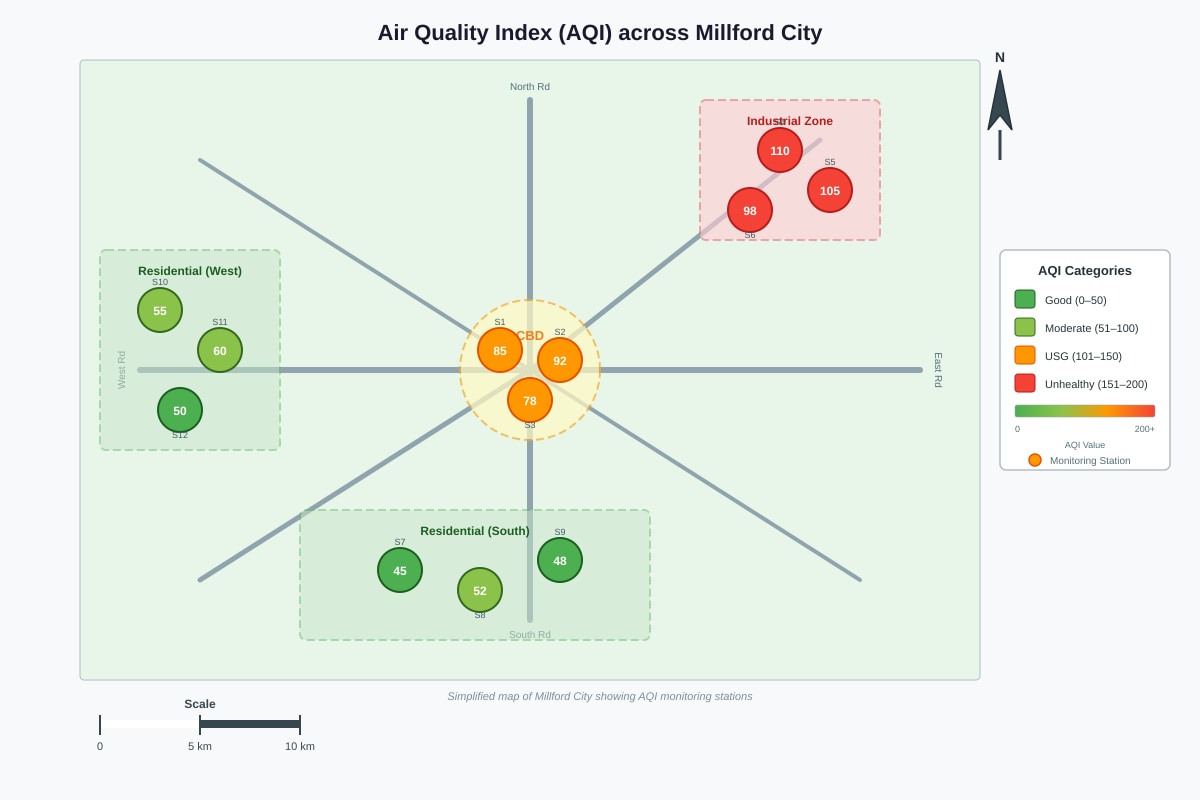
Generated map for Q15.
(a) Describe the spatial pattern of AQI values shown on the map. [4]
(b) Suggest two geographical reasons for the pattern you described. [4]
Section D: Conclusions, Evaluation, and Limitations (Questions 16–20)
16. A student concluded that "coastal erosion rates are highest where wave energy is greatest." State two pieces of evidence the student would need to support this conclusion. [2]
17. A fieldwork investigation into the impact of footpath erosion on vegetation cover produced the following results:
| Distance from footpath edge (m) | Vegetation cover (%) | Soil compaction (kg/cm²) |
|---|---|---|
| 0 | 15 | 3.8 |
| 1 | 32 | 3.2 |
| 2 | 55 | 2.5 |
| 3 | 72 | 1.9 |
| 4 | 80 | 1.6 |
| 5 | 85 | 1.4 |
(a) Describe the relationship between distance from the footpath and vegetation cover. [2]
(b) Explain how soil compaction data supports the conclusion that footpath erosion affects vegetation cover. [3]
18. Evaluate the limitations of using only quantitative data in a fieldwork investigation about the quality of life in a neighbourhood. [5]
19. A student investigated whether building height affects wind speed at street level in an urban area. The hypothesis was: "Taller buildings result in lower wind speeds at street level." The data collected showed a weak negative correlation (rs=−0.32), which was not statistically significant at the 0.05 level.
(a) Explain what this result means in relation to the hypothesis. [3]
(b) Suggest two improvements the student could make to the investigation to obtain more reliable results. [4]
20. Discuss the extent to which fieldwork is essential for developing a comprehensive understanding of geographical processes and patterns. In your answer, refer to specific examples of fieldwork activities and their contribution to geographical understanding. [8]
End of Quiz
Answers
A-Level Geography H2 Quiz - Fieldwork: Answer Key
Section A: Research Design and Planning
Question 1 [3 marks]
Answer: A hypothesis is a tentative, testable statement or prediction that proposes a relationship between two or more variables in a geographical investigation. It provides a clear focus for the investigation and can be supported or refuted through data collection and analysis.
Example hypothesis: "The mean temperature in the central business district of [city] is at least 3°C higher than in the surrounding rural areas due to the urban heat island effect."
Marking scheme:
- Correct definition of hypothesis (1 mark)
- Clear, testable statement (1 mark)
- Relevant to urban heat island study (1 mark)
Common mistakes:
- Students often write aims instead of hypotheses. An aim describes what the investigation intends to find out (e.g., "to investigate urban heat islands"), whereas a hypothesis makes a specific, testable prediction.
- Hypotheses should not be written as questions.
Question 2 [4 marks]
(a) [2 marks]
Answer:
- Independent variable: Vegetation cover (e.g., percentage vegetation cover or type of vegetation)
- Dependent variable: Soil infiltration rate (e.g., measured in mm/hr)
Marking scheme:
- 1 mark for correctly identifying the independent variable
- 1 mark for correctly identifying the dependent variable
Teaching note: The independent variable is the one the investigator changes or selects; the dependent variable is the one being measured in response. A helpful way to remember: the dependent variable "depends on" the independent variable.
(b) [2 marks]
Answer (any two of the following):
- Soil type / soil texture
- Initial moisture content of the soil
- Slope angle of the surface
- Intensity and duration of rainfall (if using simulated rainfall)
- Volume or depth of water applied
- Temperature
Marking scheme:
- 1 mark for each valid control variable (maximum 2 marks)
Common mistake: Students sometimes identify variables that are actually the independent or dependent variable. Control variables are those kept constant so they do not confound the results.
Question 3 [3 marks]
Answer: A pilot study is a small-scale trial run of the full investigation conducted before the main data collection. It is important because:
- It allows the researcher to test and refine data collection methods and equipment, identifying any practical problems (e.g., a questionnaire question that is ambiguous, or a piece of equipment that is unsuitable for field conditions).
- It helps determine whether the sampling strategy is appropriate and feasible — for example, whether the sample size is sufficient to draw meaningful conclusions, or whether the chosen sites are accessible and safe.
- It provides an opportunity to practise techniques (e.g., using a flow meter or clinometer) so that data collected during the main investigation is accurate and reliable.
Marking scheme:
- 1 mark for defining a pilot study
- 1 mark for each valid reason explained (up to 2 marks)
Question 4 [5 marks]
(a) [3 marks]
Answer (any three of the following):
- Slippery rocks / risk of slipping and falling into the water
- Fast-flowing water / risk of being swept away
- Deep water / risk of drowning
- Unstable river banks / risk of bank collapse
- Adverse weather conditions (e.g., sudden rainfall causing flash floods)
- Exposure to waterborne diseases (e.g., leptospirosis)
- Sharp objects or debris in the water
Marking scheme:
- 1 mark for each valid risk identified (maximum 3 marks)
(b) [2 marks]
Answer (example): Risk: Slippery rocks Mitigation measure: Wear appropriate footwear with good grip (e.g., Wellington boots or hiking boots with non-slip soles), and use a walking stick for additional stability when crossing wet surfaces near the river.
Marking scheme:
- 1 mark for identifying a specific mitigation measure
- 1 mark for explaining how it reduces the risk
Teaching note: Risk mitigation should be specific and practical. Generic answers like "be careful" or "take precautions" without specifying what those precautions are will not gain full credit.
Question 5 [4 marks]
Answer:
Primary data is original data collected firsthand by the investigator specifically for their investigation. It is collected through direct observation, measurement, or interaction in the field.
Example for coastal fieldwork: Measuring the longshore drift rate by timing how long it takes a float to travel a set distance along the beach.
Secondary data is data that has already been collected by someone else for a different purpose but is used by the investigator to support their study.
Example for coastal fieldwork: Using Ordnance Survey maps or Google Earth imagery to identify historical coastline changes at the study site.
Marking scheme:
- Correct definition of primary data (1 mark)
- Relevant coastal example of primary data (1 mark)
- Correct definition of secondary data (1 mark)
- Relevant coastal example of secondary data (1 mark)
Common mistake: Students sometimes confuse the two. A useful distinction: primary data is collected by you; secondary data already exists and was collected by someone else.
Section B: Sampling and Data Collection Methods
Question 6 [3 marks]
Answer: Systematic sampling involves selecting samples at regular intervals (e.g., every 5th building or every 100 metres along a transect). For investigating land use patterns across a town centre, systematic sampling is more appropriate than random sampling because:
- It ensures even spatial coverage across the entire study area, reducing the chance of clustering in one particular zone, which could happen with random sampling.
- It is simpler and quicker to implement in the field — the student can follow a predetermined grid or route and record land use at set intervals.
- It reduces researcher bias in site selection, as the sampling interval is predetermined rather than chosen subjectively.
Marking scheme:
- 1 mark for explaining what systematic sampling is
- 1 mark for explaining why it ensures better spatial coverage
- 1 mark for explaining why it is practical/reduces bias
Question 7 [6 marks]
(a) [2 marks]
Answer:
- Site A total: 12 + 25 + 3 + 30 + 2 = 72 individuals
- Site B total: 38 + 8 + 22 + 15 + 34 = 117 individuals
Marking scheme:
- 1 mark for correct Site A total
- 1 mark for correct Site B total
(b) [4 marks]
Answer: Site B (deep woodland) has a much higher total count of individuals (117) compared to Site A (72). Site B has significantly more shade-tolerant species such as bluebells (38 vs. 12), oak seedlings (22 vs. 3), and dog's mercury (34 vs. 2). In contrast, Site A has more bracken (25 vs. 8) and ivy (30 vs. 15), which are species that tend to thrive in more disturbed or light-rich environments.
Reason: The path at Site A creates a corridor of increased light and disturbance (trampling, soil compaction), favouring light-demanding and disturbance-tolerant species like bracken and ivy, while suppressing shade-loving species. Site B, being deeper in the woodland, has a closed canopy with lower light levels at ground level, favouring shade-tolerant species.
Marking scheme:
- Comparison of total counts (1 mark)
- Comparison of at least two specific species between sites (1 mark)
- Identification of the ecological reason (1 mark)
- Explanation linking the reason to the data (1 mark)
Question 8 [3 marks]
Answer:
- Stand at the base of the slope and identify the point on the cliff face or slope that is at eye level.
- Look through the clinometer (sighting the device towards the target point on the slope at the same height as your eye).
- Read the angle displayed on the clinometer scale — this gives the angle of elevation (or slope angle).
- Record the measurement and repeat at the same location to calculate a mean value for improved accuracy.
Marking scheme:
- 1 mark for correct initial setup/sighting procedure
- 1 mark for reading the angle from the clinometer
- 1 mark for mentioning repetition/reliability
Common mistake: Students often describe using a clinometer to measure from the top of a slope looking down. The standard method involves measuring the angle of elevation from the base.
Question 9 [7 marks]
(a) [3 marks]
Answer: The graph shows a positive correlation (positive relationship) between the percentage of impermeable surface cover and drainage density. As the percentage of impermeable surface cover increases, the drainage density also increases. The relationship appears to be strong and approximately linear, with drainage density rising from approximately 0.8 km/km² at 10% impermeable cover to approximately 4.5 km/km² at 75% impermeable cover.
Marking scheme:
- Identifies positive relationship (1 mark)
- Describes the trend with direction (1 mark)
- References approximate data values from the graph (1 mark)
(b) [2 marks]
Answer: By reading from the line of best fit at 45% on the x-axis, the corresponding drainage density on the y-axis is approximately 2.8 km/km².
Marking scheme:
- Shows working by indicating reading from the graph/line of best fit (1 mark)
- Correct answer in range 2.6–3.0 km/km² (1 mark)
(c) [2 marks]
Answer: At very high levels of impermeable surface cover (over 90%), the relationship may not hold because:
- The catchment may already have reached a maximum drainage density, as there is limited additional space for further channel development.
- At extremely high impermeability, surface runoff may be so rapid and concentrated that it flows overland rather than through defined channels, potentially reducing the measured drainage density.
- Other factors such as storm drain infrastructure (piped systems) may dominate, meaning surface drainage density no longer reflects the impermeable cover in the same way.
Marking scheme:
- 1 mark for each valid explanation (maximum 2 marks)
Question 10 [5 marks]
Answer:
Strengths:
- Questionnaires can gather data from a large number of respondents relatively quickly and cost-effectively, providing a broad overview of residents' perceptions across the study area.
- Standardised questions allow for easy comparison and quantitative analysis of responses (e.g., using Likert scales to measure perceived flood risk on a scale of 1–5).
- They can capture subjective data (perceptions, opinions, lived experiences) that cannot be obtained through physical measurements alone.
Limitations:
- Response rates may be low, particularly in hard-to-reach populations, leading to sampling bias if only certain groups respond.
- Questions may be misunderstood or interpreted differently by respondents, reducing the reliability of the data. Leading questions can also introduce bias.
- Respondents may give socially desirable answers rather than their true perceptions (e.g., downplaying their concern about flood risk).
- Questionnaires alone may lack depth — they may not capture the full complexity of residents' experiences and reasoning behind their perceptions.
Marking scheme:
- 1 mark for each valid point (strength or limitation), maximum 4 marks
- 1 mark for balanced evaluation (must include both strengths and limitations for full marks)
Section C: Data Presentation and Analysis
Question 11 [2 marks]
Answer (any two of the following):
- Choropleth maps effectively show spatial patterns and variations in data across different areas/zones, making it easy to identify geographical trends.
- They use shading or colour gradients that allow the viewer to quickly distinguish between areas of high and low values.
- They are useful for comparing data between predefined spatial units (e.g., wards, districts, or grid squares).
Marking scheme:
- 1 mark for each valid advantage (maximum 2 marks)
Question 12 [5 marks]
(a) [2 marks]
Answer: A scatter graph with a line of best fit would be the most appropriate technique. This is because both variables are continuous (distance and sediment size), and the student wants to show the relationship/correlation between them. A scatter graph allows the viewer to see whether there is a positive or negative correlation and to identify any anomalies.
Marking scheme:
- Correct identification of scatter graph (1 mark)
- Valid justification referencing continuous data and relationship (1 mark)
(b) [3 marks]
Answer: Both mean sediment size and beach angle increase with distance from the waterline. Sediment size increases from 0.3 mm at the waterline to 3.5 mm at 40 m, showing a clear positive relationship. Similarly, the beach angle increases from 2° at the waterline to 15° at 40 m from the waterline. This pattern is consistent with the process of wave swash and backwash — larger, heavier sediment is carried further up the beach by swash, while finer material is deposited closer to the waterline. The increasing beach angle reflects the coarser sediment building up the upper beach profile.
Marking scheme:
- Description of sediment size trend with data reference (1 mark)
- Description of beach angle trend with data reference (1 mark)
- Explanation linking the pattern to coastal processes (1 mark)
Question 13 [3 marks]
Answer: Standard deviation measures the spread or dispersion of data values around the mean. The student would first calculate the mean soil moisture content from the 20 measurements. Then, the standard deviation would indicate how much variation exists in soil moisture across the farmland.
- A low standard deviation would indicate that soil moisture values are clustered closely around the mean, suggesting relatively uniform soil moisture conditions across the farmland.
- A high standard deviation would indicate that soil moisture values are widely spread, suggesting significant spatial variability — some areas are much wetter or drier than others.
This would help the student understand whether soil moisture is consistent or variable, which could inform further investigation into the causes of any variability (e.g., differences in drainage, vegetation cover, or soil type).
Marking scheme:
- Explanation of what standard deviation measures (1 mark)
- Interpretation of low standard deviation (1 mark)
- Interpretation of high standard deviation (1 mark)
Question 14 [6 marks]
(a) [2 marks]
Answer: The value of rs=+0.89 indicates a strong positive correlation between distance from the city centre and pedestrian flow rate. This means that as distance from the city centre increases, pedestrian flow rate also tends to increase. However, this result may seem counterintuitive — typically, pedestrian flow decreases away from the CBD. The student should check whether the data was recorded correctly or whether the variable was defined differently (e.g., distance from the outskirts inward).
Marking scheme:
- Identifies strong positive correlation (1 mark)
- Correct interpretation of what this means for the variables (1 mark)
(b) [2 marks]
Answer: Yes, the correlation is statistically significant at the 0.05 significance level. The calculated value of rs=+0.89 is greater than the critical value of 0.648. This means there is less than a 5% probability that this correlation occurred by chance, and we can reject the null hypothesis (that there is no correlation in the population).
Marking scheme:
- States that the correlation is significant (1 mark)
- Correct reasoning comparing calculated value to critical value (1 mark)
(c) [2 marks]
Answer: A strong correlation only shows that two variables are associated — it does not prove that one causes the other. There may be:
- A third (confounding) variable that influences both variables simultaneously. For example, both distance from the city centre and pedestrian flow rate might be influenced by the presence of a major transport hub or shopping centre.
- Coincidental correlation — even statistically significant correlations can occur by chance in small samples, or the relationship may not be meaningful in a real-world context.
Marking scheme:
- 1 mark for explaining that correlation ≠ causation
- 1 mark for identifying a confounding variable or coincidental explanation
Question 15 [8 marks]
(a) [4 marks]
Answer: The AQI values show a clear spatial pattern across Millford City. The highest AQI values (98–110, in the "Unhealthy for Sensitive Groups" category) are concentrated in the industrial zone in the northeast of the city, with values of 105 and 110 at two stations. The CBD also has relatively high AQI values (78–92, in the "Moderate" category). In contrast, the residential areas to the south and west have the lowest AQI values (45–60, mostly in the "Good" to lower "Moderate" range). There is therefore a general pattern of decreasing AQI (improving air quality) from the industrial northeast and CBD towards the residential outskirts.
Marking scheme:
- Identifies highest AQI in industrial zone with data reference (1 mark)
- Identifies moderate AQI in CBD with data reference (1 mark)
- Identifies lowest AQI in residential areas with data reference (1 mark)
- Describes the overall spatial pattern/trend (1 mark)
(b) [4 marks]
Answer (any two of the following, 2 marks each):
-
Industrial emissions: The industrial zone in the northeast is likely a major source of air pollutants such as particulate matter (PM₂.₅ and PM₁₀), sulfur dioxide (SO₂), and nitrogen oxides (NOₓ) from factories and manufacturing processes, leading to the highest AQI values in this area.
-
Traffic emissions in the CBD: The CBD has high volumes of vehicular traffic, which emits pollutants such as nitrogen dioxide (NO₂), carbon monoxide (CO), and particulate matter from vehicle exhausts, contributing to the elevated AQI values in the city centre.
-
Dispersion and wind patterns: Pollutants from the industrial zone and CBD may be dispersed by prevailing winds, but the concentration of emission sources means that local AQI remains highest near the sources. The residential areas, being further from major emission sources and potentially having more green spaces, experience better air quality.
Marking scheme:
- 2 marks per reason: 1 mark for identifying the reason, 1 mark for explaining how it affects AQI
Section D: Conclusions, Evaluation, and Limitations
Question 16 [2 marks]
Answer (any two of the following):
- Quantitative measurements of wave energy at different points along the coast (e.g., using a dynamometer or wave height × wave frequency data)
- Measurements of erosion rates at the same locations (e.g., using erosion pins, repeated beach profiles, or analysis of historical map/aerial photograph evidence)
- Data showing a positive correlation between wave energy measurements and erosion rate measurements across multiple sites
Marking scheme:
- 1 mark for each valid piece of evidence (maximum 2 marks)
Question 17 [5 marks]
(a) [2 marks]
Answer: There is a strong positive relationship between distance from the footpath edge and vegetation cover. Vegetation cover increases from only 15% at the footpath edge (0 m) to 85% at 5 m from the footpath edge. The rate of increase is greatest in the first 2 metres (from 15% to 55%), after which the rate of increase slows, approaching an asymptote.
Marking scheme:
- Describes the positive relationship (1 mark)
- References specific data values from the table (1 mark)
(b) [3 marks]
Answer: The soil compaction data supports the conclusion because it shows that soil compaction is highest nearest the footpath (3.8 kg/cm² at 0 m) and decreases with distance (to 1.4 kg/cm² at 5 m). This mirrors the inverse pattern to vegetation cover. The high soil compaction near the footpath is caused by repeated trampling from pedestrians, which compresses the soil particles, reduces pore space, and makes it harder for plant roots to penetrate and access water and nutrients. This explains why vegetation cover is lowest where soil compaction is highest. As distance from the footpath increases, trampling decreases, soil compaction reduces, and conditions become more favourable for plant growth.
Marking scheme:
- Describes the soil compaction trend (1 mark)
- Explains the link between trampling and soil compaction (1 mark)
- Explains how soil compaction affects vegetation (1 mark)
Question 18 [5 marks]
Answer:
Using only quantitative data in a quality of life (QoL) investigation has several limitations:
-
QoL is inherently subjective: Quantitative indicators such as crime rates, income levels, or housing density provide objective measurements, but they do not capture how residents actually feel about their neighbourhood. Two areas with identical crime statistics may have very different perceptions of safety.
-
Reductionism: Reducing QoL to numerical data oversimplifies complex human experiences. Factors such as community cohesion, sense of belonging, aesthetic quality of the environment, and mental wellbeing are difficult to quantify meaningfully.
-
Lack of depth and context: Quantitative data may reveal what the conditions are but not why residents feel the way they do. For example, a neighbourhood might score highly on quantitative indicators but residents may still report low satisfaction due to historical or cultural factors.
-
Potential for misleading indicators: Quantitative data can be misleading if the indicators chosen do not accurately reflect QoL. For instance, average income might mask significant inequality within a neighbourhood.
-
Improving the investigation: The student should supplement quantitative data with qualitative methods such as semi-structured interviews, open-ended questionnaire responses, or participant observation to capture the lived experiences and perceptions of residents.
Marking scheme:
- 1 mark for each valid limitation, maximum 4 marks
- 1 mark for suggesting how to improve the investigation (qualitative methods)
Question 19 [7 marks]
(a) [3 marks]
Answer: The result of rs=−0.32 indicates a weak negative correlation between building height and wind speed at street level. This means there is a slight tendency for wind speed to decrease as building height increases, which is in the direction predicted by the hypothesis. However, the correlation is weak, meaning the relationship is not strong or consistent across the data set. Furthermore, since the result is not statistically significant at the 0.05 level, the student cannot reject the null hypothesis — the observed correlation could have occurred by chance, and there is insufficient evidence to support the hypothesis.
Marking scheme:
- Identifies weak negative correlation (1 mark)
- States direction is consistent with hypothesis (1 mark)
- States result is not statistically significant / cannot reject null hypothesis (1 mark)
(b) [4 marks]
Answer (any two improvements, 2 marks each):
-
Increase the sample size: The student should collect data from more locations (e.g., 20–30 sites instead of a smaller number). A larger sample size increases the statistical power of the test, making it more likely to detect a genuine correlation if one exists.
-
Control for confounding variables: Wind speed at street level is affected by many factors other than building height, such as street orientation relative to prevailing wind direction, the presence of other buildings creating canyon effects, and vegetation. The student should either control these variables (e.g., only measuring on streets with the same orientation) or record them for inclusion in the analysis.
-
Use more precise measurement equipment: The student should ensure that wind speed is measured using an anemometer at a consistent height (e.g., 1.5 m above ground) and at the same time of day to reduce variability caused by temporal changes in weather conditions.
-
Repeat measurements: Taking multiple readings at each site and calculating a mean would improve the reliability of the data and reduce the impact of anomalous readings.
Marking scheme:
- 2 marks per improvement: 1 mark for identifying the improvement, 1 mark for explaining how it improves reliability
Question 20 [8 marks]
Answer:
Fieldwork is widely regarded as an essential component of geographical education and research, though its necessity can be debated to some extent.
Arguments that fieldwork is essential:
-
Direct observation of geographical processes: Fieldwork allows students to observe and measure geographical processes firsthand, deepening their understanding beyond textbook knowledge. For example, measuring longshore drift using a float and stopwatch on a beach provides tangible experience of coastal processes that diagrams and descriptions alone cannot replicate.
-
Development of practical skills: Fieldwork develops transferable skills such as data collection techniques (e.g., using quadrats for vegetation surveys, flow meters for river discharge), equipment handling, and risk assessment. These skills are fundamental to geographical practice.
-
Testing hypotheses in real-world contexts: Fieldwork enables students to test theoretical concepts against real-world data. For instance, investigating whether Burgess's concentric zone model applies to a local area through land use surveys challenges students to critically evaluate models.
-
Understanding spatial variability: Fieldwork reveals the complexity and variability of geographical phenomena across space. Measuring infiltration rates at different locations in a catchment, for example, demonstrates how soil type, vegetation, and slope interact to produce varying results.
Arguments that fieldwork may not always be essential:
-
Technological alternatives: Advances in remote sensing, GIS, and virtual fieldwork (e.g., Google Earth, drone imagery) allow students to investigate geographical patterns and processes without physically visiting sites. These tools can provide data at scales and resolutions that fieldwork alone cannot achieve.
-
Time and resource constraints: Fieldwork is time-consuming, expensive, and logistically challenging. Some geographical investigations (e.g., studying global climate patterns or international migration) cannot feasibly be conducted through fieldwork at the local scale.
-
Secondary data sufficiency: For some investigations, existing secondary data (e.g., census data, meteorological records, satellite imagery) may be sufficient to answer the research question without the need for primary fieldwork data collection.
Conclusion: While fieldwork is not the only way to develop geographical understanding, it remains an essential component because it provides irreplaceable hands-on experience of geographical processes, develops practical skills, and fosters critical thinking through real-world application. However, it is most effective when combined with secondary data analysis and technological tools, rather than being relied upon exclusively.
Marking scheme (Level Marked):
| Level | Marks | Descriptors |
|---|---|---|
| Level 3 | 7–8 | Comprehensive discussion with detailed reference to specific fieldwork examples. Balanced evaluation of the extent to which fieldwork is essential. Well-structured with clear conclusion. Uses geographical terminology accurately. |
| Level 2 | 4–6 | Some discussion of the value of fieldwork with at least one specific example. Attempts evaluation but may be unbalanced. Some geographical terminology used. |
| Level 1 | 1–3 | Limited or generic discussion with few or no specific examples. Little or no evaluation. Basic use of geographical terminology. |
End of Answer Key
Free quiz and exam paper access
Enter your details to view this paper
Your access is remembered on this device.