From Real Exams Quiz
A Level H2 Geography Fieldwork Quiz
Free A Level H2 Geography Fieldwork quiz, HY3 Exam version, with questions, answers, and A Level-style practice for Singapore students.
These static practice materials are generated from the site's syllabus and paper-generation workflow, with source and model context shown so students and parents can evaluate the material before use.
Questions
A-Level Geography H2 Quiz - Fieldwork
Name: ______________________
Class: ______________________
Date: ______________________
Score: ______________________
Duration: 60 minutes
Total Marks: 40
Topic: Fieldwork (Cluster 4, Syllabus 9173)
Instructions:
- Answer all 20 questions.
- Section A: Short structured questions (1–8).
- Section B: Data- and source-based questions (9–14).
- Section C: Extended response and evaluation (15–20).
- Use geographical terminology and support answers with reasoning.
- Write answers in the spaces provided.
Section A: Fieldwork Foundations (Questions 1–8)
1. State one primary purpose of conducting fieldwork in H2 Geography. [1]
2. Identify one method of primary data collection used in a drainage basin fieldwork study. [1]
3. Explain one ethical consideration when conducting fieldwork in a residential neighbourhood. [2]
4. A student measures river width using a tape measure at three sites. Give one advantage and one limitation of this method. [2]
Advantage: ________________________________________________
Limitation: ________________________________________________
5. State the term for data that is collected by the researcher directly during fieldwork. [1]
6. Explain how you would minimise the impact of your investigation at a tropical forest site and a urban canal site differently. [4]
Forest: ___________________________________________________
Urban canal: _______________________________________________
7. Name the mapping technique that uses a grid overlay to record land use and state one strength and one limitation. [3]
Technique: ________________________________________________
Strength: __________________________________________________
Limitation: ________________________________________________
8. Calculate the mean pH value from the following fieldwork readings at a stream: 6.2, 6.8, 7.1, 6.5, 7.0. Show your working. [2]
Working: __________________________________________________
Mean: ________
Section B: Data and Source Interpretation (Questions 9–14)
9. The table below shows vegetation quadrat data from a fieldwork site.
| Layer | Mean Height (m) | Mean Biomass (t/ha) |
|---|---|---|
| Emergent | 35 | 40 |
| Canopy | 22 | 120 |
| Understory | 8 | 25 |
| Ground | 1 | 5 |
Describe the vegetation structure and mean biomass of this forest as shown. [3]
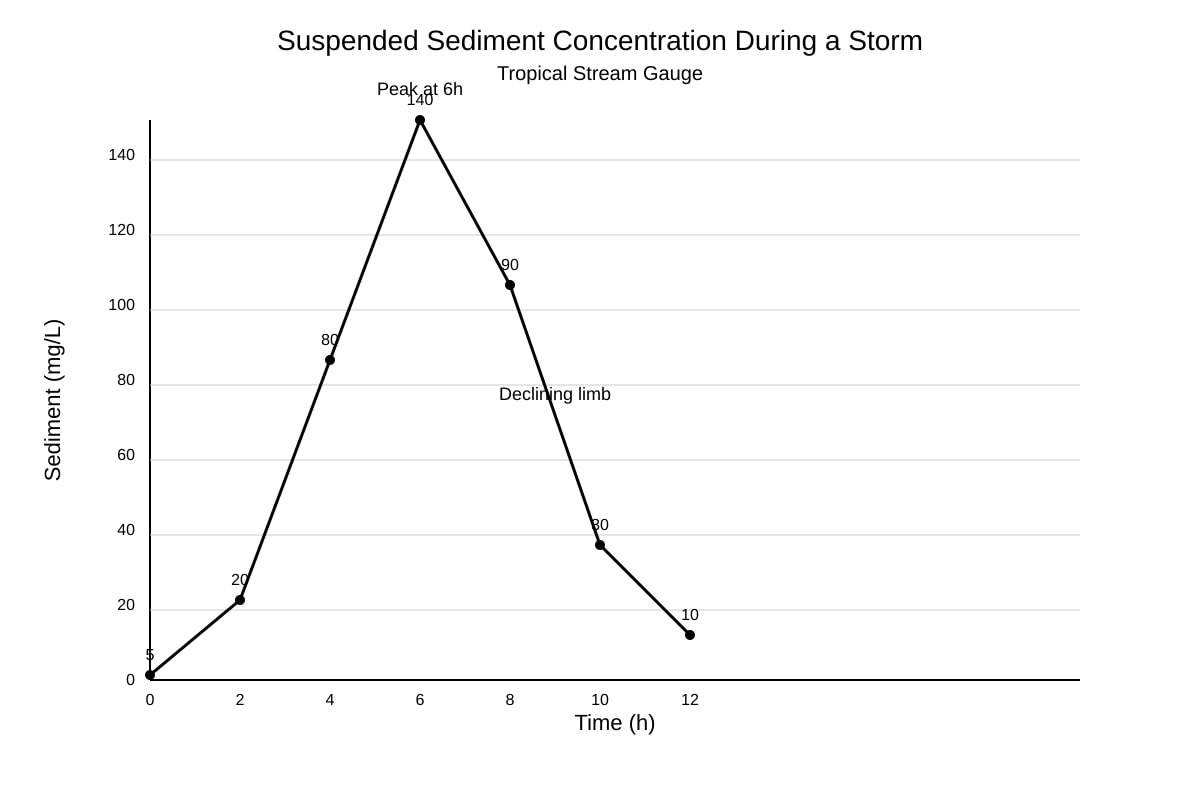
10.
Image pending generation: graph for Q10.
Using Resource Q10-fig1, describe the pattern of suspended sediment concentration during the storm event. [3]
11. Using the same graph (Q10-fig1), explain one physical process that could account for the peak at 6 hours. [2]
12. A fieldwork group used a questionnaire to assess residents' perception of flood risk. State two measures to improve the reliability of their qualitative data. [2]
13. Compare the scores for the 4 survey sites shown in the table below on environmental quality (max 10).
| Site | Cleanliness | Green Space | Noise |
|---|---|---|---|
| A | 7 | 6 | 5 |
| B | 4 | 3 | 8 |
| C | 9 | 8 | 4 |
| D | 5 | 5 | 6 |
Compare the environmental quality scores for the 4 sites. [5]
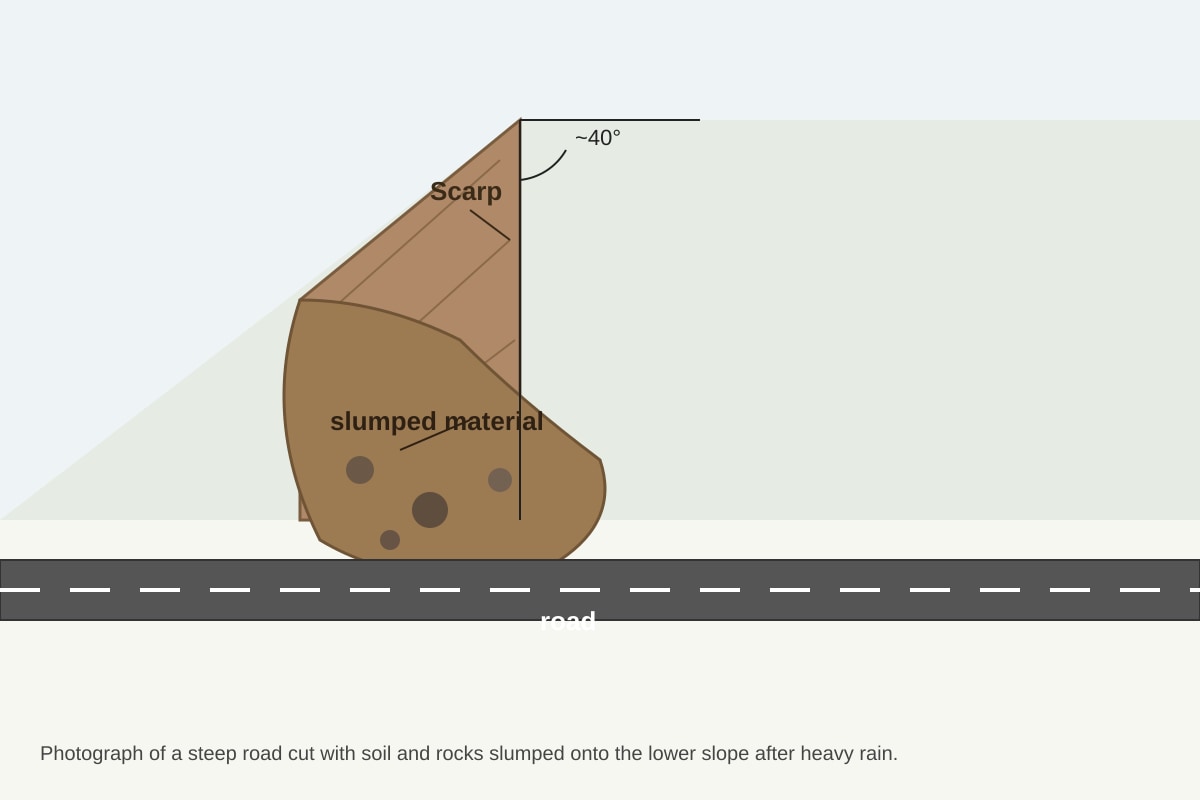
14. Identify the type of mass movement hazard shown in the photograph extract below and state one fieldwork precaution.
Image pending generation: source_image for Q14.
Hazard: ________ [1]
Precaution: ________________________ [1]
Section C: Extended Response and Evaluation (Questions 15–20)
15. Explain how you would design a fieldwork investigation to assess the impact of urbanisation on channel morphology of a river. Include sampling strategy. [6]
16. Discuss the strengths and limitations of using GIS in fieldwork data presentation. [4]
17. To what extent can school fieldwork fully represent real-world geographical processes? [8]
18. A student recorded temperature at 2 m and 10 m above ground at a coastal site: 2 m = 29.5°C, 10 m = 28.0°C. Calculate the environmental lapse rate (°C per 100 m) and interpret. [3]
Working: __________________________________________________
Rate: ________
Interpretation: ____________________________________________
19. Evaluate the use of semi-structured interviews versus questionnaires in fieldwork on community resilience to floods. [5]
20. Assess the importance of a risk assessment before geographical fieldwork in tropical environments. [5]
Answers
A-Level Geography H2 Quiz - Fieldwork: Answer Key
Total Marks: 40
Topic: Fieldwork (Cluster 4, Syllabus 9173)
Section A Answers (Q1–8)
Q1 [1 mark]
Answer: To collect primary data / test hypotheses in real-world settings / develop geographical skills.
Teaching note: Fieldwork bridges theory and observation; any one valid purpose accepted.
Q2 [1 mark]
Answer: Stream gauging / quadrat sampling / transect walk / tape measure width.
Teaching note: Primary methods are researcher-directed; not secondary sources.
Q3 [2 marks]
Answer: (1) Informed consent from residents; (2) anonymise responses.
Marking: 1 mark per valid ethical point.
Teaching note: Ethics protect participants and data integrity.
Q4 [2 marks]
Advantage: Direct, cheap, simple. Limitation: Limited to accessible points, operator error.
Marking: 1m each.
Q5 [1 mark]
Answer: Primary data.
Q6 [4 marks]
Forest: Avoid trampling, stay on paths, no sample removal.
Urban canal: Avoid contamination, safe edge, permission for access.
Marking: 2m each site, differ meaningfully.
Q7 [3 marks]
Technique: Grid mapping / stratified sampling grid.
Strength: Systematic, comparable. Limitation: Ignores variation within cell.
Marking: 1+1+1.
Q8 [2 marks]
Working: (6.2+6.8+7.1+6.5+7.0)/5 = 33.6/5 = 6.72
Mean: 6.72
Marking: 1m working, 1m answer.
Section B Answers (Q9–14)
Q9 [3 marks]
Answer: Four layers; emergent 35m/40t, canopy 22m/120t, understory 8m/25t, ground 1m/5t; total 190 t/ha.
Marking: Structure 1m, biomass values 1m, synthesis 1m.
Q10 [3 marks]
Answer: Rises from 5 to peak 140 at 6h, then falls to 10 by 12h; lagged response.
Marking: Rise 1m, peak 1m, fall 1m.
Q11 [2 marks]
Answer: Increased overland flow after saturation mobilises sediment.
Marking: Process + link to graph.
Q12 [2 marks]
Answer: Pilot test, larger sample, standardised questions.
Marking: 1m each.
Q13 [5 marks]
Answer: C highest (21), A (18), D (16), B lowest (15). C strong green/clean; B noisy.
Marking: Compare across all 4 with numbers, 1m each dimension referenced.
Q14 [2 marks]
Hazard: Slump / translational slide. Precaution: Keep distance, helmet.
Marking: 1+1.
Section C Answers (Q15–20)
Q15 [6 marks]
Answer: Stratified sites upstream/downstream; measure width, depth, velocity; repeat 3x; use GPS.
Marking: Design 2m, sampling 2m, variables 2m.
Q16 [4 marks]
Strengths: Visual, layered. Limits: Skill needed, data errors.
Marking: 2+2.
Q17 [8 marks]
L1 (1–2): Simple, partial. L2 (3–5): Some representation, limits noted. L3 (6–8): Synthesises scale, time, control; balanced judgement.
Content: School scope vs real complexity; use of proxies; cannot replicate climate events.
Q18 [3 marks]
Working: (29.5-28.0)/8m *100 = 18.75°C/100m (inversion).
Rate: 18.75°C/100m. Interpretation: Temperature increases with height (inversion).
Marking: 1+1+1.
Q19 [5 marks]
Interviews: Depth, flexible. Questionnaires: Scale, comparable. Evaluate trade-off.
Marking: 2+2+1 conclusion.
Q20 [5 marks]
Assess: Tropical hazards (storm, disease); legal, safety, contingency.
Marking: Points 3m, evaluation 2m.
Free quiz and exam paper access
Enter your details to view this paper
Your access is remembered on this device.