AI Generated Exam Paper
A Level H2 Geography Practice Paper 5
Free A Level H2 Geography Practice Paper 5, LongCat AI version, with questions, answers, and A Level-style practice for Singapore students.
These static practice materials are generated from the site's syllabus and paper-generation workflow, with source and model context shown so students and parents can evaluate the material before use.
Questions
TuitionGoWhere Practice Paper - Geography H2 A-Level
TuitionGoWhere Practice Paper (AI)
Subject: Geography (H2) Level: A-Level Paper: Practice Paper — Resources & Sustainability Version: 5 of 5 Duration: 1 hour 30 minutes Total Marks: 60
Name: ___________________________ Class: ___________________________ Date: ___________________________
Instructions
- Answer all questions in Section A and Section B.
- Read each question carefully and respond using appropriate geographical terminology.
- Where data resources are provided, refer to them explicitly in your answers.
- For evaluative questions, present a balanced argument before reaching a conclusion.
- Quality of written communication will be assessed in extended response questions.
- The number of marks for each question or part-question is shown in brackets [ ].
Section A: Data-Based Questions (30 marks)
Answer all questions in this section. Refer to the resources provided.
Resource 1: Table showing water stress indicators for six countries (2020–2024).
| Country | Freshwater withdrawal (% of total renewable water) | Population without safe sanitation (%) | Per capita water availability (m³/year) | Water Stress Level |
|---|---|---|---|---|
| Singapore | 45 | 0 | 110 | Extremely High |
| Egypt | 97 | 5 | 570 | Extremely High |
| Brazil | 1 | 12 | 27,270 | Low |
| India | 57 | 36 | 1,486 | High |
| Netherlands | 12 | 0 | 5,430 | Medium |
| Kenya | 22 | 43 | 510 | High |
Resource 2: Extract from a UN Water Report (2024).
"By 2025, an estimated 1.8 billion people will live in regions experiencing absolute water scarcity. Rapid urbanisation, agricultural intensification, and climate variability are compounding pressures on freshwater systems. In Sub-Saharan Africa, over 40% of the population lacks access to basic drinking water services. Meanwhile, industrialised nations face challenges of ageing infrastructure and pollution of existing water bodies. Integrated Water Resource Management (IWRM) has been promoted as a holistic framework, yet adoption remains uneven across governance contexts."
Resource 3: Graph showing global trends in desalination capacity (2000–2024).
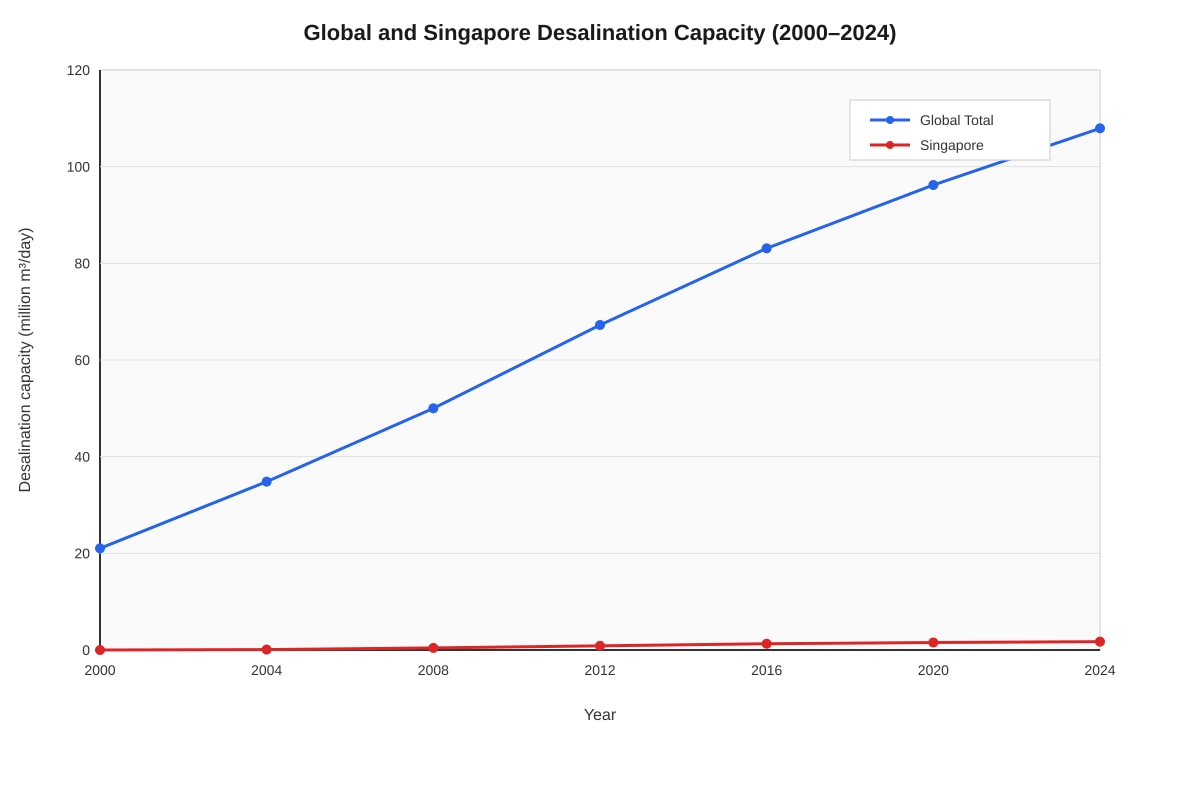
Generated graph for Q1.
Question 1
(a) Using Resource 1, compare the water stress situations of Singapore and Egypt. [4]
(b) Suggest two reasons why Singapore has an "Extremely High" water stress level despite having a relatively low freshwater withdrawal percentage. [4]
(c) Using Resource 2 and your own knowledge, explain how both physical and human factors contribute to water scarcity in Sub-Saharan Africa. [6]
Question 2
(a) Describe the trend in global desalination capacity shown in Resource 3. [3]
(b) Assess the extent to which desalination is a sustainable solution to water scarcity for countries like Singapore. [8]
(c) Using Resources 1 and 2 and your own knowledge, evaluate the effectiveness of Integrated Water Resource Management (IWRM) as a strategy for achieving water sustainability. [5]
Section B: Structured and Extended Response Questions (30 marks)
Answer all questions in this section.
Question 3
(a) Define the term energy mix and explain why it is important for resource sustainability. [4]
(b) Explain three factors that influence a country's choice of energy mix. [6]
(c) "Renewable energy alone can solve the global energy crisis." How far do you agree with this statement? Justify your answer with reference to specific examples. [10]
Question 4
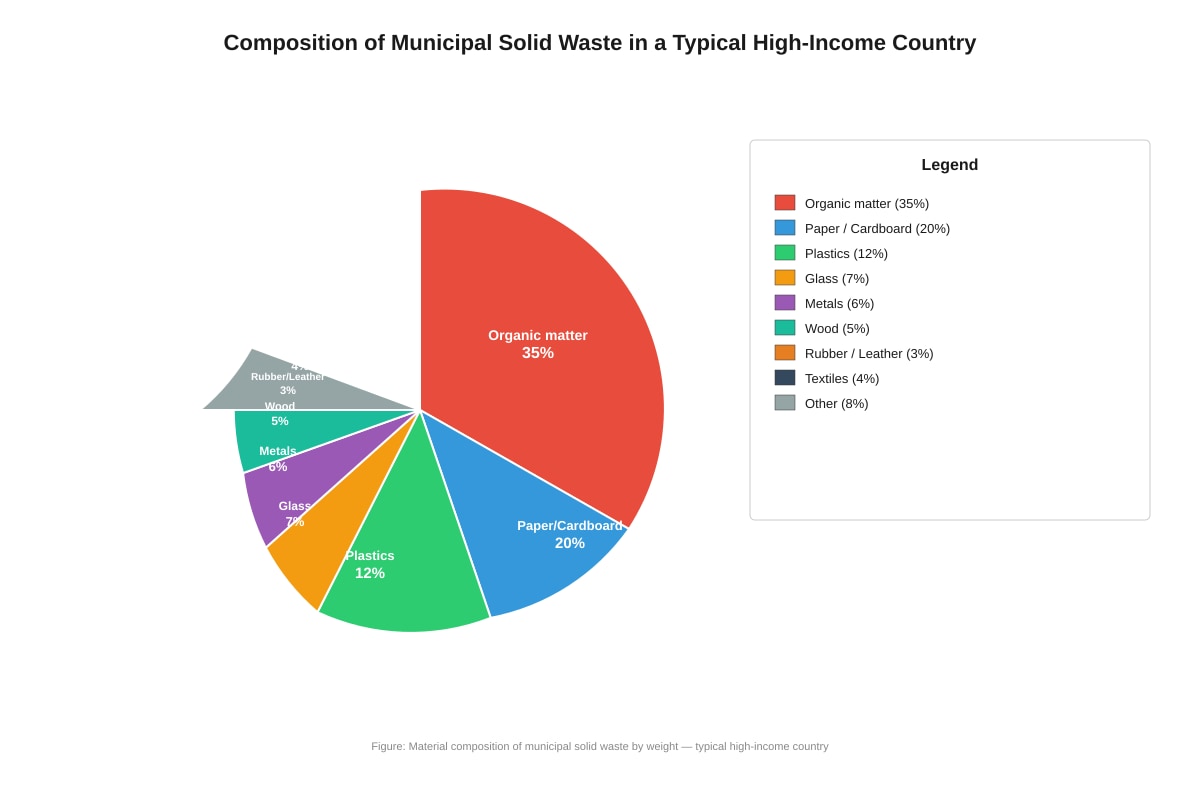
Generated chart for Q4.
(a) Using the pie chart above, identify the two largest components of municipal solid waste and suggest why organic matter constitutes the largest proportion. [3]
(b) Explain how the waste hierarchy (reduce, reuse, recycle, recover, dispose) can contribute to resource sustainability. Refer to specific waste components from the chart in your answer. [7]
(c) Evaluate the role of government policy in promoting a circular economy for resources. Use examples from at least two different countries in your response. [10]
Answers
TuitionGoWhere Practice Paper — Geography H2 A-Level
Answer Key & Marking Scheme
Subject: Geography (H2) | Paper: Practice Paper — Resources & Sustainability | Version: 5 of 5 Total Marks: 60
Section A: Data-Based Questions (30 marks)
Question 1 (14 marks total)
Q1(a) Compare the water stress situations of Singapore and Egypt. [4]
Marking Scheme:
| Marks | Descriptor |
|---|---|
| 1–2 | Basic comparison with limited reference to the data; may only describe one country or use no comparative language. |
| 3–4 | Clear comparison using data from Resource 1 with appropriate comparative language; addresses multiple indicators for both countries. |
Model Answer:
Both Singapore and Egypt are classified as having "Extremely High" water stress levels, but the underlying causes differ significantly.
Egypt has a far higher freshwater withdrawal rate at 97% of total renewable water compared to Singapore's 45%, indicating that Egypt is using nearly all of its available renewable water resources. Egypt also has a much higher per capita water availability (570 m³/year) compared to Singapore's very low 110 m³/year, suggesting that Singapore's scarcity is driven by its extremely limited natural water endowment rather than over-extraction.
However, Singapore has 0% of its population without safe sanitation, whereas 5% of Egypt's population lacks this access, indicating that Singapore's water infrastructure and governance are more effective at delivering safe water to its population despite its natural scarcity.
Common Mistakes:
- Simply restating the numbers without using comparative language ("higher than," "in contrast," "whereas").
- Failing to note that both countries share the same stress classification despite very different underlying conditions.
Q1(b) Suggest two reasons why Singapore has an "Extremely High" water stress level despite having a relatively low freshwater withdrawal percentage. [4]
Marking Scheme: 2 marks per valid reason (well-explained).
Model Answer:
Reason 1: Extremely limited natural water catchment and storage capacity. Singapore is a small island city-state with a land area of only approximately 730 km², which severely limits the amount of natural freshwater that can be collected and stored. Its per capita water availability of just 110 m³/year is among the lowest in the world, meaning that even moderate withdrawal rates represent a high proportion of a very small total resource base.
Reason 2: High population density and demand pressure. Singapore has a population of approximately 5.9 million people concentrated in a very small area, creating intense demand for water for domestic, industrial, and commercial use. The high population density means that per capita renewable water availability is extremely low, pushing the stress classification to "Extremely High" even though the withdrawal rate as a percentage of renewable supply is moderate.
Alternative valid reasons:
- Lack of natural aquifers or significant groundwater resources.
- Dependence on imported water from Malaysia, creating vulnerability.
- Climate variability and the threat of droughts reducing already limited supply.
Q1(c) Using Resource 2 and your own knowledge, explain how both physical and human factors contribute to water scarcity in Sub-Saharan Africa. [6]
Marking Scheme:
| Marks | Descriptor |
|---|---|
| 1–2 | Identifies one or two factors with limited explanation; may address only physical OR human factors. |
| 3–4 | Explains a range of physical and human factors with some development; reference to Resource 2 is present but may be superficial. |
| 5–6 | Well-developed explanation of both physical and human factors with clear causal chains; effectively integrates Resource 2 evidence with own knowledge. |
Model Answer:
Physical factors:
Sub-Saharan Africa experiences significant climate variability, including prolonged droughts and erratic rainfall patterns, which reduce the reliability of surface water resources. Resource 2 notes that "climate variability" is compounding pressures on freshwater systems. Many regions have highly seasonal rivers that dry up during extended dry seasons, leaving communities without reliable water sources. Additionally, high evapotranspiration rates in tropical and semi-arid zones mean that a large proportion of rainfall is lost to the atmosphere before it can be stored or used.
Human factors:
Rapid urbanisation (mentioned in Resource 2) has led to the growth of informal settlements and slums that lack adequate water infrastructure. Cities like Lagos and Nairobi have populations that have grown faster than the capacity of water supply systems to serve them. Resource 2 states that "over 40% of the population lacks access to basic drinking water services," highlighting the infrastructure deficit.
Agricultural intensification (also cited in Resource 2) places enormous demand on water resources, as irrigation accounts for the majority of freshwater withdrawals in many Sub-Saharan African countries. Poor irrigation efficiency leads to significant water wastage.
Governance and economic challenges also play a role: limited financial investment in water infrastructure, political instability, and corruption can prevent the development and maintenance of water supply systems, perpetuating scarcity even where physical water resources may be available.
Question 2 (16 marks total)
Q2(a) Describe the trend in global desalination capacity shown in Resource 3. [3]
Marking Scheme:
| Marks | Descriptor |
|---|---|
| 1 | Identifies a general trend (e.g., "it increased") with little or no data reference. |
| 2 | Describes the trend with some data support; may note the rate of change. |
| 3 | Accurately describes the trend with precise data references; notes the accelerating or steady nature of growth. |
Model Answer:
Global desalination capacity has shown a consistent and rapid upward trend between 2000 and 2024. Capacity increased from approximately 22 million m³/day in 2000 to 115 million m³/day in 2024, representing more than a fivefold increase over the 24-year period. The growth appears to be roughly linear and sustained, with no significant periods of decline, indicating a continuous global investment in desalination technology as a response to growing water scarcity.
Q2(b) Assess the extent to which desalination is a sustainable solution to water scarcity for countries like Singapore. [8]
Marking Scheme:
| Marks | Descriptor |
|---|---|
| 1–3 | Describes desalination with limited assessment of sustainability; one-sided argument; limited or no example. |
| 4–6 | Balanced assessment with some evaluation of sustainability dimensions (environmental, economic, social); reference to Singapore or similar contexts. |
| 7–8 | Well-balanced and thorough assessment; clearly evaluates multiple dimensions of sustainability with specific evidence; reaches a substantiated conclusion. |
Model Answer:
Desalination offers a technologically viable solution to water scarcity for water-stressed nations like Singapore, but its sustainability is constrained by significant environmental and economic costs.
Arguments that desalination IS sustainable (to some extent):
- Desalination provides a climate-independent water source, reducing reliance on rainfall and imported water. For Singapore, which imports up to 40% of its water from Malaysia, desalination enhances water security and self-sufficiency. Resource 3 shows Singapore's desalination capacity has grown from 0 to 2.0 million m³/day, reflecting its strategic importance.
- Singapore's desalination plants (e.g., the Tuas and Keppel Marina East plants) use reverse osmosis technology, which has become more energy-efficient over time, reducing the per-unit cost and carbon footprint.
- Desalination can be scaled to meet growing demand, making it suitable for densely populated urban areas with limited natural water resources.
Arguments that desalination is NOT fully sustainable:
- Desalination is energy-intensive, requiring approximately 3–4 kWh of energy per cubic metre of freshwater produced. If the energy comes from fossil fuels, this contributes to carbon emissions and climate change, which in turn exacerbates water scarcity — creating a feedback loop.
- The brine discharge (highly concentrated salt water) from desalination plants can damage marine ecosystems if not properly managed, affecting biodiversity in coastal waters.
- The high capital and operational costs of desalination plants make them less accessible for lower-income countries, limiting their applicability as a global solution.
- Desalination addresses the symptom (water shortage) rather than the cause (overconsumption, poor water management), and may reduce incentives for demand management and conservation.
Conclusion: Desalination is a necessary but insufficient component of Singapore's water sustainability strategy. It works best when combined with other measures such as water recycling (NEWater), demand management, and catchment management — as reflected in Singapore's "Four National Taps" approach. Its sustainability depends heavily on the energy source used and the environmental management of waste products.
Q2(c) Using Resources 1 and 2 and your own knowledge, evaluate the effectiveness of Integrated Water Resource Management (IWRM) as a strategy for achieving water sustainability. [5]
Marking Scheme:
| Marks | Descriptor |
|---|---|
| 1–2 | Basic description of IWRM with limited evaluation; may not use the resources effectively. |
| 3–4 | Evaluates IWRM with reference to Resources 1 and 2; identifies strengths and limitations with some development. |
| 5 | Thorough evaluation integrating both resources and own knowledge; balanced argument with a clear, substantiated judgement. |
Model Answer:
IWRM is a holistic framework that promotes the coordinated development and management of water, land, and related resources to maximise economic and social welfare without compromising environmental sustainability (as described in Resource 2).
Strengths of IWRM:
- IWRM addresses the multi-dimensional nature of water scarcity. Resource 1 shows that water stress arises from different combinations of factors (e.g., Singapore's natural scarcity vs. Egypt's over-extraction vs. Kenya's infrastructure deficit). IWRM's integrated approach allows tailored solutions for each context rather than a one-size-fits-all approach.
- It encourages stakeholder participation across sectors (agriculture, industry, domestic, environment), which can lead to more equitable and sustainable water allocation.
- Countries like the Netherlands (Resource 1: "Medium" stress level) have successfully implemented IWRM principles through integrated flood management and water quality programmes, demonstrating its potential effectiveness.
Limitations of IWRM:
- Resource 2 notes that IWRM adoption "remains uneven across governance contexts." Many countries, particularly in Sub-Saharan Africa (where over 40% lack basic water services), lack the institutional capacity, financial resources, and political will to implement IWRM effectively.
- IWRM can be slow to implement due to the need for cross-sectoral coordination and institutional reform, which may not address urgent water crises.
- In countries like India (Resource 1: 36% without safe sanitation, "High" stress), fragmented governance and competing demands from agriculture and industry make integrated management extremely challenging.
Conclusion: IWRM is a theoretically sound framework for water sustainability, but its effectiveness is highly dependent on governance capacity, financial resources, and political commitment. It is most effective in countries with strong institutions but may need to be adapted or supplemented with more immediate interventions in less developed contexts.
Section B: Structured and Extended Response Questions (30 marks)
Question 3 (20 marks total)
Q3(a) Define the term energy mix and explain why it is important for resource sustainability. [4]
Marking Scheme: 2 marks for definition, 2 marks for explanation of importance.
Model Answer:
Definition: Energy mix refers to the combination of different primary energy sources (e.g., fossil fuels such as coal, oil, and natural gas; nuclear energy; and renewable sources such as solar, wind, hydroelectric, biomass, and geothermal) used to meet a country's or region's total energy demand.
Importance for resource sustainability:
- A diversified energy mix reduces dependence on any single energy source, enhancing energy security and reducing vulnerability to supply disruptions or price volatility.
- Incorporating a greater proportion of renewable energy sources into the mix reduces the depletion of finite fossil fuel reserves and lowers greenhouse gas emissions, contributing to long-term environmental sustainability.
- A sustainable energy mix balances the energy trilemma of security, affordability, and environmental sustainability, ensuring that current energy needs are met without compromising future generations' ability to meet theirs.
Q3(b) Explain three factors that influence a country's choice of energy mix. [6]
Marking Scheme: 2 marks per factor (1 for identification, 1 for development/explanation).
Model Answer:
Factor 1: Natural resource endowment and geography. A country's available natural resources fundamentally shape its energy mix. For example, Saudi Arabia's vast oil reserves have historically led to a fossil fuel-dominated energy mix, while Iceland's abundant geothermal and hydroelectric resources enable it to generate nearly 100% of its electricity from renewables. Similarly, countries with high solar irradiance (e.g., Australia, UAE) are better positioned to adopt solar energy.
Factor 2: Economic development and financial capacity. Wealthier nations can afford the high capital costs of transitioning to renewable energy infrastructure, such as offshore wind farms or nuclear power plants. Developing countries may rely on cheaper, more accessible fossil fuels (e.g., coal in India and China) because they prioritise affordable energy access for economic growth and poverty reduction. The cost of technology also matters — as solar PV costs have fallen by over 80% since 2010, more countries can now afford to incorporate solar into their mix.
Factor 3: Government policy and political will. National energy policies, international commitments (e.g., Paris Agreement targets), and political priorities significantly influence the energy mix. For instance, Germany's Energiewende policy has driven a rapid expansion of wind and solar power, while France's long-standing commitment to nuclear energy means it generates approximately 70% of its electricity from nuclear sources. Subsidies, carbon taxes, and renewable energy targets are policy tools that directly shape the energy mix.
Alternative valid factors:
- Public opinion and social acceptance (e.g., opposition to nuclear power in some countries).
- Technological advancement and infrastructure readiness.
- Energy security concerns and geopolitical considerations.
Q3(c) "Renewable energy alone can solve the global energy crisis." How far do you agree with this statement? Justify your answer with reference to specific examples. [10]
Marking Scheme:
| Marks | Descriptor |
|---|---|
| 1–3 | Limited argument; may agree or disagree without substantiation; no or weak examples; descriptive rather than evaluative. |
| 4–6 | Some evaluation with examples; argument may be unbalanced; limited consideration of counter-arguments. |
| 7–8 | Well-structured argument with specific examples; addresses both sides; some evaluation but conclusion may lack full substantiation. |
| 9–10 | Comprehensive, balanced evaluation with detailed specific examples; clear line of reasoning; well-substantiated conclusion that directly addresses the statement. |
Model Answer:
Introduction: The global energy crisis encompasses not only the depletion of fossil fuels but also energy insecurity, environmental degradation, and unequal access to affordable energy. While renewable energy is a critical component of any solution, I partially disagree with the statement that it alone can solve the crisis, due to issues of intermittency, storage, scalability, and the continued energy needs of developing nations.
Arguments supporting the role of renewable energy:
- Renewable energy technologies have advanced dramatically. The cost of solar PV has fallen by over 80% since 2010, and wind energy is now cost-competitive with fossil fuels in many markets. Countries like Costa Rica have achieved over 98% renewable electricity generation, demonstrating that renewables can meet the vast majority of energy demand in favourable contexts.
- Renewables produce minimal greenhouse gas emissions during operation, directly addressing the climate dimension of the energy crisis. The expansion of solar and wind in countries like Denmark (which generated 55% of its electricity from wind in 2023) shows that high renewable penetration is achievable.
- Renewable energy can enhance energy independence by reducing reliance on imported fossil fuels, improving energy security for nations without domestic fossil fuel reserves.
Arguments that renewable energy ALONE is insufficient:
- Intermittency and storage challenges: Solar and wind energy are variable — they depend on weather conditions and time of day. Current battery storage technology is expensive and not yet capable of providing grid-scale storage for extended periods. For example, Germany has invested heavily in renewables but still relies on natural gas and coal as backup during periods of low wind and solar generation (Dunkelflaute), highlighting the need for complementary energy sources or storage solutions.
- Industrial and heavy transport sectors are difficult to electrify with current technology. Steel manufacturing, aviation, and shipping require high-energy-density fuels that renewables cannot yet fully replace. This suggests that some role for alternative energy sources (e.g., hydrogen, nuclear, or carbon capture) may be necessary.
- Developing countries face significant barriers to renewable energy adoption, including high upfront costs, lack of infrastructure, and the need for rapid energy access expansion. India, for instance, while rapidly expanding its solar capacity (over 70 GW installed by 2024), still relies heavily on coal to meet the energy demands of its 1.4 billion population and growing economy. Expecting renewables alone to solve the crisis ignores the development needs and financial constraints of the Global South.
- Material and land requirements for renewable energy infrastructure are substantial. Solar farms and wind turbines require large land areas and significant quantities of rare earth minerals (e.g., lithium, cobalt), the extraction of which raises its own environmental and ethical concerns.
Conclusion: Renewable energy is an essential and growing part of the solution to the global energy crisis, but it cannot single-handedly resolve all dimensions of the problem. A diversified approach that combines renewables with improved energy storage, energy efficiency measures, nuclear power where socially accepted, and transitional use of cleaner fossil fuel technologies (e.g., natural gas as a bridge fuel) is more realistic and effective. The solution must also be context-specific, recognising the different capacities and needs of developed and developing nations.
Question 4 (20 marks total)
Q4(a) Identify the two largest components of municipal solid waste and suggest why organic matter constitutes the largest proportion. [3]
Marking Scheme: 1 mark for each correct identification (organic matter 35%, paper/cardboard 20%), 1 mark for explanation of organic matter proportion.
Model Answer:
The two largest components of municipal solid waste are organic matter (35%) and paper/cardboard (20%).
Organic matter constitutes the largest proportion because it includes food waste, garden waste, and other biodegradable materials that are generated in large quantities in high-income countries. In such countries, high levels of food consumption, food processing, and retail waste (e.g., unsold produce, plate waste, packaging-contaminated food) contribute to significant organic waste streams. Additionally, the prevalence of lawn maintenance and landscaping in suburban areas of high-income countries adds garden waste (grass clippings, leaves, prunings) to the organic fraction.
Q4(b) Explain how the waste hierarchy (reduce, reuse, recycle, recover, dispose) can contribute to resource sustainability. Refer to specific waste components from the chart in your answer. [7]
Marking Scheme:
| Marks | Descriptor |
|---|---|
| 1–2 | Describes the waste hierarchy with little reference to the chart or resource sustainability. |
| 3–4 | Explains the hierarchy with some reference to chart components; limited development of sustainability link. |
| 5–6 | Well-developed explanation linking hierarchy levels to specific waste components; clear sustainability reasoning. |
| 7 | Comprehensive explanation with specific chart references, clear causal chains, and strong sustainability argument. |
Model Answer:
The waste hierarchy prioritises waste management strategies from most to least environmentally preferable, and each level contributes to resource sustainability by conserving materials, reducing extraction of virgin resources, and minimising environmental degradation.
Reduce (most preferred): Reducing waste at the source is the most effective way to conserve resources. For example, reducing the 35% organic matter component could involve public campaigns to reduce food waste (e.g., South Korea's food waste reduction programme, which uses smart bins and charging by weight). Reducing the 12% plastics component could involve banning single-use plastics or encouraging consumers to choose products with less packaging. By preventing waste from being created in the first place, the demand for raw materials and the energy used in manufacturing are reduced.
Reuse: Reusing items extends their lifespan and delays their entry into the waste stream. Paper and cardboard (20%) can be reused as packaging material or for crafts and insulation before being discarded. Glass (7%) containers can be refilled and reused, as seen in deposit-return schemes in countries like Germany. Reuse reduces the need for new production, saving both materials and energy.
Recycle: Recycling converts waste materials into new products, reducing the need for virgin resource extraction. Plastics (12%) can be recycled into new plastic products, polyester fibres for the textiles (4%) industry, or construction materials. Metals (6%) are highly recyclable — recycling aluminium saves up to 95% of the energy needed to produce it from bauxite ore. Paper/cardboard (20%) can be pulped and reprocessed into new paper products, reducing deforestation pressure.
Recover: Energy recovery involves extracting energy from waste that cannot be recycled. Organic matter (35%) can be processed through anaerobic digestion to produce biogas (methane) for electricity generation, or incinerated with energy recovery. This reduces the volume of waste going to landfill while generating energy, partially offsetting fossil fuel use.
Dispose (least preferred): Landfilling is the last resort. Even at this stage, modern sanitary landfills with methane capture systems can recover some energy from decomposing organic waste. However, disposal represents a loss of potentially valuable resources and can cause pollution (leachate, greenhouse gas emissions), making it the least sustainable option.
Overall contribution to sustainability: By following the hierarchy, the total volume of waste requiring disposal is minimised, virgin resource extraction is reduced, energy consumption in manufacturing is lowered, and pollution is decreased — all of which contribute to more sustainable resource use.
Q4(c) Evaluate the role of government policy in promoting a circular economy for resources. Use examples from at least two different countries in your response. [10]
Marking Scheme:
| Marks | Descriptor |
|---|---|
| 1–3 | Describes government policies with limited evaluation; may use only one example; weak link to circular economy concept. |
| 4–6 | Evaluates policies with at least two country examples; some strengths and limitations identified; moderate development. |
| 7–8 | Well-structured evaluation with specific country examples; clear understanding of circular economy; balanced argument. |
| 9–10 | Comprehensive, nuanced evaluation with detailed specific examples; sophisticated understanding of circular economy; well-substantiated conclusion. |
Model Answer:
A circular economy is an economic system aimed at eliminating waste and continually reusing resources through strategies such as designing for durability, reuse, remanufacturing, and recycling — in contrast to the traditional linear "take-make-dispose" model. Government policy plays a pivotal role in driving the transition to a circular economy, though its effectiveness varies depending on enforcement, public participation, and economic context.
Country Example 1: Japan
Japan has been a global leader in circular economy policy. The Fundamental Act on Establishing a Sound Material-Cycle Society (2000) established a comprehensive legal framework promoting the 3Rs (Reduce, Reuse, Recycle). Specific policies include:
- The Home Appliance Recycling Law (2001), which requires consumers to pay a recycling fee when disposing of appliances (refrigerators, washing machines, TVs), and manufacturers to recycle them. This has achieved recycling rates of over 80% for targeted appliances.
- The Containers and Packaging Recycling Law, which places responsibility on manufacturers and businesses to recycle packaging waste, reducing the paper/cardboard (20%) and plastics (12%) components of waste.
- Japan's Eco-Town programme promotes industrial symbiosis, where waste from one industry becomes raw material for another.
Effectiveness: Japan's policies have been highly effective — the country recycles approximately 20% of its municipal waste and has one of the lowest landfill rates among OECD nations. However, critics argue that Japan still has high per capita waste generation and that some "recycling" involves thermal recovery (incineration) rather than true material circularity.
Country Example 2: The Netherlands
The Netherlands has set ambitious targets to become fully circular by 2050, with an interim target of halving raw material use by 2030. Key policies include:
- The National Circular Economy Programme (2016), which identifies five priority sectors: biomass and food, plastics, manufacturing, construction, and consumer goods.
- Extended Producer Responsibility (EPR) schemes that require producers to take responsibility for the end-of-life management of their products, incentivising design for recyclability.
- Landfill bans on specific waste streams (e.g., organic waste, recyclable materials), forcing diversion to recycling and recovery.
- Tax incentives for businesses that adopt circular practices, such as using recycled materials in manufacturing.
Effectiveness: The Netherlands recycles approximately 50% of its household waste and has one of the highest recycling rates in the EU. The country's focus on industrial symbiosis (e.g., in the Port of Rotterdam, where waste heat from industrial processes is used to heat homes) demonstrates innovative circular economy thinking. However, challenges remain in changing consumer behaviour and in recycling complex products (e.g., electronics with mixed materials).
Country Example 3: Singapore (additional example)
Singapore's Zero Waste Masterplan (2019) aims to reduce waste sent to Semakau Landfill by 30% by 2030 and extend the landfill's lifespan beyond 2035. Policies include:
- The Resource Sustainability Act (2019), which mandates e-waste management (producers must collect and recycle electronic waste) and mandatory packaging reporting (companies must report the types and quantities of packaging they use).
- The Extended Producer Responsibility (EPR) framework for e-waste, making producers financially responsible for end-of-life management.
Effectiveness: Singapore's policies are relatively recent, and results are still emerging. The mandatory packaging reporting is a world-first, but recycling rates remain low (approximately 4% for plastics), suggesting that policy alone is insufficient without public education and behavioural change.
Evaluation of government policy effectiveness:
Government policy is essential for creating the regulatory and economic framework for a circular economy. Without government intervention, market failures (e.g., the external cost of waste disposal not being reflected in product prices) mean that businesses and consumers have little incentive to reduce waste or recycle.
However, policy effectiveness depends on:
- Enforcement and monitoring — laws are only as good as their implementation.
- Public awareness and participation — even the best policies fail without citizen engagement.
- Economic incentives — policies that make circular practices financially attractive (e.g., subsidies, tax breaks) are more effective than purely regulatory approaches.
- International cooperation — in a globalised economy, circular economy policies in one country can be undermined by waste exports or unsustainable supply chains.
Conclusion: Government policy is a necessary but not sufficient condition for a successful transition to a circular economy. The most effective approaches combine regulation, economic incentives, public education, and industry collaboration, as demonstrated by Japan and the Netherlands. Singapore's experience shows that even well-designed policies take time to produce results and must be continuously adapted.
Free quiz and exam paper access
Enter your details to view this paper
Your access is remembered on this device.