AI Generated Exam Paper
A Level H2 Geography Practice Paper 4
Free A Level H2 Geography Practice Paper 4, LongCat AI version, with questions, answers, and A Level-style practice for Singapore students.
These static practice materials are generated from the site's syllabus and paper-generation workflow, with source and model context shown so students and parents can evaluate the material before use.
Questions
TuitionGoWhere Practice Paper - Geography H2 A-Level
TuitionGoWhere Practice Paper (AI)
Subject: Geography H2 Level: A-Level Paper: Practice Paper — Resources & Sustainability Version: 4 of 5 Duration: 1 hour 30 minutes Total Marks: 60
Name: ___________________________ Class: ___________________________ Date: ___________________________
Instructions
- Answer all questions in Section A and Section B.
- Write your answers in the spaces provided.
- The number of marks for each question or part-question is shown in brackets [ ].
- Begin each section on a fresh page.
- Credit will be given for the use of relevant examples, case studies, and evidence.
- Where a question refers to a resource, study the resource carefully before answering.
- You may use a calculator where appropriate.
Section A: Source-Based Questions (30 marks)
Answer all questions in this section.
Question 1
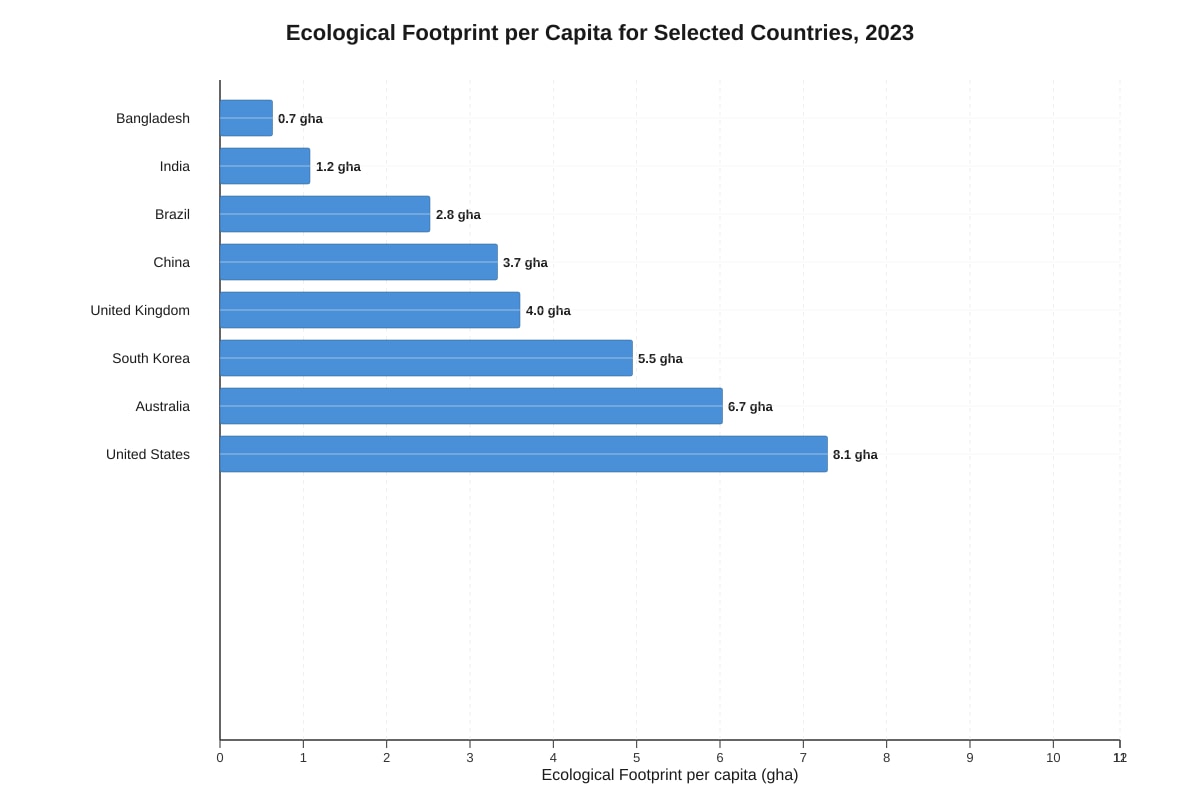
Resource 1 shows the global Ecological Footprint per capita (in global hectares, gha) for selected countries in 2023.
Generated chart for Q1.
(a) Describe the pattern of Ecological Footprint per capita shown in Resource 1. [3]
(b) Suggest two reasons why some countries have a significantly higher Ecological Footprint per capita than others. [4]
Question 2
Resource 2 is an extract from a report on Singapore's water sustainability strategy.
"Singapore imports approximately 40% of its water from Malaysia under agreements that expire in 2061. To reduce this dependency, the government has invested heavily in the 'Four National Taps' strategy: (1) local catchment water, (2) imported water, (3) NEWater (recycled water), and (4) desalinated water. NEWater now meets up to 40% of national water demand, and desalination plants contribute approximately 25%. The target is for desalination and NEWater combined to meet 85% of water demand by 2060. However, desalination is energy-intensive, requiring approximately 3.5 kWh per cubic metre of water produced, raising concerns about carbon emissions and long-term sustainability."
— Adapted from PUB Singapore Annual Report, 2023
(a) Using Resource 2, identify the four components of Singapore's 'Four National Taps' strategy. [2]
(i) ______________________________________________________________________ (ii) _____________________________________________________________________ (iii) ____________________________________________________________________ (iv) ____________________________________________________________________
(b) Explain why Singapore's reliance on desalination may present a sustainability challenge despite addressing water scarcity. [4]
(c) Evaluate the effectiveness of Singapore's approach to achieving water sustainability. [6]
Question 3
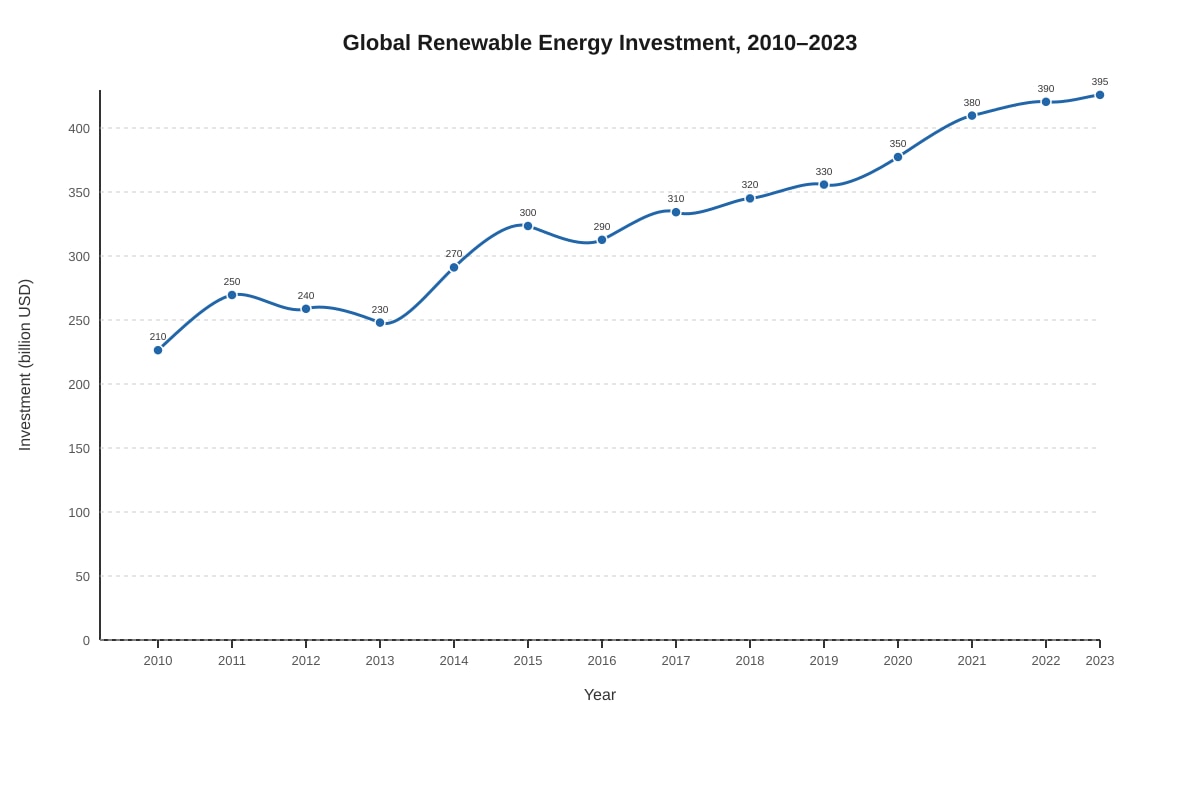
Resource 3 shows a graph of global renewable energy investment (in billion USD) from 2010 to 2023.
Generated graph for Q3.
(a) Describe the trend in global renewable energy investment shown in Resource 3. [3]
(b) Explain three factors that have contributed to the growth in renewable energy investment globally. [6]
Factor 1: ________________________________________________________________
Factor 2: ________________________________________________________________
Factor 3: ________________________________________________________________
(c) To what extent can renewable energy investment alone achieve global resource sustainability? [6]
Section B: Structured and Essay Questions (30 marks)
Answer all questions in this section.
Question 4
(a) Define the term carrying capacity in the context of resource sustainability. [2]
(b) Explain how two different human activities can exceed the carrying capacity of an environment. [6]
Activity 1: _______________________________________________________________
Activity 2: _______________________________________________________________
(c) Discuss the view that technological innovation is the most important factor in achieving resource sustainability. [8]
Question 5
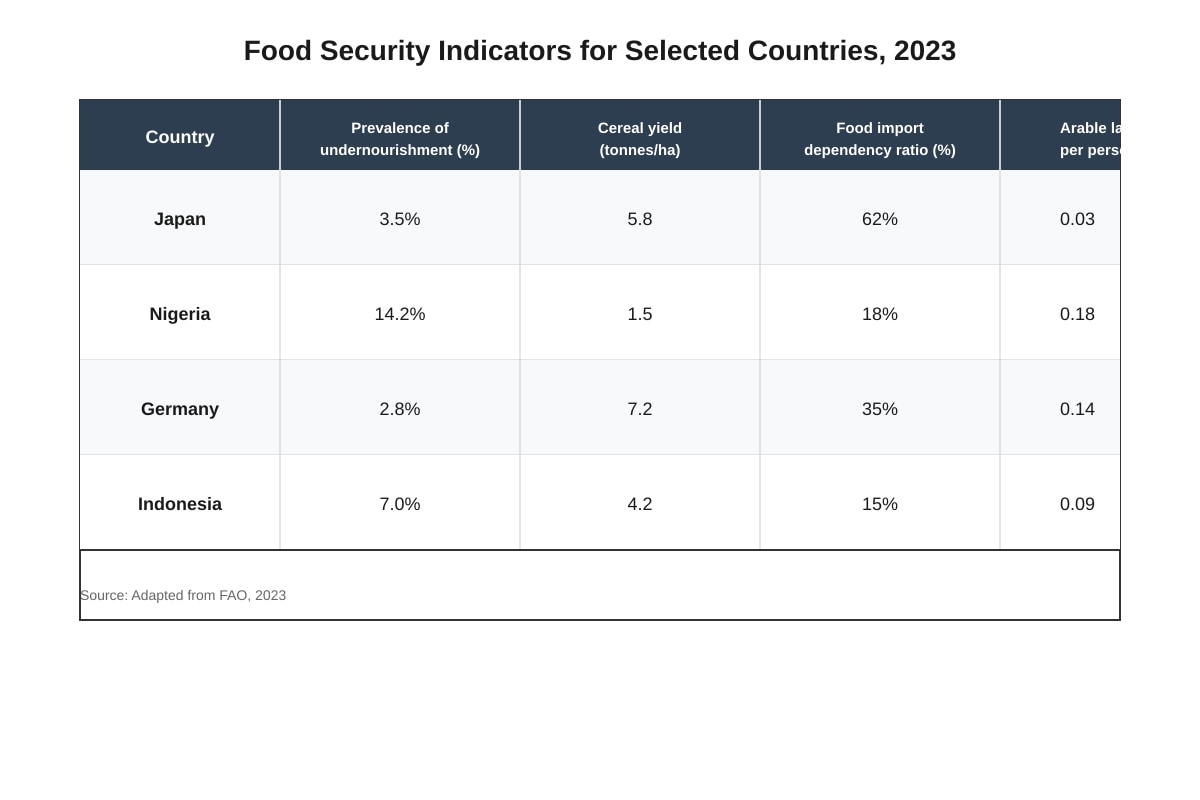
Resource 4 shows a table comparing food security indicators for four countries in 2023.
Generated table for Q5.
(a) Using Resource 4, compare the food security profiles of Nigeria and Germany. [4]
(b) Suggest three strategies that a country with high food import dependency could adopt to improve its food security sustainably. [6]
Strategy 1: ______________________________________________________________
Strategy 2: ______________________________________________________________
Strategy 3: ______________________________________________________________
(c) Assess the challenges that developing countries face in achieving food security in the context of climate change. [8]
Question 6
"The tragedy of the commons is the greatest barrier to global resource sustainability."
How far do you agree with this statement? [10]
End of Practice Paper
Section A Total: 30 marks | Section B Total: 30 marks | Grand Total: 60 marks
Answers
TuitionGoWhere Practice Paper — Geography H2 A-Level
Answer Key & Marking Scheme
Subject: Geography H2 | Paper: Practice Paper — Resources & Sustainability | Version: 4 of 5 Total Marks: 60
Section A: Source-Based Questions (30 marks)
Question 1
(a) Describe the pattern of Ecological Footprint per capita shown in Resource 1. [3]
Answer: The Ecological Footprint per capita varies significantly across the eight countries. Developed nations such as the United States (8.1 gha) and Australia (6.7 gha) have the highest footprints, while developing countries such as Bangladesh (0.7 gha) and India (1.2 gha) have the lowest. There is a general pattern where higher-income countries tend to have larger ecological footprints. The United States' footprint is more than eleven times that of Bangladesh. South Korea (5.5 gha) and the United Kingdom (4.0 gha) fall in the middle range, while China (3.7 gha) and Brazil (2.8 gha) occupy an intermediate position despite being major economies.
Marking Scheme:
- 1 mark: Identifies the general range or spread of values (highest and lowest named).
- 1 mark: Describes the overall pattern/trend (e.g., developed countries higher than developing countries).
- 1 mark: Uses specific data from the resource to support the description (at least two accurate figures).
Common Mistakes:
- Simply listing each country's value without comparative language (e.g., "higher than," "lowest").
- Failing to reference actual gha figures from the resource.
(b) Suggest two reasons why some countries have a significantly higher Ecological Footprint per capita than others. [4]
Answer:
Reason 1: Higher levels of consumption and affluence Developed countries such as the United States and Australia have higher per capita incomes, leading to greater consumption of goods, energy, and resources. Higher car ownership, larger homes requiring more heating/cooling, and greater meat consumption all contribute to a larger ecological footprint.
Reason 2: Energy-intensive industrial and economic structures Industrialised economies rely heavily on fossil fuels for manufacturing, transportation, and electricity generation. Countries with large industrial sectors (e.g., South Korea, USA) require more energy and raw materials per capita, increasing their footprint compared to agrarian or less industrialised economies like Bangladesh or India.
Marking Scheme:
- 2 marks per reason (1 for identifying the reason, 1 for developing/explaining it with geographical reasoning).
- Maximum 4 marks.
Acceptable alternatives:
- Greater reliance on private transport / urban sprawl.
- Higher levels of waste generation and landfill use.
- Greater demand for imported goods (embedded carbon/water footprints).
- Differences in dietary patterns (meat-heavy vs. plant-based diets).
Question 2
(a) Using Resource 2, identify the four components of Singapore's 'Four National Taps' strategy. [2]
Answer: (i) Local catchment water (ii) Imported water (iii) NEWater (recycled water) (iv) Desalinated water
Marking Scheme:
- 0.5 marks per correct component. Total: 2 marks.
(b) Explain why Singapore's reliance on desalination may present a sustainability challenge despite addressing water scarcity. [4]
Answer: Desalination is highly energy-intensive, requiring approximately 3.5 kWh per cubic metre of water produced. This energy demand, if met through fossil fuel combustion, contributes significantly to carbon emissions, which undermines climate change mitigation efforts. As Singapore scales up desalination to meet 85% of demand by 2060 (combined with NEWater), the cumulative energy consumption and associated greenhouse gas emissions could become substantial. This creates a paradox where solving one sustainability challenge (water scarcity) exacerbates another (climate change). Additionally, the brine waste product from desalination can harm marine ecosystems if not properly managed.
Marking Scheme:
- 1 mark: Identifies the energy-intensive nature of desalination (with reference to data from Resource 2).
- 1 mark: Explains the link to carbon emissions / climate change.
- 1 mark: Discusses the trade-off or paradox between water security and environmental sustainability.
- 1 mark: Further development (e.g., brine waste, long-term cost, or scaling concerns).
(c) Evaluate the effectiveness of Singapore's approach to achieving water sustainability. [6]
Answer:
Strengths: Singapore's Four National Taps strategy is highly effective because it diversifies water sources, reducing over-reliance on any single supply. By developing NEWater (meeting up to 40% of demand) and desalination (25%), Singapore has significantly reduced its dependence on imported water from Malaysia, which is subject to political and diplomatic risks, especially as agreements expire in 2061. The strategy demonstrates long-term planning and significant government investment in water technology, positioning Singapore as a global leader in water management.
Limitations: However, the approach has notable drawbacks. Both NEWater and desalination are energy-intensive processes. Desalination alone requires ~3.5 kWh/m³, and scaling these to meet 85% of demand by 2060 will substantially increase energy consumption and carbon emissions unless renewable energy is used. The high financial cost of building and maintaining desalination and NEWater plants is also a concern. Furthermore, public acceptance of NEWater (recycled wastewater) was initially a social barrier, though this has been largely overcome through public education.
Overall evaluation: On balance, Singapore's approach is largely effective in ensuring water security and reducing import dependency. However, true sustainability requires addressing the energy-carbon nexus. If Singapore can power its water infrastructure with renewable energy, the approach would be far more sustainable. The strategy is a model for other water-scarce nations but may not be easily replicable in countries with less financial and technological capacity.
Marking Scheme:
| Level | Marks | Descriptors |
|---|---|---|
| Level 1 | 1–2 | Simple statements with little development; may only address strengths or limitations. |
| Level 2 | 3–4 | Some evaluation with both strengths and limitations discussed, but unbalanced or lacking depth. |
| Level 3 | 5–6 | Balanced evaluation with well-developed arguments on both sides; clear judgement/conclusion; uses evidence from Resource 2. |
Question 3
(a) Describe the trend in global renewable energy investment shown in Resource 3. [3]
Answer: Global renewable energy investment showed an overall upward trend between 2010 and 2023, rising from approximately USD 210 billion to USD 395 billion — an increase of nearly 88%. However, the growth was not uniform. Investment dipped slightly between 2011 and 2013 (from USD 250 billion to USD 230 billion), possibly due to policy uncertainty or the global financial climate. From 2014 onwards, investment increased more consistently, with particularly strong growth from 2020 to 2023 (USD 350 billion to USD 395 billion), reflecting accelerating commitment to clean energy transitions.
Marking Scheme:
- 1 mark: Identifies the overall upward trend.
- 1 mark: References specific data points (at least two figures from the resource).
- 1 mark: Notes the fluctuation/dip in the early period (2011–2013) or describes the rate of change.
(b) Explain three factors that have contributed to the growth in renewable energy investment globally. [6]
Answer:
Factor 1: Declining costs of renewable technology The cost of solar photovoltaic (PV) modules has fallen by over 90% since 2010, and wind turbine costs have also decreased significantly. This makes renewable energy increasingly cost-competitive with fossil fuels, attracting greater private and public investment.
Factor 2: Government policies and international agreements Policies such as feed-in tariffs, renewable energy targets, tax incentives, and carbon pricing mechanisms have incentivised investment. International agreements like the Paris Agreement (2015) committed nations to reducing emissions, driving national-level renewable energy strategies and associated investment.
Factor 3: Growing corporate and investor demand for ESG compliance Environmental, Social, and Governance (ESG) criteria have become central to investment decisions. Corporations are committing to 100% renewable energy targets (e.g., RE100 initiative), and institutional investors are divesting from fossil fuels, redirecting capital towards renewable energy projects.
Marking Scheme:
- 2 marks per factor (1 for identifying the factor, 1 for explaining how it drives investment).
- Maximum 6 marks.
(c) To what extent can renewable energy investment alone achieve global resource sustainability? [6]
Answer:
Arguments that renewable energy investment CAN contribute significantly: Renewable energy investment directly addresses the root cause of climate change — fossil fuel combustion — which is arguably the greatest threat to global resource sustainability. By transitioning to solar, wind, and other renewables, countries can reduce greenhouse gas emissions, improve air quality, and decrease dependence on finite fossil fuel reserves. The falling costs of renewables make this transition increasingly viable even for developing countries.
Arguments that renewable energy investment ALONE is insufficient: However, resource sustainability encompasses far more than energy. It includes water resources, food security, biodiversity, mineral resources, and waste management. Renewable energy infrastructure itself requires significant mineral resources (e.g., lithium, cobalt, rare earth elements), the extraction of which can cause environmental degradation and social issues. Furthermore, without changes in consumption patterns, population growth, and land-use practices, renewable energy alone cannot prevent overexploitation of other resources. Issues such as overfishing, deforestation, and soil degradation require separate policy interventions.
Conclusion: Renewable energy investment is a necessary but not sufficient condition for global resource sustainability. It must be accompanied by circular economy approaches, sustainable agriculture, conservation policies, and changes in consumer behaviour to achieve truly sustainable resource use.
Marking Scheme:
| Level | Marks | Descriptors |
|---|---|---|
| Level 1 | 1–2 | One-sided argument; limited development; no clear judgement. |
| Level 2 | 3–4 | Addresses both sides but may be unbalanced; limited use of examples. |
| Level 3 | 5–6 | Balanced argument with clear evaluation; well-supported with examples; reaches a substantiated conclusion. |
Section B: Structured and Essay Questions (30 marks)
Question 4
(a) Define the term carrying capacity in the context of resource sustainability. [2]
Answer: Carrying capacity refers to the maximum number of individuals or level of resource consumption that an environment can sustainably support indefinitely without causing degradation of the resource base or ecosystem. In the context of resource sustainability, it represents the threshold beyond which resource use exceeds the environment's ability to regenerate, leading to depletion or environmental damage.
Marking Scheme:
- 1 mark: Correct definition of carrying capacity (maximum population/consumption an environment can support).
- 1 mark: Links the definition to sustainability or resource use (mention of regeneration, degradation, or long-term sustainability).
(b) Explain how two different human activities can exceed the carrying capacity of an environment. [6]
Answer:
Activity 1: Overfishing Overfishing occurs when fish are harvested at a rate faster than populations can reproduce and replenish. For example, the collapse of the Atlantic cod fishery off Newfoundland in the early 1990s demonstrated how industrial-scale fishing exceeded the carrying capacity of the marine ecosystem. Decades of intensive trawling reduced cod biomass to less than 1% of its historical levels, leading to a moratorium in 1992 that devastated local fishing communities. The ecosystem has still not fully recovered, illustrating how exceeding carrying capacity can cause long-term or irreversible damage.
Activity 2: Deforestation for agriculture Large-scale deforestation, such as in the Amazon rainforest for cattle ranching and soybean cultivation, exceeds the carrying capacity of the forest ecosystem. Trees are cleared faster than they can regrow, leading to soil erosion, loss of biodiversity, disruption of the water cycle, and release of stored carbon. The degraded land often becomes less productive over time, reducing the environment's ability to support agriculture itself — a feedback loop that further exceeds carrying capacity.
Marking Scheme:
- 3 marks per activity.
- 1 mark: Identifies the human activity.
- 1 mark: Explains the mechanism by which it exceeds carrying capacity.
- 1 mark: Provides a specific example or further development.
- Maximum 6 marks.
(c) Discuss the view that technological innovation is the most important factor in achieving resource sustainability. [8]
Answer:
Introduction: Technological innovation refers to the development and application of new technologies, processes, or systems that improve efficiency, reduce waste, or enable the use of alternative resources. While it plays a crucial role in advancing resource sustainability, whether it is the most important factor depends on the broader socio-economic and political context.
Arguments supporting the view: Technological innovation has been instrumental in addressing resource challenges. Precision agriculture, using GPS-guided machinery and drone monitoring, has reduced water and fertiliser use while increasing crop yields. Desalination technology has provided water security for arid regions such as Singapore and Israel. Renewable energy technologies (solar PV, wind turbines) have made clean energy cost-competitive with fossil fuels. Electric vehicles reduce dependence on petroleum. These examples demonstrate that technology can decouple economic growth from resource depletion.
Arguments against the view: However, technology alone is insufficient. Without effective governance, policies, and regulations, technological solutions may not be adopted or may be misused. For example, the Jevons Paradox suggests that increased efficiency through technology can lead to greater overall consumption rather than conservation. Social and behavioural factors are equally important — consumer choices, cultural attitudes towards waste, and population growth all influence resource sustainability. Furthermore, technological solutions are often expensive and inaccessible to developing countries, where resource challenges are most acute. Political will, international cooperation, and equitable distribution of technology are prerequisites for technology to be effective.
Conclusion: Technological innovation is a vital enabler of resource sustainability, but it is not the most important factor in isolation. It must be supported by effective governance, behavioural change, and equitable access. A holistic approach that integrates technology with policy, education, and social transformation is essential for achieving lasting resource sustainability.
Marking Scheme:
| Level | Marks | Descriptors |
|---|---|---|
| Level 1 | 1–3 | Basic understanding; one-sided argument; limited examples; descriptive rather than analytical. |
| Level 2 | 4–6 | Addresses both sides with some development; uses relevant examples; attempts evaluation but may lack depth or balance. |
| Level 3 | 7–8 | Well-balanced discussion with sustained argument; detailed and relevant examples; clear and substantiated conclusion; demonstrates synthesis and critical thinking. |
Question 5
(a) Using Resource 4, compare the food security profiles of Nigeria and Germany. [4]
Answer: Nigeria and Germany have markedly different food security profiles. Nigeria has a much higher prevalence of undernourishment (14.2%) compared to Germany (2.8%), indicating that a significant proportion of Nigeria's population lacks adequate food access. Germany's cereal yield (7.2 tonnes/ha) is nearly five times higher than Nigeria's (1.5 tonnes/ha), reflecting more advanced agricultural technology and practices in Germany. However, Nigeria has significantly more arable land per person (0.18 ha) than Germany (0.14 ha), suggesting greater potential agricultural capacity per capita. Germany has a much higher food import dependency ratio (35%) compared to Nigeria (18%), indicating that Germany relies more heavily on international trade to meet its food needs, while Nigeria is more self-reliant but less productive per unit area.
Marking Scheme:
- 1 mark: Compares undernourishment levels with data.
- 1 mark: Compares cereal yields with data.
- 1 mark: Compares arable land per person or import dependency with data.
- 1 mark: Uses comparative language throughout (e.g., "higher," "lower," "whereas").
Common Mistakes:
- Describing each country separately without direct comparison.
- Omitting data from the resource.
(b) Suggest three strategies that a country with high food import dependency could adopt to improve its food security sustainably. [6]
Answer:
Strategy 1: Invest in domestic agricultural technology and infrastructure A country could invest in modern irrigation systems, drought-resistant crop varieties, and precision agriculture to increase domestic yields sustainably. For example, Israel's drip irrigation technology has enabled high agricultural productivity in arid conditions. This reduces the need for imports while using resources efficiently.
Strategy 2: Diversify food import sources Rather than relying on a single trading partner, a country could establish trade agreements with multiple exporting nations to reduce vulnerability to supply disruptions. This does not reduce import dependency per se but makes the existing dependency more resilient and less risky.
Strategy 3: Reduce food waste and improve supply chain efficiency Approximately one-third of all food produced globally is lost or wasted. By investing in cold storage, transportation infrastructure, and public awareness campaigns to reduce household food waste, a country can effectively increase the amount of food available domestically without increasing production, thereby reducing the need for imports.
Marking Scheme:
- 2 marks per strategy (1 for identifying the strategy, 1 for explaining how it improves food security sustainably).
- Maximum 6 marks.
(c) Assess the challenges that developing countries face in achieving food security in the context of climate change. [8]
Answer:
Introduction: Food security exists when all people, at all times, have physical, social, and economic access to sufficient, safe, and nutritious food. Developing countries face acute challenges in achieving food security, and climate change exacerbates these difficulties through multiple pathways.
Challenge 1: Reduced agricultural productivity Climate change leads to rising temperatures, altered precipitation patterns, and increased frequency of extreme weather events such as droughts and floods. In sub-Saharan Africa, where agriculture is predominantly rain-fed, reduced and unpredictable rainfall directly threatens crop yields. The IPCC projects that crop yields in tropical regions could decline by 10–25% by 2050 under moderate warming scenarios, disproportionately affecting developing nations.
Challenge 2: Water scarcity Many developing countries already face water stress, and climate change is intensifying this through glacial melt, reduced river flows, and declining groundwater recharge. Agriculture accounts for approximately 70% of global freshwater withdrawals, and water scarcity directly limits irrigation potential and food production.
Challenge 3: Limited adaptive capacity Developing countries often lack the financial resources, technological infrastructure, and institutional capacity to adapt to climate change. Smallholder farmers, who produce up to 80% of food in some developing regions, have limited access to climate-resilient seeds, insurance, and early warning systems. This makes them disproportionately vulnerable to climate shocks.
Challenge 4: Conflict and displacement Climate change acts as a threat multiplier, exacerbating resource competition and contributing to conflict and displacement. In regions such as the Sahel and the Horn of Africa, climate-related resource scarcity has contributed to social instability, displacing farming communities and disrupting food systems.
Conclusion: Developing countries face a complex, interconnected set of challenges in achieving food security under climate change. Addressing these requires not only local adaptation strategies but also international cooperation, climate finance, technology transfer, and equitable global trade systems. Without significant intervention, climate change threatens to widen the gap between food-secure and food-insecure nations.
Marking Scheme:
| Level | Marks | Descriptors |
|---|---|---|
| Level 1 | 1–3 | Describes challenges with limited development; may focus on only one challenge; lacks specific examples. |
| Level 2 | 4–6 | Explains multiple challenges with some development; uses relevant examples; limited assessment of severity or interconnection. |
| Level 3 | 7–8 | Comprehensive assessment of multiple challenges; well-developed with specific examples; demonstrates understanding of interconnection between climate change and food security; may include a concluding judgement. |
Question 6
"The tragedy of the commons is the greatest barrier to global resource sustainability."
How far do you agree with this statement? [10]
Answer:
Introduction: The tragedy of the commons, a concept popularised by Garrett Hardin (1968), describes a situation where individuals, acting in their own self-interest, deplete or degrade a shared resource, even though this is contrary to the long-term interests of the group. While this is indeed a significant barrier to global resource sustainability, it is not the only — nor necessarily the greatest — barrier. Other factors including governance failures, economic inequality, population growth, and lack of technological access also play critical roles.
Arguments agreeing that the tragedy of the commons is the greatest barrier: The tragedy of the commons is evident in numerous global resource challenges. Overfishing in international waters is a classic example: no single nation owns the oceans, and each has an incentive to maximise its catch, leading to the depletion of fish stocks. The collapse of the Grand Banks cod fishery and the ongoing overexploitation of tuna stocks in the Pacific illustrate this dynamic. Similarly, greenhouse gas emissions represent a global commons problem — the atmosphere is a shared resource, and individual nations benefit from industrialisation while the costs of climate change are distributed globally. Deforestation in the Amazon, driven by individual landowners clearing forest for agriculture, degrades a resource that provides global ecosystem services (carbon sequestration, biodiversity). These examples demonstrate that the tragedy of the commons is a fundamental and pervasive barrier to sustainability.
Arguments that other barriers are equally or more significant: However, governance failures and institutional weaknesses may be equally important barriers. Many resources are not true "commons" but are managed (or mismanaged) by governments and institutions. Corruption, lack of enforcement, and weak property rights can lead to resource degradation even without a commons dilemma. For example, deforestation in Indonesia is driven not solely by individual actors but by government policies granting concessions to palm oil companies. Economic inequality is another critical barrier: the wealthiest 10% of the global population is responsible for over 50% of carbon emissions, meaning that overconsumption by the wealthy — not the commons dilemma per se — is a primary driver of unsustainability. Population growth, particularly in developing countries, increases demand for resources and compounds all other barriers. Additionally, lack of access to sustainable technology in developing countries prevents the adoption of alternatives, regardless of whether a commons dilemma exists.
Synthesis: The tragedy of the commons is a powerful conceptual framework for understanding why shared resources are overexploited, and it applies to many of the most pressing global sustainability challenges. However, it is not the sole or necessarily the greatest barrier. In many cases, the root causes of resource unsustainability lie in governance failures, economic systems that incentivise overconsumption, and unequal access to resources and technology. Addressing resource sustainability requires not only managing the commons (e.g., through international agreements, quotas, and property rights) but also tackling systemic issues of inequality, governance, and economic structure.
Conclusion: I partially agree with the statement. The tragedy of the commons is a significant and pervasive barrier, but it operates within a broader context of governance, economic, and social factors that are equally — if not more — important. A comprehensive approach to resource sustainability must address the commons dilemma alongside these systemic issues.
Marking Scheme:
| Level | Marks | Descriptors |
|---|---|---|
| Level 1 | 1–3 | Basic understanding of the concept; one-sided argument; limited examples; descriptive. |
| Level 2 | 4–6 | Explains the tragedy of the commons with examples; begins to consider other barriers; some evaluation but may be unbalanced. |
| Level 3 | 7–8 | Well-developed argument on both sides; detailed and relevant examples; clear evaluation; attempts synthesis. |
| Level 4 | 9–10 | Comprehensive and nuanced discussion; excellent range of examples; sustained critical evaluation; clear and well-substantiated conclusion; demonstrates sophisticated synthesis and geographical thinking. |
End of Answer Key
Section A Total: 30 marks | Section B Total: 30 marks | Grand Total: 60 marks
Free quiz and exam paper access
Enter your details to view this paper
Your access is remembered on this device.