AI Generated Exam Paper
A Level H2 Geography Practice Paper 4
Free A Level H2 Geography Practice Paper 4, HY3 AI version, with questions, answers, and A Level-style practice for Singapore students.
These static practice materials are generated from the site's syllabus and paper-generation workflow, with source and model context shown so students and parents can evaluate the material before use.
Questions
Free quiz and exam paper access
Enter your details to view this paper
Your access is remembered on this device.
Answers
TuitionGoWhere Practice Paper - Geography H2 A-Level (Version 4) Answer Key
Total Marks: 60
Section A Answers (18 marks)
Q1. [2 marks]
- Sustainable development is development that meets the needs of the present without compromising the ability of future generations to meet their own needs (1 mark).
- It requires balancing economic growth, environmental protection, and social inclusion, recognising trade-offs and limits (1 mark). Teaching note: From Brundtland Report. Avoid defining only as "environmental protection".
Q2. [2 marks]
- Provisioning: e.g., food, freshwater, timber (1 mark).
- Regulating: e.g., climate regulation, flood control, water purification (1 mark). Teaching note: Provisioning = products obtained; regulating = benefits from ecosystem processes.
Q3. [2 marks]
- Proven reserves are quantities of a resource confirmed by exploration and economically extractable with current tech (1 mark).
- Speculative reserves are estimated to exist but not confirmed, with unknown economic feasibility (1 mark). Teaching note: Difference is in certainty and extractability.
Q4. [2 marks]
- Any two: (1) Ignores technological innovation that can raise carrying capacity; (2) Assumes fixed resource limits without considering distribution/access inequality; (3) Does not account for demographic transition reducing growth (2 marks, 1 each). Teaching note: Malthus seen as too pessimistic by modern geographers.
Q5. [3 marks]
- Country A has highest pressure (78% withdrawal) indicating near-full use of internal renewable water (1).
- Country C moderate (45%) (1).
- Country B low pressure (12%) with much unused capacity (1). Marking: Comparison across all three required.
Q6. [3 marks]
- Habitat destruction removes species/nutrient cycles (1) → reduces soil formation and primary production (support services) (1) → lowers ecosystem's capacity to maintain biogeochemical cycles (1). Teaching note: Supporting services underpin others.
Q7. [4 marks]
- Example: High-yield variety (HYV) seeds / mechanised irrigation / fertilisers (1).
- Explanation: Increased crop output per unit land, expanding food base beyond Malthusian limits (3 marks for how tech raised resource availability). Marking: 1 for example, 3 for reasoned explanation.
Section B Answers (24 marks)
Q8. [5 marks]
- City W highest economic (88) and balanced (env 72, soc 74) (1).
- City Y strongest environmental (80) but lower economic/social (1).
- City Z best social (77) but weakest economic/env (1).
- City X mid economic/social, weaker env (1).
- Overall: City W leads; trade-offs seen (e.g., Y env>econ) (1). Marking: Compare across dimensions and cities.
Q9. [3 marks]
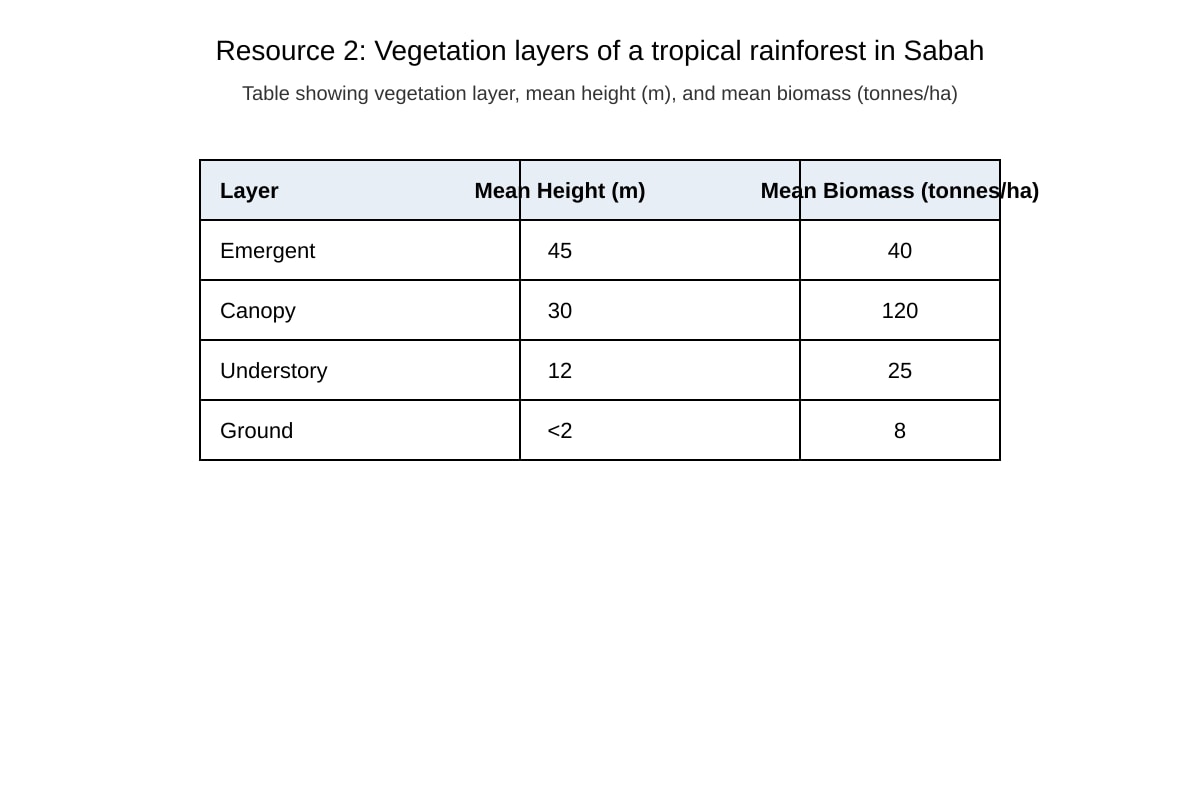
- Structure: 4 layers – emergent (45m), canopy (30m), understory (12m), ground (<2m) (1).
- Dense canopy with high biomass (1).
- Total mean biomass = 40+120+25+8 = 193 t/ha (1). Based on placeholder table values.
Q10. [4 marks]
- Proven reserves decline 120→95 Mt (1).
- Reason: depletion by extraction exceeding new discovery/upgrade (1); or reclassification to conditional as tech improves (1). Clear link (1). Marking: 2 for description, 2 for reason.
Q11. [3 marks]
- Nation P: solar 18% > Q 6%, more solar reliance (1).
- Nation Q: hydro 55% dominant vs P 22% (1).
- Q more hydro-centric, P more balanced solar+hydro (1).
Q12. [4 marks]
- Trade-off 1: Flood control vs displaced communities (2).
- Trade-off 2: Clean energy vs river ecosystem alteration / methane from reservoirs (2). Marking: 2 per trade-off with explanation.
Q13. [3 marks]
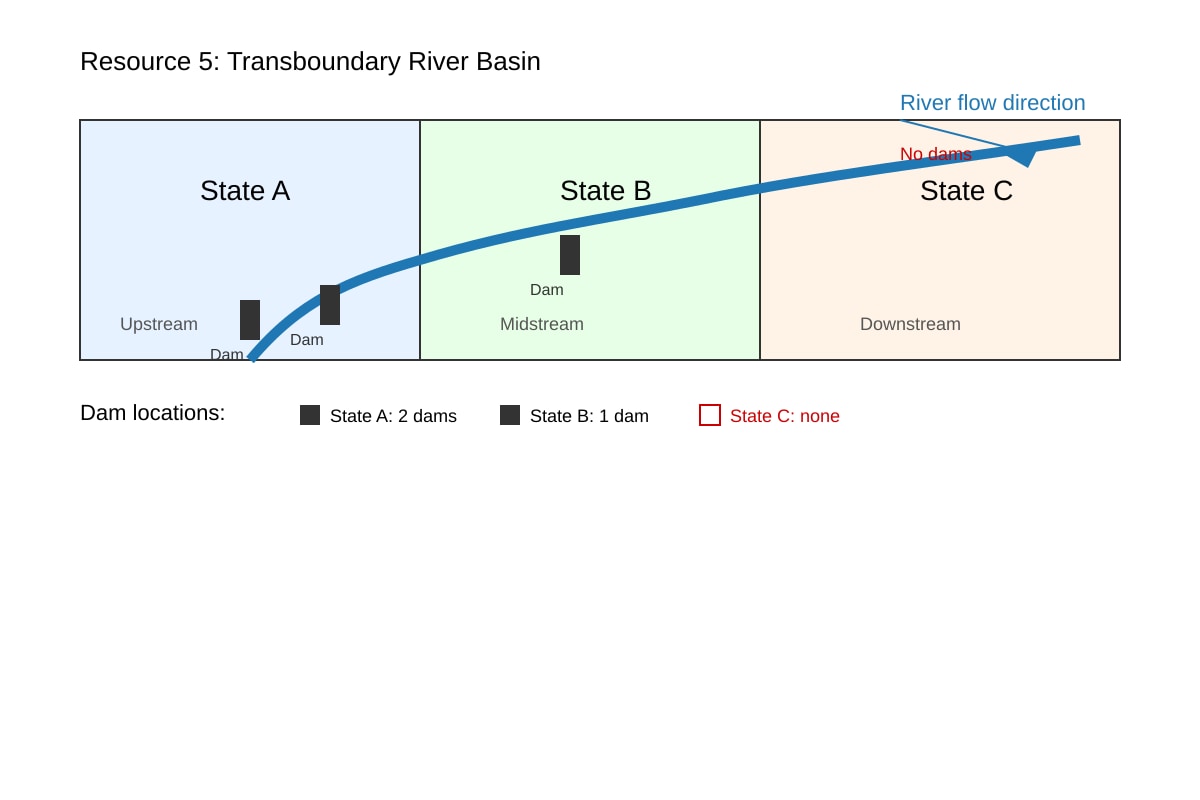
- Upstream dams reduce flow volume to downstream State C (1).
- Affects C's water supply/agriculture (1).
- No prior agreement → conflict (1). Based on map placeholder.
Q14. [2 marks]
- Limited extent: large firms dominate, community marginalised (1).
- But CSR, regulation can reduce impacts partially (1). Marking: Evaluative judgement required.
Section C Answers (18 marks)
Q15. [8 marks]
- Impact: Groundwater depth ↑ 20→52m (Resource 6) shows depletion (2).
- Wheat yield ↓ 3.1→2.2 t/ha (Resource 7) = unsustainability (2).
- Link: deeper water harder to extract, raising cost, reducing output (2).
- Strategy: drip irrigation / quota / recharge (2). Marking descriptors: Data use 4, linkage 2, strategy 2.
Q16. [6 marks]
- For: reduces waste, keeps materials in use (2).
- Against: needs tech/infrastructure lacking in industrialising states (2).
- Judgement: essential but partial without policy (2).
Q17. [4 marks]
- Indonesia loss 24% > Malaysia 16% > Vietnam 9% (2).
- Factor: e.g., palm oil expansion in Indo/Malay vs reforestation in VN (2). Marking: Compare 2, explain 2.
Total: 60 marks