AI Generated Exam Paper
A Level H2 Geography Practice Paper 3
Free A Level H2 Geography Practice Paper 3, LongCat AI version, with questions, answers, and A Level-style practice for Singapore students.
These static practice materials are generated from the site's syllabus and paper-generation workflow, with source and model context shown so students and parents can evaluate the material before use.
Questions
TuitionGoWhere Practice Paper - Geography H2 A-Level
TuitionGoWhere Practice Paper (AI)
Subject: Geography H2
Level: A-Level
Paper: Practice Paper (Version 3 of 5)
Duration: 1 hour 30 minutes
Total Marks: 60
Name: ___________________________
Class: ___________________________
Date: ___________________________
Instructions
- Answer all questions in the spaces provided.
- Read each question carefully before attempting your answer.
- The number of marks for each question is shown in brackets [ ].
- Quality of written communication will be assessed in questions marked with an asterisk (*).
- You may use a calculator where appropriate.
- Begin each section on a new page if needed.
Section A: Data-Based Questions (30 marks)
Answer all questions in this section.
Question 1
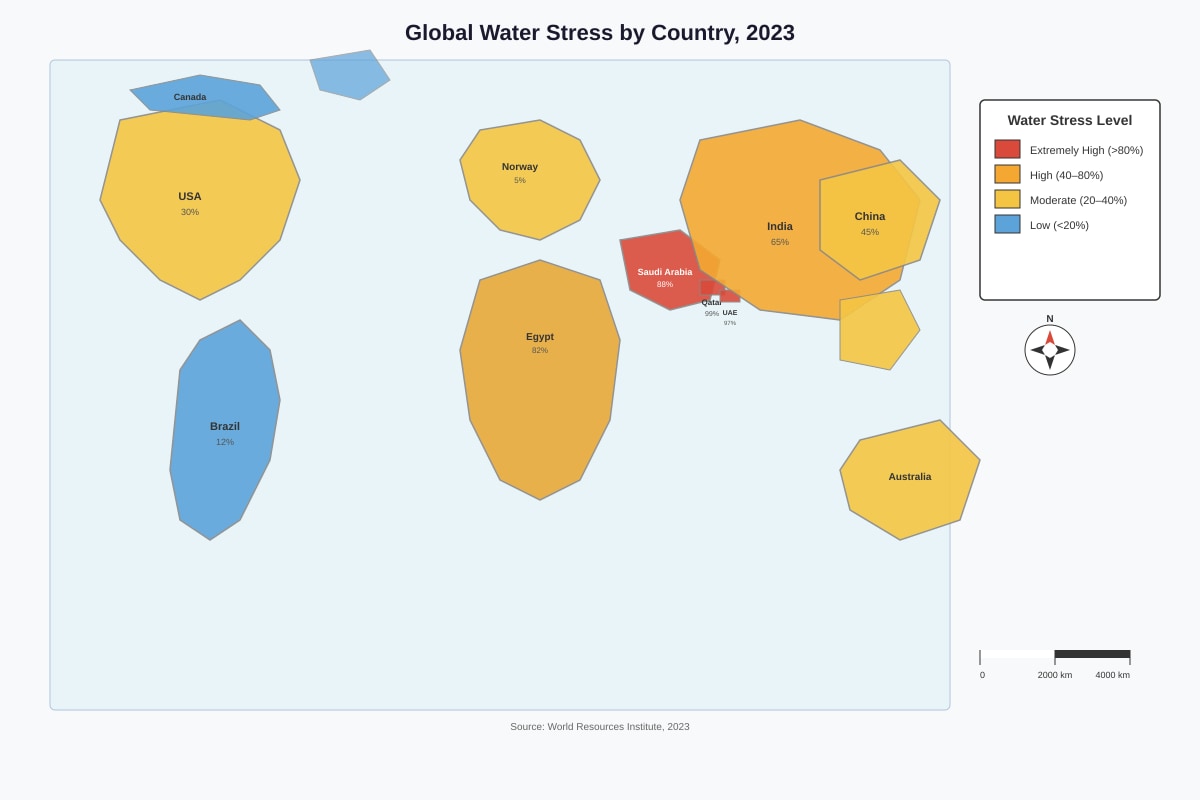
Study Resource A below, which shows the global distribution of water stress by country in 2023.
Generated map for Q1.
Resource A — Global water stress by country, 2023
(a) Describe the global pattern of water stress shown in Resource A. [3]
(b) Suggest two reasons why some countries in the Middle East experience extremely high water stress. [4]
(c) Explain how water stress can affect food security in a country of your choice. [3]
Question 2
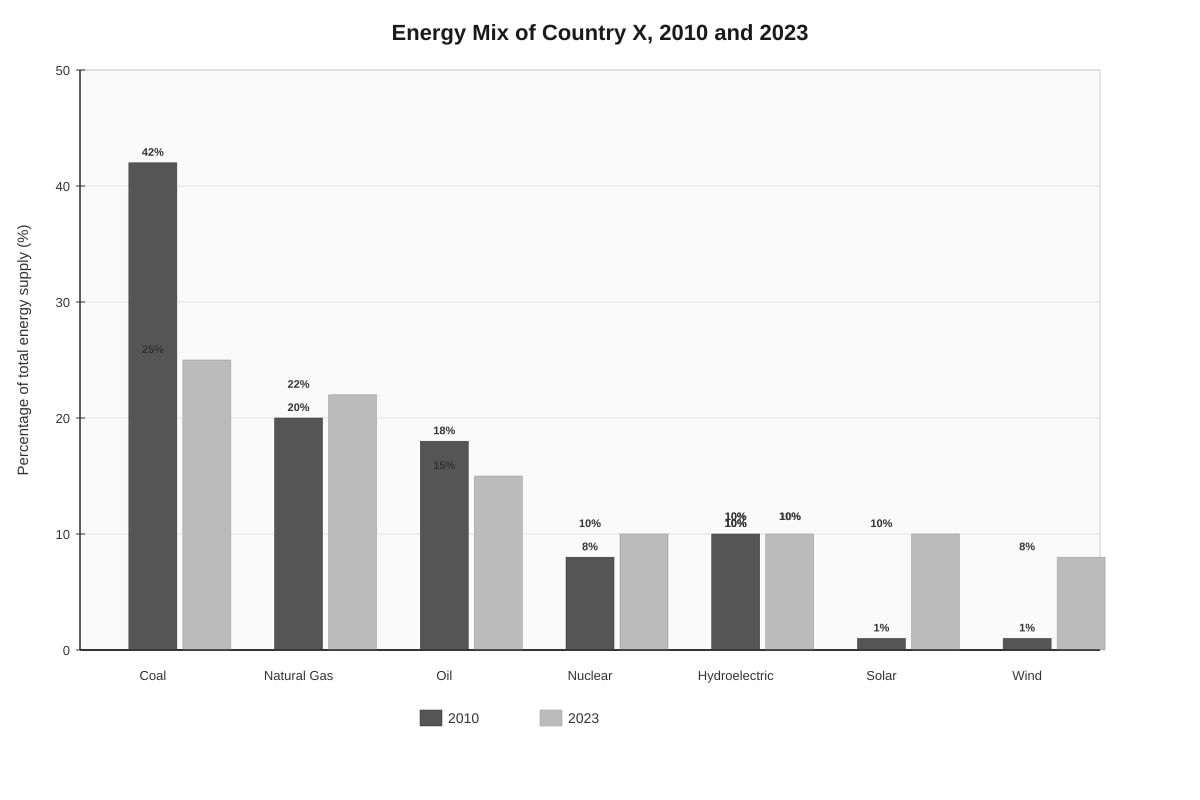
Study Resource B below, which shows the energy mix of Country X in 2010 and 2023.
Generated chart for Q2.
Resource B — Energy mix of Country X, 2010 and 2023
(a) Compare the energy mix of Country X between 2010 and 2023. [4]
(b) Calculate the total percentage of renewable energy sources in Country X's energy mix in 2023. Show your working. [2]
(c) Suggest two reasons why Country X has increased its use of solar and wind energy between 2010 and 2023. [4]
(d) Evaluate the extent to which Country X's energy transition contributes to resource sustainability. [5]
Question 3
Study Resource C below, which shows data on electronic waste (e-waste) generation and recycling rates for selected countries in 2022.
| Country | E-waste generated (million tonnes) | Population (millions) | Per capita e-waste (kg/person) | Recycling rate (%) |
|---|---|---|---|---|
| USA | 6.9 | 333 | 20.7 | 15 |
| China | 12.0 | 1412 | 8.5 | 20 |
| India | 4.2 | 1408 | 3.0 | 5 |
| Germany | 1.6 | 84 | 19.0 | 45 |
| Nigeria | 0.5 | 218 | 2.3 | 2 |
| Japan | 2.6 | 125 | 20.8 | 22 |
Resource C — Electronic waste generation and recycling data, 2022
(a) Which country generates the highest total amount of e-waste? Which country has the highest per capita e-waste generation? [2]
(b) Compare the recycling rates of the countries shown in Resource C. [3]
(c) Explain two challenges that developing countries face in managing e-waste sustainably. [4]
(d) Suggest one strategy that could improve global e-waste recycling rates and explain how it would work. [3]
Section B: Structured Response (15 marks)
Answer all questions in this section.
Question 4
(a) Define the term sustainable development. [2]
(b) Explain three ways in which the concept of the circular economy promotes resource sustainability. [6]
(c) Discuss the view that economic growth and resource sustainability are incompatible. [7]
Section C: Extended Response (15 marks)
Answer one question from this section.
Question 5*
"To what extent can renewable energy alone achieve resource sustainability?"
Discuss with reference to specific examples. [15]
Question 6*
"Population growth is the greatest threat to global resource sustainability."
How far do you agree with this statement? Discuss with reference to specific examples. [15]
END OF PAPER
Mark Summary
| Section | Questions | Marks |
|---|---|---|
| Section A: Data-Based Questions | Q1–Q3 | 30 |
| Section B: Structured Response | Q4 | 15 |
| Section C: Extended Response | Q5 or Q6 | 15 |
| Total | 60 |
Answers
TuitionGoWhere Practice Paper — Geography H2 A-Level
Answer Key and Marking Scheme (Version 3 of 5)
Section A: Data-Based Questions
Question 1
(a) Describe the global pattern of water stress shown in Resource A. [3]
Answer:
Water stress is highest in the Middle East and North Africa, where countries such as Qatar (99%), UAE (97%), and Saudi Arabia (88%) show extremely high water stress (>80%). South Asia also shows high stress, with India at 65%. East Asia shows moderate stress (China at 45%). The lowest water stress is found in South America (Brazil at 12%), Northern Europe (Norway at 5%), and parts of North America (USA at 30%). There is a clear geographical clustering, with arid and semi-arid regions experiencing the greatest water stress.
Marking:
- 1 mark for identifying the highest-stress regions (Middle East/North Africa).
- 1 mark for identifying lower-stress regions (South America, Northern Europe).
- 1 mark for recognising the geographical pattern/clustering rather than random distribution.
- Award reference to specific data values from the resource for full marks.
Common mistakes:
- Simply listing country values without describing the spatial pattern.
- Using vague language ("some countries have more") without naming regions or citing data.
(b) Suggest two reasons why some countries in the Middle East experience extremely high water stress. [4]
Answer:
-
Arid climate and low rainfall: The Middle East has a hot desert climate with very low annual precipitation (often less than 100 mm/year), meaning natural freshwater recharge of aquifers and rivers is minimal. This limits the total available water supply.
-
High water demand from agriculture and population growth: Irrigation for agriculture in arid environments requires enormous volumes of water. Rapid population growth and urbanisation in countries like UAE and Qatar have increased domestic and industrial water demand, further depleting limited freshwater resources.
Alternative valid reasons:
- Over-extraction of groundwater from fossil aquifers (e.g., Saudi Arabia's use of non-renewable deep aquifers).
- High evaporation rates due to extreme heat, reducing surface water availability.
- Limited natural freshwater sources (few perennial rivers or lakes).
- Energy-intensive desalination, which, while increasing supply, is costly and environmentally damaging.
Marking:
- 2 marks per reason (1 for identifying the reason, 1 for explaining how it contributes to water stress).
- Maximum 4 marks.
(c) Explain how water stress can affect food security in a country of your choice. [3]
Answer (using India as an example):
India experiences high water stress (65% of available water used), which directly affects food security. Agriculture accounts for approximately 80% of India's water use, primarily for irrigation of staple crops such as rice and wheat. When water becomes scarce, farmers cannot irrigate their fields adequately, leading to reduced crop yields. This decreases domestic food production, forcing India to either import more food (increasing costs and vulnerability to global price fluctuations) or face food shortages. Additionally, falling groundwater levels from over-extraction threaten long-term agricultural productivity, undermining the ability of India's growing population (over 1.4 billion) to feed itself sustainably.
Marking:
- 1 mark for identifying a relevant country and its water stress context.
- 1 mark for explaining the link between water scarcity and reduced agricultural output.
- 1 mark for explaining the consequence for food security (shortages, imports, price increases, or long-term threat).
Common mistakes:
- Discussing food security in general terms without linking it specifically to water stress.
- Choosing a country with low water stress without acknowledging the hypothetical scenario.
Question 2
(a) Compare the energy mix of Country X between 2010 and 2023. [4]
Answer:
Country X's energy mix has shifted significantly between 2010 and 2023. Coal has declined substantially from 42% to 25%, a decrease of 17 percentage points, making it still the largest single source but much less dominant. Oil has also decreased from 18% to 15%. In contrast, solar energy has increased dramatically from 1% to 10%, and wind energy has risen from 1% to 8%. Natural gas has increased slightly from 20% to 22%, and nuclear has risen from 8% to 10%. Hydroelectric has remained constant at 10%. Overall, the energy mix has become more diversified, with a clear shift away from fossil fuels (coal and oil) toward renewable sources (solar and wind).
Marking:
- 1 mark for noting the decline in coal (with data).
- 1 mark for noting the increase in solar and wind (with data).
- 1 mark for noting stability or minor changes in other sources.
- 1 mark for an overall comparative statement about the shift toward renewables/diversification.
Common mistakes:
- Only describing 2010 or 2023 in isolation without comparing.
- Failing to use data from the resource to support comparisons.
(b) Calculate the total percentage of renewable energy sources in Country X's energy mix in 2023. Show your working. [2]
Answer:
Renewable energy sources in 2023: Hydroelectric (10%) + Solar (10%) + Wind (8%) = 28%
Working:
Hydroelectric: 10%
Solar: 10%
Wind: 8%
Total renewable = 10 + 10 + 8 = 28%
Marking:
- 1 mark for identifying the correct renewable sources (hydroelectric, solar, wind).
- 1 mark for the correct total of 28%.
- If the student includes nuclear as renewable, accept the answer but note that nuclear is typically classified as low-carbon rather than renewable in most syllabi. The expected answer is 28%.
(c) Suggest two reasons why Country X has increased its use of solar and wind energy between 2010 and 2023. [4]
Answer:
-
Falling costs of renewable technology: The cost of solar photovoltaic panels and wind turbines has decreased dramatically since 2010 due to technological improvements, economies of scale, and increased global manufacturing (particularly from China). This has made solar and wind energy cost-competitive with or cheaper than fossil fuels, incentivising adoption.
-
Government policy and climate commitments: Country X may have introduced policies such as feed-in tariffs, renewable energy targets, carbon pricing, or subsidies to encourage renewable energy adoption. International commitments such as the Paris Agreement (2015) may also have driven Country X to reduce greenhouse gas emissions by transitioning away from coal and oil.
Alternative valid reasons:
- Growing public awareness and demand for clean energy.
- Energy security concerns (reducing dependence on imported fossil fuels).
- Job creation and economic opportunities in the renewable energy sector.
Marking:
- 2 marks per reason (1 for identifying the reason, 1 for explaining how it led to increased solar/wind use).
- Maximum 4 marks.
(d) Evaluate the extent to which Country X's energy transition contributes to resource sustainability. [5]
Answer:
Country X's energy transition contributes positively to resource sustainability in several ways. The shift from coal (42% to 25%) and oil (18% to 15%) to solar (1% to 10%) and wind (1% to 8%) reduces reliance on finite fossil fuel reserves, which are being depleted globally. Renewable sources are inexhaustible on human timescales, enhancing long-term energy security. Additionally, the reduction in fossil fuel combustion lowers greenhouse gas emissions and air pollution, contributing to environmental sustainability.
However, there are limitations. Coal still accounts for 25% of the energy mix, and natural gas (a fossil fuel) has increased slightly to 22%, meaning fossil fuels collectively still represent 62% of the energy mix. The transition is incomplete. Furthermore, renewable energy technologies require significant mineral resources (e.g., lithium, cobalt, rare earth elements for solar panels and wind turbines), and the extraction of these minerals can cause environmental degradation and raise questions about the sustainability of the supply chain. Intermittency of solar and wind also means energy storage solutions (batteries) are needed, which have their own environmental costs.
Overall, Country X's transition is a meaningful step toward resource sustainability, but it is not yet sufficient on its own. A more comprehensive approach including energy efficiency, demand reduction, and addressing the environmental costs of renewable technology production is needed.
Marking:
- 1–2 marks for explaining how the transition contributes to sustainability (reduced fossil fuel use, lower emissions, long-term resource availability).
- 1–2 marks for evaluating limitations (continued fossil fuel dependence, mineral extraction impacts, intermittency).
- 1 mark for a balanced conclusion that weighs both sides.
- Maximum 5 marks.
Question 3
(a) Which country generates the highest total amount of e-waste? Which country has the highest per capita e-waste generation? [2]
Answer:
- Highest total e-waste: China (12.0 million tonnes).
- Highest per capita e-waste: Japan (20.8 kg/person), marginally higher than the USA (20.7 kg/person).
Marking:
- 1 mark for China (total).
- 1 mark for Japan (per capita).
- Accept USA for per capita if the student notes it is approximately equal to Japan.
(b) Compare the recycling rates of the countries shown in Resource C. [3]
Answer:
Recycling rates vary significantly among the countries shown. Germany has the highest recycling rate at 45%, which is substantially higher than all other countries listed. Japan (22%) and China (20%) have moderate recycling rates, while the USA (15%), Nigeria (2%), and India (5%) have relatively low recycling rates. There is no clear correlation between a country's total e-waste generation and its recycling rate — for example, China generates the most e-waste but recycles 20%, while Germany generates far less but recycles 45%. Similarly, there is no consistent relationship between per capita e-waste and recycling rate.
Marking:
- 1 mark for identifying the range/highest and lowest (Germany 45% vs. Nigeria 2%).
- 1 mark for noting the lack of clear correlation between e-waste volume and recycling rate.
- 1 mark for using specific data from the table to support the comparison.
(c) Explain two challenges that developing countries face in managing e-waste sustainably. [4]
Answer:
-
Lack of formal recycling infrastructure: Developing countries such as India and Nigeria often lack the specialised facilities, technology, and funding needed to safely process e-waste. As a result, much e-waste is handled by the informal sector, where workers (including children) manually dismantle electronics without protective equipment, exposing themselves to toxic substances such as lead, mercury, and cadmium.
-
Illegal e-waste imports: Developing countries often receive e-waste illegally exported from developed countries under the guise of "used electronics" or "donations." This is driven by the Basel Convention's uneven enforcement and the lower cost of disposal in countries with weaker environmental regulations. The influx of foreign e-waste overwhelms local management capacity and creates severe environmental and health problems.
Alternative valid challenges:
- Limited public awareness of e-waste hazards.
- Absence of extended producer responsibility (EPR) legislation.
- Economic prioritisation of growth over environmental regulation.
Marking:
- 2 marks per challenge (1 for identifying the challenge, 1 for explaining its impact on sustainable e-waste management).
- Maximum 4 marks.
(d) Suggest one strategy that could improve global e-waste recycling rates and explain how it would work. [3]
Answer:
Strategy: Extended Producer Responsibility (EPR) legislation.
EPR requires manufacturers to take responsibility for the entire lifecycle of their products, including end-of-life disposal and recycling. Under EPR, electronics companies would be legally obligated to establish or fund collection and recycling systems for their products. This would incentivise manufacturers to design products that are easier to disassemble, repair, and recycle (eco-design), reducing waste and increasing recycling rates. Countries like Germany, which already has strong EPR laws, demonstrate higher recycling rates (45%), suggesting this approach is effective.
Alternative valid strategies:
- International enforcement of the Basel Convention to prevent illegal e-waste dumping.
- Investment in formal recycling infrastructure in developing countries.
- Public awareness campaigns to encourage consumer recycling behaviour.
Marking:
- 1 mark for identifying a valid strategy.
- 1 mark for explaining how the strategy works.
- 1 mark for explaining how it would improve recycling rates (cause-effect link).
Section B: Structured Response
Question 4
(a) Define the term sustainable development. [2]
Answer:
Sustainable development is development that meets the needs of the present without compromising the ability of future generations to meet their own needs. (Brundtland Commission, 1987.) It involves balancing economic growth, social equity, and environmental protection to ensure long-term viability of resources and human well-being.
Marking:
- 1 mark for the core definition (present needs without compromising future generations).
- 1 mark for elaboration (mention of the three pillars: economic, social, environmental, or long-term resource viability).
(b) Explain three ways in which the concept of the circular economy promotes resource sustainability. [6]
Answer:
-
Waste reduction through reuse and recycling: The circular economy aims to keep materials in use for as long as possible by designing products for durability, repairability, and recyclability. This reduces the volume of waste sent to landfills and decreases the demand for virgin raw materials, conserving finite natural resources.
-
Closed-loop material flows: In a circular economy, materials are recovered and reintegrated into production cycles rather than being discarded after a single use. For example, metals from discarded electronics can be extracted and reused in new products, reducing the need for environmentally damaging mining operations and preserving mineral resources.
-
Reduction in resource extraction and environmental degradation: By maximising the utility of existing materials, the circular economy reduces the pressure to extract new resources from the environment. This helps preserve ecosystems, reduces habitat destruction from mining and logging, and lowers the energy consumption and pollution associated with primary resource processing.
Marking:
- 2 marks per way (1 for identifying the way, 1 for explaining how it promotes resource sustainability).
- Maximum 6 marks.
(c) Discuss the view that economic growth and resource sustainability are incompatible. [7]
Answer:
Arguments that they are incompatible:
Traditional economic growth models rely on the continuous extraction and consumption of natural resources, generating waste and pollution as byproducts. The pursuit of GDP growth often prioritises short-term economic gains over long-term environmental health. For example, rapid industrialisation in China has driven impressive economic growth but has also resulted in severe air and water pollution, deforestation, and depletion of natural resources. The concept of planetary boundaries suggests that infinite economic growth on a finite planet is physically impossible — we are already exceeding safe limits for climate change, biodiversity loss, and nitrogen cycling. Consumerism, driven by economic growth, encourages overconsumption and planned obsolescence, accelerating resource depletion.
Arguments that they can be compatible:
However, economic growth and resource sustainability are not necessarily incompatible if growth is redefined and managed appropriately. The concept of "green growth" or "decoupling" suggests that economies can grow while reducing their environmental footprint through technological innovation, renewable energy, and improved resource efficiency. For example, Germany has maintained economic growth while significantly expanding its renewable energy sector and reducing carbon emissions. The circular economy model demonstrates that economic value can be created through reuse, recycling, and remanufacturing rather than through virgin resource extraction. Countries like Denmark and Costa Rica have shown that high human development and environmental sustainability can coexist.
Conclusion:
While traditional models of economic growth are indeed incompatible with resource sustainability, a fundamental restructuring of how growth is achieved — through decoupling, circular economy principles, and green technology — can reconcile the two. The key challenge is political will and the speed of transition.
Marking:
- 2–3 marks for arguments supporting incompatibility (with examples).
- 2–3 marks for arguments supporting compatibility (with examples).
- 1–2 marks for a balanced conclusion.
- Maximum 7 marks.
- Quality of argumentation and use of examples are key differentiators.
Section C: Extended Response
Question 5*
"To what extent can renewable energy alone achieve resource sustainability?" Discuss with reference to specific examples. [15]
Marking Descriptors:
| Level | Marks | Descriptors |
|---|---|---|
| Level 1 | 1–4 | Basic understanding; limited or no examples; one-sided argument; little structure. |
| Level 2 | 5–8 | Some understanding of renewable energy and sustainability; at least one example; some attempt at evaluation but unbalanced. |
| Level 3 | 9–12 | Good understanding; specific examples used; balanced evaluation of the extent; clear structure with some synthesis. |
| Level 4 | 13–15 | Comprehensive understanding; well-chosen specific examples; sustained evaluation; sophisticated synthesis; acknowledges complexity and nuance. |
Indicative Content:
How renewable energy contributes to resource sustainability:
- Renewable energy sources (solar, wind, hydroelectric, geothermal) are inexhaustible on human timescales, unlike finite fossil fuels. This ensures long-term energy security.
- Renewable energy produces little to no greenhouse gas emissions during operation, mitigating climate change and its associated resource impacts (e.g., water scarcity, agricultural disruption).
- Countries like Iceland (geothermal and hydroelectric providing ~100% of electricity) and Costa Rica (over 98% renewable electricity) demonstrate that high renewable penetration is achievable.
- Falling costs of solar and wind energy make renewables increasingly economically viable, reducing the financial barrier to adoption.
Limitations of relying on renewable energy alone:
- Intermittency: Solar and wind are variable and dependent on weather conditions, requiring energy storage (batteries) or backup power, which have their own resource demands (lithium, cobalt mining).
- Material intensity: Renewable infrastructure requires large quantities of metals and minerals. Solar panels need silicon and silver; wind turbines need rare earth elements; batteries need lithium and cobalt. Mining these materials causes environmental degradation and raises supply chain sustainability concerns.
- Land use: Large-scale solar and wind farms require significant land area, which can compete with agriculture and natural habitats. For example, the Bhadla Solar Park in India covers 57 km².
- Energy transition is only one aspect: Resource sustainability also encompasses water, food, minerals, and biodiversity. Renewable energy does not address overconsumption, food waste, water pollution, or unsustainable mining practices.
- Embodied energy and carbon: Manufacturing, transporting, and installing renewable infrastructure requires energy and resources, often from fossil fuel sources during the transition period.
Synthesis/Conclusion:
Renewable energy is a necessary but not sufficient condition for resource sustainability. While it addresses the critical issue of fossil fuel depletion and climate change, achieving full resource sustainability requires a broader approach including circular economy principles, demand reduction, sustainable consumption patterns, and integrated resource management across water, food, and materials.
Question 6*
"Population growth is the greatest threat to global resource sustainability." How far do you agree with this statement? Discuss with reference to specific examples. [15]
Marking Descriptors:
| Level | Marks | Descriptors |
|---|---|---|
| Level 1 | 1–4 | Basic understanding; limited or no examples; one-sided argument; little structure. |
| Level 2 | 5–8 | Some understanding of population-resource links; at least one example; some attempt at evaluation but unbalanced. |
| Level 3 | 9–12 | Good understanding; specific examples used; balanced evaluation considering multiple threats; clear structure with some synthesis. |
| Level 4 | 13–15 | Comprehensive understanding; well-chosen specific examples; sustained evaluation comparing population to other threats; sophisticated synthesis. |
Indicative Content:
Arguments supporting population growth as the greatest threat:
- The global population has grown from 2.5 billion in 1950 to over 8 billion in 2023, dramatically increasing demand for food, water, energy, and raw materials.
- Each additional person requires resources for food, shelter, clothing, and consumption, placing cumulative pressure on finite planetary resources.
- Rapid population growth in sub-Saharan Africa and South Asia is straining local water resources, agricultural land, and energy supplies.
- The IPAT equation (Impact = Population × Affluence × Technology) identifies population as a direct multiplier of environmental impact.
Arguments that other factors are greater threats:
- Overconsumption and affluence: The wealthiest 10% of the global population is responsible for approximately 50% of carbon emissions. A person in the USA consumes far more resources than a person in Niger, suggesting that consumption patterns matter more than raw population numbers.
- Inefficient resource use and waste: Approximately one-third of all food produced globally is wasted. Industrial processes are often resource-inefficient, and planned obsolescence in consumer goods accelerates resource depletion.
- Political and economic systems: Capitalism's growth imperative, lack of environmental regulation, and subsidies for fossil fuels drive unsustainable resource extraction regardless of population size. Corruption and weak governance in some countries lead to illegal logging, mining, and overfishing.
- Technological choices: The type of technology used matters — a large population using renewable energy and circular economy principles may have a smaller footprint than a small population dependent on fossil fuels and linear consumption.
Synthesis/Conclusion:
Population growth is a significant threat to resource sustainability, particularly in regions where it outpaces resource availability and institutional capacity. However, it is not the sole or necessarily the greatest threat. The interaction between population, consumption patterns, technology, and governance determines overall impact. Addressing resource sustainability requires tackling overconsumption in wealthy nations, improving resource efficiency, and strengthening governance alongside managing population growth through education, healthcare, and voluntary family planning.
END OF ANSWER KEY
Free quiz and exam paper access
Enter your details to view this paper
Your access is remembered on this device.