AI Generated Exam Paper
A Level H2 Geography Practice Paper 2
Free A Level H2 Geography Practice Paper 2, LongCat AI version, with questions, answers, and A Level-style practice for Singapore students.
These static practice materials are generated from the site's syllabus and paper-generation workflow, with source and model context shown so students and parents can evaluate the material before use.
Questions
TuitionGoWhere Practice Paper - Geography H2 A-Level
TuitionGoWhere Practice Paper (AI)
Subject: Geography
Level: A-Level H2 (9173)
Paper: Practice Paper — Resources & Sustainability
Version: 2 of 5
Duration: 1 hour 30 minutes
Total Marks: 60
Name: ___________________________
Class: ___________________________
Date: ___________________________
Instructions
- Answer all questions in Section A and Section B.
- Write your answers in the spaces provided.
- The number of marks for each question or part-question is shown in brackets [ ].
- Quality of written communication will be assessed in questions marked with an asterisk (*).
- You may use a calculator where appropriate.
Section A: Source-Based Questions (30 marks)
Answer all questions in this section.
Question 1
Resource 1 shows the global Ecological Footprint per capita (in global hectares, gha) for selected countries in 2022.
| Country | Biocapacity per capita (gha) | Ecological Footprint per capita (gha) | Ecological Reserve/Deficit (gha) |
|---|---|---|---|
| Qatar | 1.2 | 8.5 | −7.3 |
| USA | 3.7 | 8.1 | −4.4 |
| Brazil | 8.9 | 2.8 | +6.1 |
| Japan | 0.6 | 4.7 | −4.1 |
| India | 0.5 | 1.2 | −0.7 |
| Australia | 12.6 | 6.7 | +5.9 |
| Germany | 1.7 | 4.7 | −3.0 |
| Kenya | 0.5 | 0.9 | −0.4 |
Resource 1: Ecological footprint data for selected countries, 2022
(a) Define the term ecological footprint. [2]
(b) Using Resource 1, compare the ecological reserve/deficit patterns between the most developed and least developed countries shown. [4]
(c) Explain why countries with a large ecological deficit may face challenges in achieving resource sustainability. [4]
Question 2
Resource 2 is an extract from a report on water stress in Southeast Asia.
"By 2030, four ASEAN nations are projected to face 'extreme water stress' according to the Aqueduct Water Risk Index. Singapore, despite being one of the most water-stressed nations globally, has invested heavily in NEWater (recycled water) and desalination to reduce dependence on imported water from Johor, Malaysia. Thailand's agricultural sector accounts for 85% of national water withdrawals, yet irrigation efficiency remains below 40%. Meanwhile, Vietnam's Mekong Delta faces saltwater intrusion due to upstream dam construction and sea-level rise, threatening rice production for 17 million people."
Resource 2: Extract on water stress in Southeast Asia
(a) Using Resource 2, identify two different approaches to managing water scarcity mentioned in the extract. [2]
(i) _________________________________________________________________________
(ii) ________________________________________________________________________
(b) Using Resource 2 and your own knowledge, explain how both physical and human factors contribute to water stress in the Mekong Delta. [5]
(c) Assess the extent to which technological solutions alone can ensure water sustainability in Southeast Asian countries. [7]
Question 3
Resource 3 shows the change in installed solar photovoltaic (PV) capacity (in gigawatts, GW) for selected countries between 2015 and 2022.
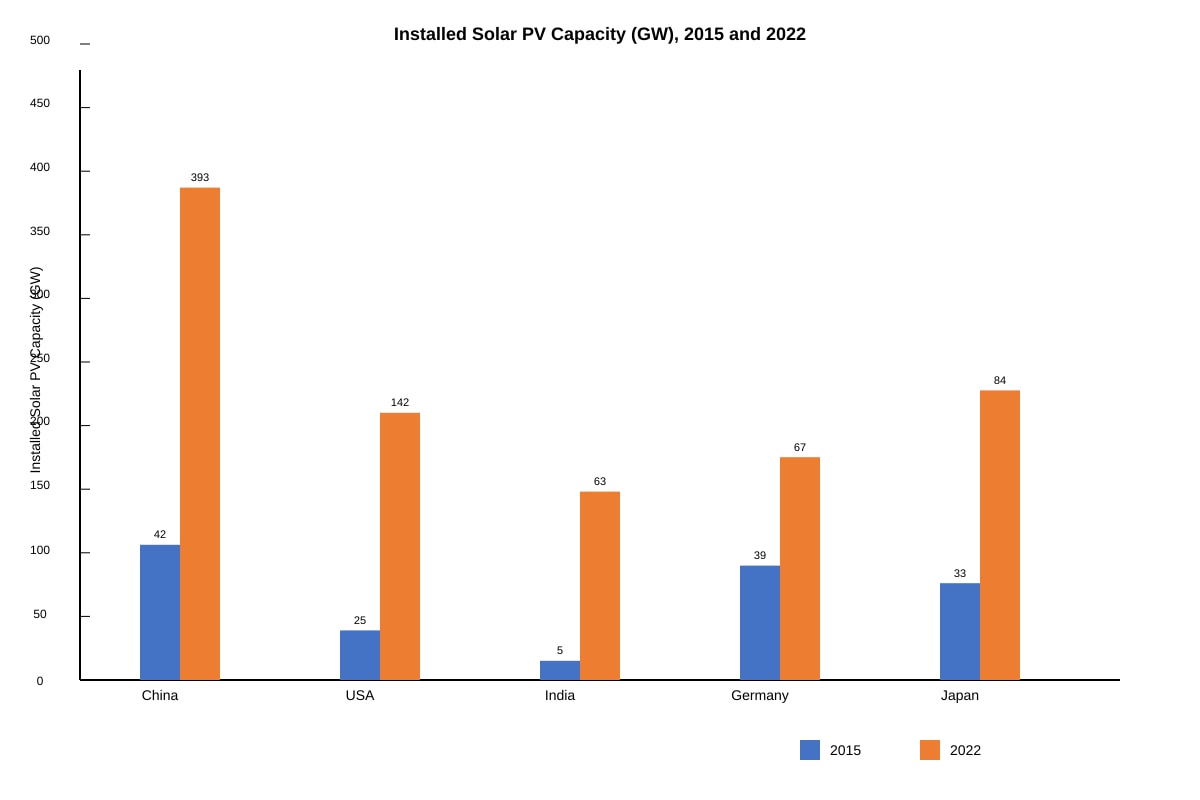
Generated chart for Q3.
Resource 3: Installed solar PV capacity for selected countries, 2015 and 2022
(a) Describe the trend in installed solar PV capacity for China between 2015 and 2022. Support your answer with data from Resource 3. [3]
(b) Suggest two reasons for the rapid growth in solar PV capacity shown in Resource 3. [4]
(i) _________________________________________________________________________
(ii) ________________________________________________________________________
(c) Explain why some countries with high solar PV capacity may still struggle to transition fully away from fossil fuels. [5]
Section B: Structured and Extended Response Questions (30 marks)
Answer two questions from this section. Answer each question on a new page.
Question 4
(a) Explain the concept of the tragedy of the commons and how it relates to resource depletion. [6]
(b) "Government regulation is more effective than market-based approaches in achieving resource sustainability." How far do you agree with this statement? Use examples to support your answer. [12]
Question 5
(a) Describe the characteristics of a circular economy and explain how it differs from a traditional linear economy. [6]
(b) Evaluate the effectiveness of international agreements in addressing global resource sustainability. [12]
Question 6
(a) Explain how population growth and rising consumption levels place pressure on finite natural resources. [6]
(b) "Achieving food sustainability is more challenging than achieving energy sustainability." To what extent do you agree? [12]
End of Practice Paper
Section A Total: 30 marks | Section B Total: 30 marks | Overall Total: 60 marks
Answers
TuitionGoWhere Practice Paper — Geography H2 A-Level
Answer Key & Marking Scheme
Paper: Practice Paper — Resources & Sustainability | Version: 2 of 5
Section A: Source-Based Questions (30 marks)
Question 1
(a) Define the term ecological footprint. [2]
Answer:
The ecological footprint is a measure of the amount of biologically productive land and water area required to produce the resources a population consumes and to absorb its waste, particularly carbon emissions, using prevailing technology. It is typically measured in global hectares (gha) per capita.
Marking scheme:
- [1] for a partial definition that captures the idea of resource demand or land/water area needed.
- [2] for a complete definition that includes both resource consumption and waste absorption, with reference to a unit of measurement (global hectares).
Common mistakes:
- Confusing ecological footprint with biocapacity (which is the supply side — the productive area available).
- Omitting the waste absorption / carbon emissions component.
(b) Using Resource 1, compare the ecological reserve/deficit patterns between the most developed and least developed countries shown. [4]
Answer:
The most developed countries (Qatar, USA, Japan, Germany) all show ecological deficits, meaning their ecological footprints exceed their biocapacity. Qatar has the largest deficit at −7.3 gha, followed by the USA (−4.4 gha), Japan (−4.1 gha), and Germany (−3.0 gha). In contrast, the least developed countries shown — India and Kenya — also have deficits but these are much smaller (−0.7 gha and −0.4 gha respectively). Brazil and Australia, which are resource-rich, are the only countries showing ecological reserves (+6.1 gha and +5.9 gha respectively). Overall, higher-income countries tend to have larger ecological deficits, reflecting higher per capita consumption levels, while lower-income countries have smaller deficits due to lower consumption, though they may still overshoot their biocapacity.
Marking scheme:
- [1] Identifies that developed countries have ecological deficits.
- [1] Identifies that less developed countries have smaller deficits (or reserves in the case of Brazil/Australia).
- [1] Uses specific data from Resource 1 to support the comparison (at least two figures).
- [1] Provides a clear comparative statement linking development level to deficit/reserve pattern.
Common mistakes:
- Simply listing figures without comparative language ("higher than," "in contrast").
- Failing to distinguish between developed and less developed countries.
- Not referencing Brazil and Australia as ecological reserve countries.
(c) Explain why countries with a large ecological deficit may face challenges in achieving resource sustainability. [4]
Answer:
Countries with large ecological deficits consume resources faster than their own ecosystems can regenerate, meaning they must import resources from other countries or deplete global commons (e.g., oceans, atmosphere). This creates dependency on external sources, which may become unreliable due to geopolitical tensions, trade restrictions, or resource depletion elsewhere. Additionally, large deficits often reflect high levels of carbon emissions and waste generation, contributing to global environmental problems such as climate change and biodiversity loss, which in turn undermine the ecological systems these countries depend on. The economic costs of importing resources or mitigating environmental damage can also strain national budgets, making long-term sustainability planning more difficult.
Marking scheme:
- [1] for explaining that deficits mean consumption exceeds domestic biocapacity.
- [1] for explaining dependency on imports / external resources.
- [1] for linking deficits to global environmental degradation (climate change, biodiversity loss).
- [1] for explaining economic or geopolitical challenges that arise.
Note: Answers should demonstrate cause-effect reasoning, not just restate the data.
Question 2
(a) Using Resource 2, identify two different approaches to managing water scarcity mentioned in the extract. [2]
Answer:
(i) Water recycling / reclamation (NEWater in Singapore).
(ii) Desalination (Singapore's investment in desalination plants).
Alternative acceptable answers:
- Reducing dependence on imported water (diversification of supply).
- Improving irrigation efficiency (implied as a needed measure in Thailand).
Marking scheme:
- [1] per valid approach correctly identified from Resource 2, up to [2].
(b) Using Resource 2 and your own knowledge, explain how both physical and human factors contribute to water stress in the Mekong Delta. [5]
Answer:
Physical factors: Sea-level rise, driven by climate change, causes saltwater intrusion into the freshwater systems of the Mekong Delta, contaminating agricultural land and freshwater supplies. Reduced upstream flow during dry seasons also concentrates salinity. The low-lying, flat topography of the delta makes it naturally vulnerable to flooding and saltwater ingress.
Human factors: Upstream dam construction (e.g., by China and Laos on the Mekong River) reduces the volume of freshwater flowing downstream, diminishing the river's ability to push back saltwater. Intensive rice farming in the delta requires large volumes of freshwater for irrigation, further depleting available supplies. Rapid population growth in the region increases domestic water demand. Poor water management and lack of infrastructure for water storage exacerbate the problem.
Marking scheme:
- Up to [3] for explaining physical factors (sea-level rise, saltwater intrusion, topography, reduced flow).
- Up to [3] for explaining human factors (dam construction, agricultural demand, population growth, poor management).
- Maximum [5] — answers must address both physical and human factors for full marks.
- [1] reserved for effective use of Resource 2 evidence.
Common mistakes:
- Discussing only physical or only human factors.
- Generic answers not specific to the Mekong Delta context.
(c) Assess the extent to which technological solutions alone can ensure water sustainability in Southeast Asian countries. [7]
Answer:
Technological solutions such as NEWater (recycled water), desalination, and improved irrigation systems can significantly contribute to water sustainability. Singapore's NEWater now meets up to 40% of national water demand, demonstrating that technology can substantially reduce dependence on imports. Desalination provides a climate-independent water source, and drip irrigation can dramatically improve agricultural water efficiency.
However, technology alone is insufficient. Desalination is energy-intensive and expensive, making it inaccessible for lower-income nations like Cambodia or Myanmar. NEWater requires significant capital investment and advanced infrastructure. Technological solutions do not address the root causes of water stress, such as population growth, over-extraction, pollution, and poor governance. Without effective water pricing policies, demand management, pollution control, and international cooperation on transboundary water resources (e.g., Mekong River Commission), technology merely treats symptoms rather than causes. Furthermore, maintenance and operational costs can be prohibitive for developing nations.
In conclusion, technology is a necessary but not sufficient condition for water sustainability. It must be integrated with policy measures, demand management, and regional cooperation to be truly effective.
Marking scheme (Level Marking):
| Level | Marks | Descriptors |
|---|---|---|
| Level 3 | 6–7 | Balanced assessment with clear evaluation of both the effectiveness and limitations of technology. Uses specific examples. Reaches a substantiated conclusion. |
| Level 2 | 4–5 | Explains how technology helps and/or its limitations, but evaluation may be one-sided or lack a clear conclusion. Some examples used. |
| Level 1 | 1–3 | Describes technological solutions with little or no evaluation. Generic or limited examples. |
Common mistakes:
- One-sided argument (only benefits or only limitations).
- No conclusion or evaluative judgment.
- Vague examples not linked to Southeast Asia.
Question 3
(a) Describe the trend in installed solar PV capacity for China between 2015 and 2022. Support your answer with data from Resource 3. [3]
Answer:
China's installed solar PV capacity increased dramatically from 42 GW in 2015 to 393 GW in 2022, representing approximately an eight-fold increase (or a growth of 351 GW) over the seven-year period. This far exceeds the growth seen in any other country shown in Resource 3, and by 2022 China's installed capacity was nearly three times that of the second-highest country (USA at 142 GW).
Marking scheme:
- [1] for identifying the increase/growth trend.
- [1] for using specific data from Resource 3 (both 2015 and 2022 figures).
- [1] for providing a comparative or quantitative statement about the magnitude of growth.
(b) Suggest two reasons for the rapid growth in solar PV capacity shown in Resource 3. [4]
Answer:
(i) Government subsidies and policy support: Many governments have introduced feed-in tariffs, tax incentives, and renewable energy targets that make solar PV installations financially attractive. China's 14th Five-Year Plan, for example, set ambitious renewable energy targets and provided substantial state funding for solar manufacturing and deployment.
(ii) Declining costs of solar technology: The cost of solar PV modules has fallen by over 80% since 2010 due to economies of scale, technological improvements, and increased manufacturing efficiency (particularly in China). This has made solar energy cost-competitive with fossil fuels in many markets, driving adoption.
Alternative acceptable reasons:
- Growing public awareness and demand for clean energy.
- International climate agreements (e.g., Paris Agreement) creating pressure to decarbonise.
- Energy security concerns reducing dependence on imported fossil fuels.
- Corporate procurement of renewable energy (e.g., tech companies committing to 100% renewable energy).
Marking scheme:
- [2] per reason: [1] for identifying a valid reason, [1] for explaining how/why it drives solar PV growth.
(c) Explain why some countries with high solar PV capacity may still struggle to transition fully away from fossil fuels. [5]
Answer:
Despite high solar PV capacity, several barriers prevent a full transition away from fossil fuels. First, solar energy is intermittent — it only generates electricity during daylight hours and output varies with weather conditions. Without adequate energy storage (batteries) or grid flexibility, countries must maintain fossil fuel plants as backup, especially during peak demand periods or cloudy days. Second, existing energy infrastructure (power grids, transmission lines) was designed for centralised fossil fuel plants and may not be suited to distributed solar generation, requiring costly upgrades. Third, some industrial processes (e.g., steel, cement, aviation) cannot easily be electrified and still rely on fossil fuels. Fourth, political and economic interests tied to fossil fuel industries can slow the transition through lobbying and resistance to policy change. Finally, the manufacturing of solar panels itself depends on energy-intensive processes and global supply chains that may rely on fossil fuels.
Marking scheme:
- [1] for intermittency / reliability issues.
- [1] for infrastructure / grid limitations.
- [1] for hard-to-decarbonise sectors.
- [1] for political/economic barriers.
- [1] for synthesising/explaining the interconnected nature of these barriers (or a fifth distinct valid point).
Common mistakes:
- Only discussing one barrier in depth without breadth.
- Not linking the explanation back to the specific context of countries with high solar PV capacity.
Section B: Structured and Extended Response Questions (30 marks)
Answer two questions from this section.
Question 4
(a) Explain the concept of the tragedy of the commons and how it relates to resource depletion. [6]
Answer:
The tragedy of the commons, a concept popularised by Garrett Hardin (1968), describes a situation where individuals, acting independently and rationally according to their own self-interest, behave contrary to the long-term best interests of the whole group by depleting or spoiling a shared resource. When a resource is held in common (e.g., oceans, atmosphere, grazing land), each user gains the full benefit of extracting or polluting, while the costs are shared among all users. This creates an incentive to overuse the resource, leading to its degradation or depletion.
This relates directly to resource depletion in several contexts: overfishing in international waters (where no single nation has ownership, leading to stock collapse), deforestation of communal forests, over-extraction of groundwater from shared aquifers, and carbon emissions into the atmosphere. In each case, individual actors benefit from exploitation but the cumulative effect is resource depletion that harms everyone.
Marking scheme:
- [2] for a clear explanation of the tragedy of the commons concept.
- [2] for explaining the mechanism (individual incentive vs. collective cost).
- [2] for applying the concept to specific examples of resource depletion.
(b) "Government regulation is more effective than market-based approaches in achieving resource sustainability." How far do you agree with this statement? Use examples to support your answer. [12]
Answer:
Government regulation can be highly effective: Command-and-control regulations, such as fishing quotas, emissions standards, and protected area designations, set clear legal limits that are enforceable. The Montreal Protocol (1987) successfully phased out ozone-depleting substances through binding international regulation. National parks and marine protected areas (e.g., Great Barrier Reef Marine Park) have conserved biodiversity through regulatory frameworks. Regulations can act quickly in crisis situations and ensure minimum standards are met.
However, regulation has limitations: It can be inflexible, costly to enforce, and may not account for local conditions. Regulations may also be subject to political lobbying and weakening (e.g., relaxed environmental standards under certain administrations). The EU's Common Fisheries Policy, while regulatory, has struggled with overfishing due to poor enforcement and political pressure to set quotas above scientific recommendations.
Market-based approaches also have strengths: Carbon pricing (e.g., EU Emissions Trading System) creates financial incentives for firms to reduce emissions efficiently. Tradeable fishing quotas (e.g., New Zealand's Quota Management System) have successfully managed fish stocks by giving fishers a financial stake in sustainability. Pollution taxes internalise externalities, making polluters pay for environmental damage.
Market-based approaches also have limitations: They may disproportionately affect low-income groups (regressive impact), require robust monitoring and enforcement, and can be undermined by lobbying for free permits or low carbon prices. Carbon leakage — where firms relocate to countries with weaker regulations — can undermine effectiveness.
In conclusion, neither approach is universally superior. The most effective strategies typically combine both: regulations set minimum standards and legal frameworks, while market-based mechanisms provide flexibility and economic incentives. For example, the Paris Agreement combines nationally determined contributions (regulatory pledges) with carbon market mechanisms. A hybrid approach is likely most effective for achieving resource sustainability.
Marking scheme (Level Marking):
| Level | Marks | Descriptors |
|---|---|---|
| Level 4 | 10–12 | Balanced, detailed evaluation of both government regulation and market-based approaches. Uses specific, well-developed examples. Clear, substantiated conclusion. Effective use of geographical terminology. |
| Level 3 | 7–9 | Explains both approaches with some evaluation. Examples present but may lack depth. Conclusion present but may be underdeveloped. |
| Level 2 | 4–6 | Describes one or both approaches with limited evaluation. Examples may be generic or lacking. Weak or no conclusion. |
| Level 1 | 1–3 | Basic description with little evaluation. Few or no examples. |
Question 5
(a) Describe the characteristics of a circular economy and explain how it differs from a traditional linear economy. [6]
Answer:
A circular economy is an economic system aimed at eliminating waste and maximising the continual use of resources. Its key characteristics include: (1) designing products for durability, reuse, and recyclability from the outset; (2) keeping materials in use for as long as possible through repair, refurbishment, and remanufacturing; (3) Regenerating natural systems by returning biological materials safely to the environment; and (4) using waste as a resource — one industry's output becomes another's input (industrial symbiosis).
In contrast, a traditional linear economy follows a "take-make-dispose" model: raw materials are extracted, manufactured into products, used, and then discarded as waste. This model assumes infinite resource availability and unlimited waste absorption capacity. The circular economy closes these loops, reducing the need for virgin resource extraction and minimising landfill and pollution.
For example, in a linear economy, a smartphone is manufactured, used for 2–3 years, and discarded. In a circular economy, the phone would be designed for easy disassembly, its components reused or recycled, and rare earth metals recovered.
Marking scheme:
- [2] for describing characteristics of a circular economy.
- [2] for describing the linear economy model.
- [2] for clearly explaining the difference between the two.
(b) Evaluate the effectiveness of international agreements in addressing global resource sustainability. [12]
Answer:
International agreements play a crucial role in addressing global resource sustainability because environmental challenges (climate change, biodiversity loss, ocean pollution) transcend national borders and require collective action.
Successes: The Montreal Protocol (1987) is widely regarded as the most successful international environmental agreement, having phased out 99% of ozone-depleting substances and put the ozone layer on a path to recovery. The Convention on International Trade in Endangered Species (CITES) has helped protect endangered species by regulating wildlife trade. The Paris Agreement (2015) achieved near-universal participation and established a framework for limiting global warming to 1.5–2°C, with countries submitting nationally determined contributions (NDCs).
Limitations: Many agreements lack binding enforcement mechanisms. The Paris Agreement relies on voluntary pledges, and current NDCs are collectively insufficient to meet the 1.5°C target. The Kyoto Protocol (1997) failed partly because major emitters (USA, Canada) did not ratify or withdrew. International agreements often reflect compromises that weaken ambition to secure participation. Developing nations may lack the capacity or finance to implement commitments, and technology transfer promises are often unfulfilled. Monitoring and verification are challenging, and compliance is difficult to enforce without sovereign authority.
Structural challenges: Free-rider problems mean some countries benefit from others' efforts without contributing equitably. Geopolitical tensions and competing economic priorities can undermine cooperation. Agreements may focus on single issues (e.g., climate) while ignoring interconnected challenges (e.g., biodiversity, water, land use).
In conclusion, international agreements are essential but insufficient on their own. Their effectiveness depends on binding commitments, adequate financing, technology transfer, and domestic implementation. The most successful agreements (Montreal Protocol) combined clear targets, financial mechanisms (Multilateral Fund), and universal participation. Future agreements must learn from these lessons.
Marking scheme (Level Marking):
| Level | Marks | Descriptors |
|---|---|---|
| Level 4 | 10–12 | Comprehensive evaluation with specific examples of both successful and unsuccessful agreements. Clear, well-substantiated conclusion. Sophisticated understanding of structural challenges. |
| Level 3 | 7–9 | Discusses both strengths and limitations with relevant examples. Conclusion present. |
| Level 2 | 4–6 | Describes international agreements with some evaluation but may be one-sided. Limited examples. |
| Level 1 | 1–3 | Basic description with little evaluation. Vague or no examples. |
Question 6
(a) Explain how population growth and rising consumption levels place pressure on finite natural resources. [6]
Answer:
Population growth increases the total demand for finite natural resources such as freshwater, arable land, fossil fuels, and minerals. With the global population projected to reach 9.7 billion by 2050, more people require food, water, energy, and housing, all of which depend on resource extraction. For example, feeding an additional 2 billion people will require an estimated 50% increase in agricultural output, placing enormous pressure on land, water, and soil resources.
Rising consumption levels compound this pressure. As countries develop and incomes rise, per capita resource consumption increases disproportionately — a phenomenon described by the IPAT equation (Impact = Population × Affluence × Technology). For instance, the average American consumes approximately 30 times more resources than the average Indian. Rising middle-class consumption in China and India is driving demand for meat (which requires 5–10 times more resources to produce than grains), electronics (requiring rare earth minerals), and vehicles (requiring steel, plastics, and fossil fuels).
The combination of population growth and rising consumption creates a "double pressure" on finite resources. Non-renewable resources (fossil fuels, minerals) are being depleted faster than they form. Even renewable resources (forests, fisheries, freshwater) are being exploited faster than they can regenerate, leading to degradation. This is reflected in Earth Overshoot Day occurring earlier each year — in 2023 it fell on 2 August, meaning humanity used a year's worth of resources in just seven months.
Marking scheme:
- [2] for explaining the impact of population growth on resource demand.
- [2] for explaining the impact of rising consumption/affluence.
- [2] for synthesising how the two interact and providing specific examples.
(b) "Achieving food sustainability is more challenging than achieving energy sustainability." To what extent do you agree? [12]
Answer:
Food sustainability is highly challenging: Food production is fundamentally dependent on finite and degrading natural resources — soil, water, and biodiversity. Approximately 33% of global soils are degraded, and agriculture accounts for 70% of freshwater withdrawals. Climate change is reducing crop yields in many regions through heat stress, drought, and flooding. Food systems must also address distributional inequity — 828 million people face hunger while 30% of food is wasted globally. Dietary shifts toward meat-intensive diets in developing countries increase the environmental footprint of food. Unlike energy, food is a biological necessity with no substitute, and production is highly sensitive to local environmental conditions.
Energy sustainability also presents significant challenges: The global energy system is 80% dependent on fossil fuels, and transitioning requires massive infrastructure investment (estimated at $4–5 trillion annually). Energy storage, grid modernisation, and the intermittency of renewables remain technical challenges. Energy poverty affects 770 million people without electricity access. Hard-to-abate sectors (aviation, shipping, heavy industry) lack viable alternatives to fossil fuels.
However, food sustainability may be more challenging because: (1) Food production directly competes for land and water with nature and urbanisation, whereas energy can be generated from diverse sources including space-based (offshore wind, solar farms on non-arable land). (2) Dietary change requires altering deeply ingrained cultural and personal behaviours, whereas energy transitions can occur behind the scenes without changing consumer lifestyles. (3) Food systems are more vulnerable to climate change impacts than energy systems. (4) The energy transition has clear technological pathways (solar, wind, nuclear, hydrogen), whereas food sustainability requires systemic changes across supply chains, diets, and agricultural practices.
Counter-argument: Energy sustainability may be equally or more challenging because of the sheer scale of infrastructure replacement required, political resistance from powerful fossil fuel lobbies, and the need for baseload power that renewables alone cannot yet reliably provide.
In conclusion, while both food and energy sustainability are enormously challenging, food sustainability may be marginally more complex due to its direct dependence on degrading ecosystems, the need for behavioural change, and its vulnerability to climate change. However, the two are deeply interconnected (e.g., energy for fertiliser production, irrigation), and solutions must address both simultaneously.
Marking scheme (Level Marking):
| Level | Marks | Descriptors |
|---|---|---|
| Level 4 | 10–12 | Detailed, balanced evaluation comparing food and energy sustainability challenges. Uses specific evidence and examples. Clear, nuanced conclusion that acknowledges complexity. |
| Level 3 | 7–9 | Discusses challenges of both food and energy sustainability with some comparison. Examples present. Conclusion present. |
| Level 2 | 4–6 | Describes challenges of food and/or energy sustainability with limited comparison. May be one-sided. |
| Level 1 | 1–3 | Basic description with little comparative evaluation. |
End of Answer Key
Section A Total: 30 marks | Section B Total: 30 marks | Overall Total: 60 marks
Free quiz and exam paper access
Enter your details to view this paper
Your access is remembered on this device.