AI Generated Exam Paper
A Level H2 Geography Practice Paper 1
Free A Level H2 Geography Practice Paper 1, LongCat AI version, with questions, answers, and A Level-style practice for Singapore students.
These static practice materials are generated from the site's syllabus and paper-generation workflow, with source and model context shown so students and parents can evaluate the material before use.
Questions
TuitionGoWhere Practice Paper - Geography H2 A-Level
TuitionGoWhere Practice Paper (AI)
Subject: Geography (H2) Level: A-Level Paper: Practice Paper — Resources & Sustainability Version: 1 of 5 Duration: 1 hour 30 minutes Total Marks: 60
Name: ___________________________ Class: ___________________________ Date: ___________________________
Instructions
- Answer all questions in Section A and Section B.
- Read each question carefully and respond using relevant geographical terminology.
- Where data resources are referenced, study them closely before answering.
- For essay questions, ensure balanced argumentation with reference to specific examples and case studies.
- Quality of written communication will be assessed in extended response questions.
- The number of marks for each question or part-question is shown in brackets [ ].
Section A: Source-Based Questions (30 marks)
Answer all questions in this section. Refer to the resources provided.
Resource 1: Global Water Stress Index by Country (2023)
| Country | Water Stress Score (0–5) | Annual Renewable Water per Capita (m³) | % Population with Access to Safe Sanitation | Dependency on Desalination (%) |
|---|---|---|---|---|
| Singapore | 4.9 | 110 | 100 | 25 |
| Qatar | 4.8 | 25 | 99 | 70 |
| Israel | 4.7 | 90 | 96 | 45 |
| UAE | 4.9 | 15 | 98 | 80 |
| Netherlands | 1.2 | 5,500 | 100 | 0 |
| Brazil | 0.8 | 42,000 | 88 | 0 |
| Japan | 1.5 | 3,400 | 100 | 0 |
| India | 3.8 | 1,500 | 62 | 2 |
Water Stress Score: 0 = no stress; 5 = extremely high stress
Resource 2: Extract from a report on Singapore's water sustainability strategy
Singapore, a small island city-state with limited natural water resources, has developed a diversified water supply strategy known as the "Four National Taps": (1) local catchment water, (2) imported water from Johor, Malaysia, (3) NEWater (high-grade reclaimed water produced through advanced membrane and ultraviolet treatment), and (4) desalinated water. By 2060, NEWater and desalination are projected to meet up to 85% of total water demand. The Public Utilities Board (PUB) has invested over $5 billion in water infrastructure since 2000. Despite these efforts, Singapore remains vulnerable to prolonged drought and geopolitical risks associated with water imports. The country's water demand is projected to double by 2060 due to population and economic growth.
Resource 3: Graph of Global Renewable Energy Investment (2010–2023)
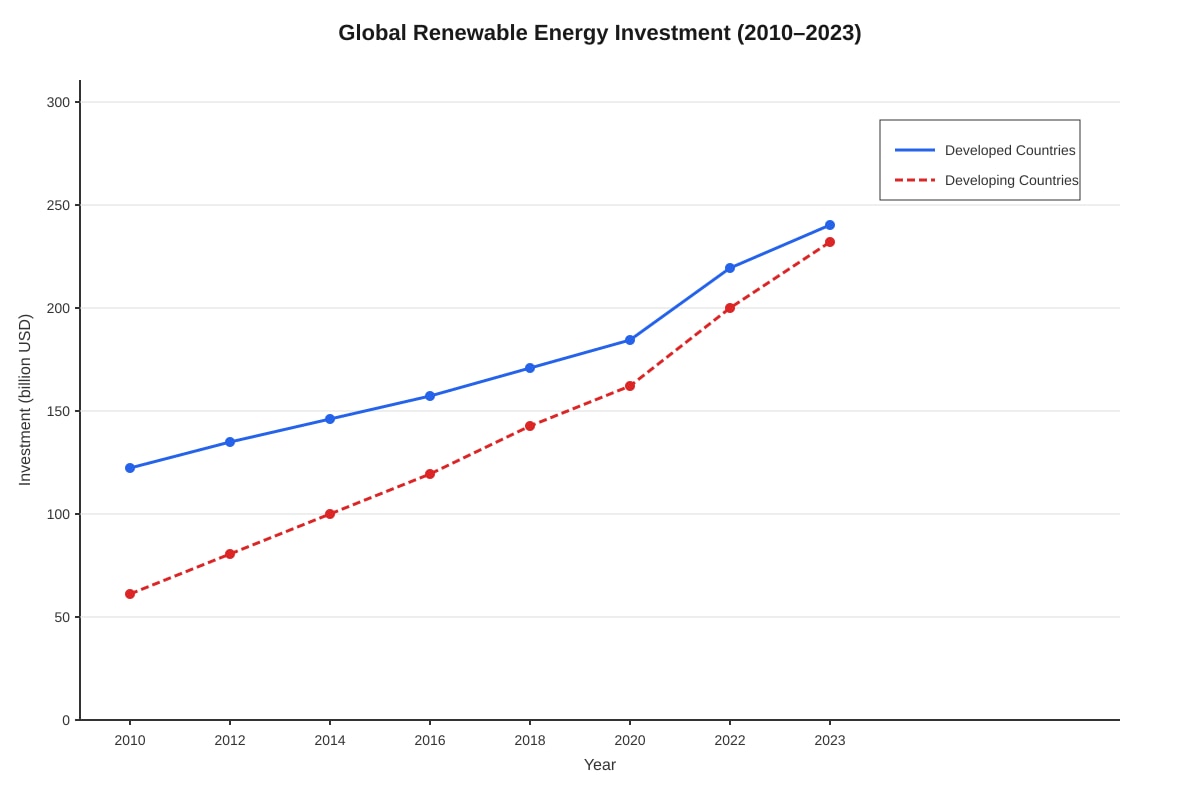
Generated graph for Q1.
Question 1
(a) Using Resource 1, compare the water stress scores and annual renewable water per capita for Singapore and the Netherlands. [4]
(b) Using Resource 2, explain two reasons why Singapore's water supply strategy can be considered sustainable. [4]
(c) Using Resource 3, describe the trends in global renewable energy investment from 2010 to 2023. Suggest two reasons for the trends shown. [6]
Resource 4: Extract on food security and resource depletion
The global food system faces unprecedented pressures. The UN Food and Agriculture Organization (FAO) estimates that food production must increase by 60% by 2050 to feed a projected population of 9.7 billion. However, arable land is declining at a rate of 10 million hectares per year due to urbanisation, desertification, and soil degradation. Groundwater aquifers, which supply 40% of global irrigation water, are being depleted faster than natural recharge rates. In India's Punjab region, water tables have fallen by over 1 metre per year since 2000. Meanwhile, the "green revolution" model of intensive agriculture, while boosting yields, has led to biodiversity loss, water pollution from agrochemical runoff, and increased greenhouse gas emissions. Some countries are turning to alternative strategies such as vertical farming, precision agriculture, and agroecology to achieve food security without further environmental degradation.
Resource 5: Table showing ecological footprint and biocapacity for selected countries (2022)
| Country | Ecological Footprint (gha/person) | Biocapacity (gha/person) | Ecological Deficit/Surplus (gha/person) | GDP per Capita (USD) |
|---|---|---|---|---|
| USA | 8.1 | 3.8 | −4.3 | 76,000 |
| Germany | 4.7 | 2.2 | −2.5 | 51,000 |
| China | 3.7 | 1.0 | −2.7 | 12,700 |
| Brazil | 2.8 | 8.9 | +6.1 | 8,900 |
| India | 1.2 | 0.5 | −0.7 | 2,400 |
| Kenya | 1.0 | 0.6 | −0.4 | 2,100 |
| Finland | 5.3 | 12.5 | +7.2 | 54,000 |
| World Average | 2.8 | 1.6 | −1.2 | 12,200 |
gha = global hectares
Question 2
(a) Using Resource 4, identify two challenges to achieving global food security and explain how each challenge threatens resource sustainability. [6]
(b) Using Resource 5, analyse the relationship between GDP per capita and ecological deficit. To what extent does the data support the view that economic development inevitably leads to unsustainable resource use? [8]
Section B: Structured and Extended Response Questions (30 marks)
Answer all questions in this section.
Question 3
(a) Define the term "sustainable development" and explain why it is considered a contested concept. [4]
(b) Explain how the concept of the "tragedy of the commons" relates to resource depletion. Use one specific example to illustrate your answer. [6]
Question 4
"Technological innovation alone cannot achieve resource sustainability. Governance and behavioural change are equally important."
How far do you agree with this statement? Refer to specific examples in your answer. [10]
Question 5
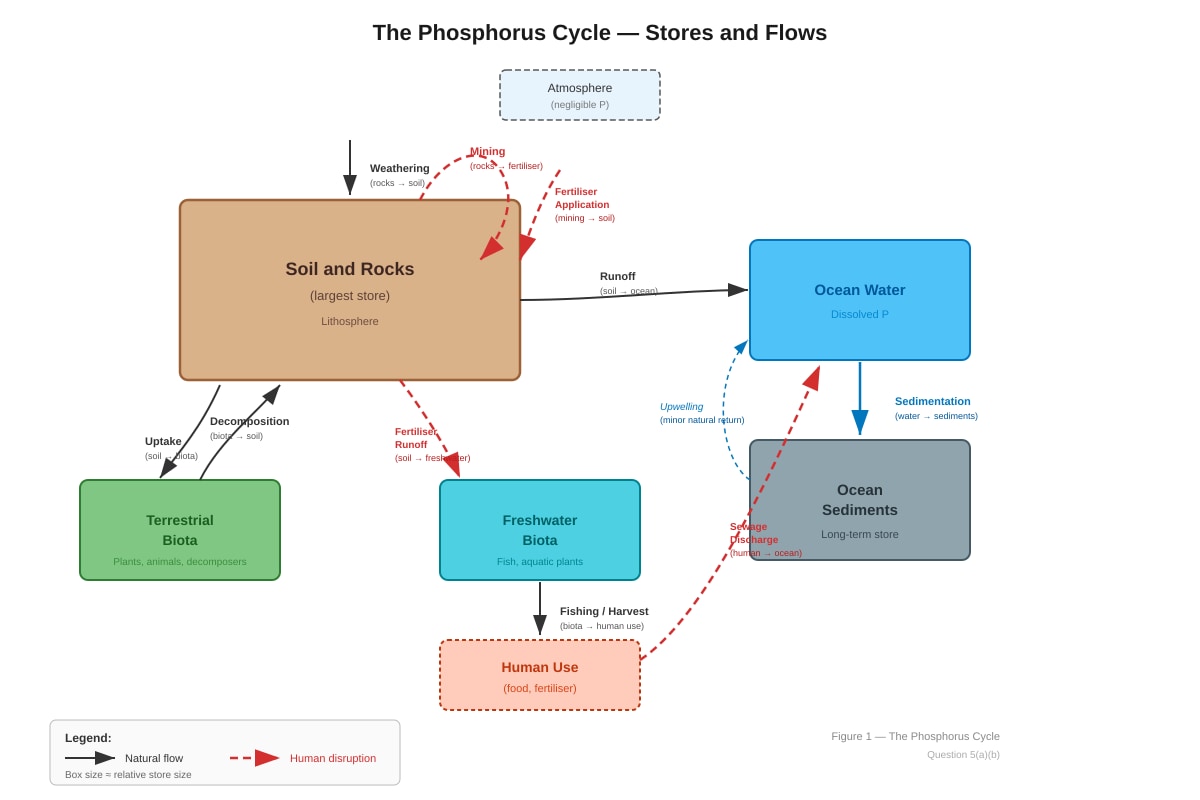
Generated diagram for Q5.
(a) Using the diagram above, describe the natural pathways of phosphorus through the cycle. [4]
(b) Explain how human activities have disrupted the phosphorus cycle. Assess whether these disruptions can be managed sustainably. [6]
Answers
TuitionGoWhere Practice Paper — Geography H2 A-Level
Answer Key: Resources & Sustainability (Version 1 of 5)
Section A: Source-Based Questions
Question 1(a) [4 marks]
Compare the water stress scores and annual renewable water per capita for Singapore and the Netherlands.
Answer:
Both Singapore and the Netherlands have very different water resource profiles despite both being highly developed, densely populated countries.
-
Water stress score: Singapore has an extremely high water stress score of 4.9 out of 5, indicating near-maximum water stress. In contrast, the Netherlands has a very low water stress score of 1.2, indicating minimal stress on water resources. The difference is 3.7 points on the scale.
-
Annual renewable water per capita: Singapore has only 110 m³ per person per year, which is extremely low — well below the 1,700 m³ threshold commonly used to define water stress. The Netherlands has 5,500 m³ per capita, which is substantially higher and above the water stress threshold.
-
Comparison: Singapore's water stress score is approximately 4 times higher than the Netherlands', while the Netherlands' renewable water per capita is approximately 50 times greater than Singapore's. This stark contrast reflects Singapore's physical constraints as a small island with limited catchment area and no major rivers or aquifers, compared to the Netherlands' access to the Rhine and Meuse river systems and significant groundwater reserves.
Marking scheme:
- 2 marks: Valid comparison of water stress scores with data from Resource 1
- 2 marks: Valid comparison of renewable water per capita with data from Resource 1
- Award credit for comparative language ("higher," "lower," "whereas," "in contrast")
Common mistakes:
- Simply restating the raw figures without making a direct comparison
- Failing to reference both variables (water stress AND renewable water per capita)
Question 1(b) [4 marks]
Explain two reasons why Singapore's water supply strategy can be considered sustainable.
Answer:
Reason 1: Diversification of supply sources reduces vulnerability. Singapore's "Four National Taps" strategy means the country does not rely on any single source. By combining local catchment, imported water, NEWater, and desalination, Singapore reduces the risk of supply disruption from any one source. For example, if imported water from Malaysia were disrupted by diplomatic tensions or drought, NEWater and desalination can compensate. This diversification enhances long-term supply security, which is a key pillar of sustainability.
Reason 2: NEWater represents a closed-loop, renewable approach to water supply. NEWater is produced by treating used water through advanced membrane technology and ultraviolet disinfection. This effectively recycles water that would otherwise be wasted, creating a sustainable loop. As Resource 2 states, NEWater and desalination are projected to meet 85% of demand by 2060, reducing dependence on finite imported supplies. This closed-loop system aligns with the sustainability principle of meeting present needs without compromising future availability.
Marking scheme:
- 2 marks per reason (1 for identifying the reason, 1 for explaining how it relates to sustainability)
- Answers must reference Resource 2 and connect to the concept of sustainability
Question 1(c) [6 marks]
Describe the trends in global renewable energy investment from 2010 to 2023. Suggest two reasons for the trends shown.
Answer:
Description of trends [3 marks]:
- Global renewable energy investment has increased significantly between 2010 and 2023 for both developed and developing countries.
- Developed countries' investment rose from approximately 120billionin2010to290 billion in 2023 — more than doubling over the period.
- Developing countries' investment grew from approximately 50billionin2010to270 billion in 2023 — more than a fivefold increase.
- Both lines show a broadly consistent upward trend, with a notable acceleration after 2018–2020.
- The gap between developed and developing country investment has narrowed over time, with developing countries converging toward developed country levels (from a 70billiongapin2010toapproximatelya20 billion gap in 2023).
Reasons for the trends [3 marks — 1.5 per reason, or 1 mark each for identification + 0.5 for development]:
Reason 1: Declining costs of renewable energy technology. The cost of solar photovoltaic panels has fallen by over 90% since 2010, and wind turbine costs have also dropped significantly. This makes renewable energy increasingly cost-competitive with fossil fuels, attracting greater investment from both public and private sectors.
Reason 2: International climate policy and national commitments. The Paris Agreement (2015) and subsequent COP commitments have set targets for reducing greenhouse gas emissions, prompting governments to incentivise renewable energy through subsidies, feed-in tariffs, and carbon pricing mechanisms. This policy environment has stimulated investment, particularly in developing countries seeking to leapfrog fossil fuel-dependent development pathways.
Marking scheme:
- Description: up to 3 marks for accurate trend description with data references
- Reasons: up to 3 marks (1.5 each) for plausible, well-explained reasons
Question 2(a) [6 marks]
Identify two challenges to achieving global food security and explain how each challenge threatens resource sustainability.
Answer:
Challenge 1: Declining arable land (2 marks for identification + explanation) Resource 4 states that arable land is declining at 10 million hectares per year due to urbanisation, desertification, and soil degradation. This threatens resource sustainability because as cities expand and soils degrade, the productive capacity of the land base shrinks. With the FAO projecting a need for 60% more food by 2050, the shrinking land area creates a fundamental supply-demand imbalance. Soil degradation also reduces the long-term fertility and carbon-storage capacity of ecosystems, creating a negative feedback loop where degraded land produces less food, prompting further land conversion elsewhere.
Challenge 2: Groundwater depletion (2 marks for identification + explanation) Resource 4 highlights that groundwater aquifers supplying 40% of global irrigation are being depleted faster than recharge rates, with Punjab's water tables falling over 1 metre per year. This is unsustainable because groundwater is essentially a non-renewable resource on human timescales — deep aquifers take thousands of years to recharge. Once depleted, irrigated agriculture in these regions becomes impossible, threatening food production for hundreds of millions of people. The over-extraction also causes land subsidence and saltwater intrusion in coastal areas, further degrading the resource base.
Marking scheme:
- 1 mark per challenge correctly identified from Resource 4
- 2 marks per challenge for a developed explanation linking the challenge to resource sustainability
- Maximum 6 marks
Common mistakes:
- Listing challenges without explaining the sustainability threat
- Using generic knowledge without referencing Resource 4
Question 2(b) [8 marks]
Analyse the relationship between GDP per capita and ecological deficit. To what extent does the data support the view that economic development inevitably leads to unsustainable resource use?
Answer:
Analysis of the relationship [4 marks]:
The data in Resource 5 shows a general positive correlation between GDP per capita and ecological deficit, but the relationship is not perfectly linear or inevitable.
-
Supporting the relationship: The USA (GDP 76,000,deficit−4.3gha/person)andGermany(GDP51,000, deficit −2.5 gha/person) both show large ecological deficits, suggesting that high-income countries consume far more than their biocapacity can support. China, with a moderate GDP of $12,700, already has a deficit of −2.7 gha/person — larger than Germany's in absolute terms — indicating that rapid industrialisation drives resource overconsumption.
-
Challenging the relationship: However, the data complicates a simple narrative. Finland has a high GDP ($54,000) but a large ecological surplus of +7.2 gha/person, due to its vast forest resources and relatively low population density. This shows that high-income countries are not inevitably unsustainable — natural endowments and resource management matter. Similarly, India and Kenya have small ecological deficits (−0.7 and −0.4 respectively) despite low GDP, but this partly reflects lower consumption levels rather than sustainable practices.
Evaluation — "To what extent" [4 marks]:
The data partially supports the view that economic development leads to unsustainable resource use, but it is not inevitable.
-
Evidence supporting inevitability: The Environmental Kuznets Curve (EKC) hypothesis suggests that environmental degradation initially increases with income before eventually declining. The USA and Germany data fits the early stage of this curve. China's trajectory also supports this — rapid growth has created enormous resource demands.
-
Evidence against inevitability: Finland demonstrates that high-income countries can maintain ecological surpluses through abundant natural resources and effective environmental governance. Additionally, some high-income countries have begun "decoupling" GDP growth from resource consumption through circular economy policies, renewable energy transitions, and efficiency gains.
-
Nuance: The relationship is mediated by factors including: natural resource endowments, population density, governance quality, technology, and consumption patterns. Economic development creates both the pressure (higher consumption) and the capacity (technology, governance, financial resources) for sustainability. Therefore, development does not inevitably lead to unsustainability, but without deliberate policy intervention, the default trajectory tends toward ecological deficit.
Marking scheme:
- Up to 4 marks: Analysis of the data with specific country references from Resource 5
- Up to 4 marks: Evaluative discussion with a clear conclusion, use of geographical concepts (EKC, decoupling), and balanced argumentation
- L1 (1–3 marks): Descriptive, limited data reference, no evaluation
- L2 (4–6 marks): Some analysis and attempt at evaluation
- L3 (7–8 marks): Thorough data analysis with clear, well-supported evaluative conclusion
Section B: Structured and Extended Response Questions
Question 3(a) [4 marks]
Define the term "sustainable development" and explain why it is considered a contested concept.
Answer:
Definition [1 mark]: Sustainable development is development that meets the needs of the present without compromising the ability of future generations to meet their own needs (Brundtland Commission, 1987).
Why it is contested [3 marks]:
-
Different interpretations of "needs": What constitutes a "need" varies between developed and developing countries. Developing nations may prioritise economic growth and poverty alleviation, while developed nations may emphasise environmental conservation. This creates tension over whose needs take priority.
-
Weak vs. strong sustainability: Weak sustainability (associated with neoclassical economics) assumes that natural capital and human-made capital are substitutable — technology can replace lost resources. Strong sustainability argues that certain natural capital (e.g., biodiversity, ozone layer) is critical and irreplaceable. These fundamentally different positions lead to different policy prescriptions.
-
Temporal and spatial trade-offs: Sustainability decisions involve trade-offs between short-term economic gains and long-term environmental health, and between local development and global environmental impacts. For example, a country may achieve domestic sustainability by importing resources, effectively exporting environmental degradation elsewhere (ecological footprint displacement).
Marking scheme:
- 1 mark for accurate definition
- 3 marks for explaining contested nature (1 mark per valid point, well-developed)
Question 3(b) [6 marks]
Explain how the concept of the "tragedy of the commons" relates to resource depletion. Use one specific example to illustrate your answer.
Answer:
Explanation of the concept [3 marks]: The tragedy of the commons, coined by Garrett Hardin (1968), describes a situation where individuals, acting independently and rationally according to their own self-interest, ultimately deplete a shared limited resource, even when it is contrary to the group's long-term best interests. Each user receives the full benefit of extracting more of the resource, but the cost of depletion is shared among all users. This creates an incentive to over-extract, leading to progressive degradation and eventual collapse of the common resource.
Example: Overfishing in the North Atlantic [3 marks]: The North Atlantic cod fisheries off Newfoundland, Canada, provide a clear example. For centuries, the Grand Banks were among the world's most productive fishing grounds. However, from the 1960s onwards, industrial fishing fleets from multiple nations exploited the stocks. Each fishing company had an economic incentive to catch as many fish as possible before competitors did. Despite scientific warnings about declining stocks, no single actor had the incentive to reduce their catch unilaterally. By 1992, cod stocks had collapsed to less than 1% of their historical levels, and the Canadian government declared a moratorium on cod fishing. The collapse devastated coastal communities that had depended on fishing for generations, with 40,000 people losing their livelihoods. This illustrates how rational individual behaviour leads to collective resource destruction when governance mechanisms are absent or inadequate.
Marking scheme:
- Up to 3 marks for clear explanation of the tragedy of the commons concept
- Up to 3 marks for a specific, well-explained example that clearly links to the concept
- Alternative acceptable examples: deforestation of the Amazon, groundwater depletion, atmospheric carbon emissions, overgrazing of common pastureland
Question 4 [10 marks]
"Technological innovation alone cannot achieve resource sustainability. Governance and behavioural change are equally important." How far do you agree with this statement? Refer to specific examples in your answer.
Answer:
Introduction [1–2 marks]: Define resource sustainability (the management of natural resources to meet current needs without compromising future availability). Acknowledge that technological innovation, governance, and behavioural change are all relevant factors, but the question asks whether technology alone is sufficient.
Body — Arguments agreeing that technology alone is insufficient [4–5 marks]:
Point 1: Governance is essential to direct and regulate resource use. Technology can provide solutions, but without governance frameworks, these solutions may not be adopted or may be misused. For example, desalination technology can address water scarcity, but without government regulation and pricing policies, it may encourage wasteful water consumption. Singapore's PUB provides a strong example — the technology for NEWater exists, but it is government investment, long-term planning, and public education campaigns that have made it viable and socially acceptable. Similarly, renewable energy technologies (solar, wind) require government subsidies, feed-in tariffs, and grid infrastructure investment to scale effectively.
Point 2: Behavioural change is necessary because technology cannot address overconsumption. Even the most efficient technologies can be overwhelmed by rising consumption — this is known as the Jevons Paradox or rebound effect. For example, more fuel-efficient vehicles may lead people to drive more, negating the efficiency gains. In food systems, precision agriculture can reduce waste, but if consumer demand for resource-intensive products (e.g., beef) continues to grow, the net environmental impact may still increase. Behavioural changes — such as reducing meat consumption, minimising food waste, and choosing sustainable products — are necessary complements to technological solutions.
Point 3: Governance addresses equity and distributional issues. Resource sustainability is not just a technical challenge but a social one. Governance ensures that the costs and benefits of sustainability transitions are distributed fairly. For example, carbon taxes must be designed to avoid disproportionately burdening low-income households. International governance (e.g., the Paris Agreement) is needed because resource challenges are transboundary.
Body — Arguments that technology plays a critical role [2–3 marks]:
Counterpoint: Technology can fundamentally transform resource efficiency. Some technological breakthroughs have dramatically reduced resource intensity. The Haber-Bosch process for synthetic fertiliser arguably enabled the feeding of billions. Solar PV costs have fallen 90%+ since 2010, making renewables competitive without subsidies in many markets. In some cases, technology can overcome governance failures — for example, drip irrigation technology can reduce water use even in the absence of water pricing reform.
Counterpoint: Technology can enable monitoring and enforcement of governance. Remote sensing, GIS, and satellite monitoring technologies enable governments to detect illegal deforestation, monitor fishing vessels, and track pollution in real time. These technologies enhance governance capacity.
Conclusion [1–2 marks]: Technology is a necessary but not sufficient condition for resource sustainability. Without governance to create the right incentives and regulations, and without behavioural change to reduce demand and ensure social acceptance, technological solutions will be underutilised, misdirected, or overwhelmed by rising consumption. The most effective approaches integrate all three — for example, Denmark's wind energy success combined technological R&D, government policy (subsidies, targets), and strong public support for renewable energy. Therefore, I largely agree with the statement.
Marking scheme:
| Level | Marks | Descriptors |
|---|---|---|
| L1 | 1–3 | Descriptive, limited examples, no clear argument or evaluation |
| L2 | 4–6 | Some argument with examples, limited evaluation, unbalanced |
| L3 | 7–8 | Well-structured argument with specific examples, some evaluation |
| L4 | 9–10 | Comprehensive, balanced argument with specific examples, clear evaluation and conclusion, effective use of geographical terminology |
Question 5(a) [4 marks]
Using the diagram, describe the natural pathways of phosphorus through the cycle.
Answer:
Phosphorus cycles through the environment primarily through geological and biological pathways (there is no significant atmospheric pathway, unlike carbon or nitrogen).
-
Weathering: Phosphorus is released from phosphate-containing rocks (apatite) through chemical weathering. This transfers phosphorus from the lithosphere into soil and freshwater systems.
-
Uptake by biota: Plants absorb dissolved phosphate ions from the soil through their roots. Phosphorus then moves through food chains as organisms consume plants and each other.
-
Decomposition: When organisms die or produce waste, decomposers (bacteria, fungi) break down organic matter, releasing phosphate back into the soil, where it can be reabsorbed by plants.
-
Runoff to oceans: Dissolved and particulate phosphorus is transported by rivers and surface runoff from land to the ocean.
-
Marine uptake and sedimentation: Marine organisms absorb phosphorus from ocean water. When they die, their remains sink and accumulate as ocean sediments. Over geological time, these sediments may be uplifted to form new phosphate rocks, completing the cycle.
Marking scheme:
- 1 mark per valid natural pathway described, up to 4 marks
- Answers must reference the diagram (Q5-fig1)
- Human-driven pathways (mining, fertiliser application, sewage) should not be credited for this part
Question 5(b) [6 marks]
Explain how human activities have disrupted the phosphorus cycle. Assess whether these disruptations can be managed sustainably.
Answer:
Explanation of disruptions [3 marks]:
-
Mining of phosphate rock for fertiliser: Humans extract phosphate rock at a rate far exceeding natural weathering. This phosphorus is applied to agricultural soils, but crops typically absorb only 15–20% of applied fertiliser. The excess runs off into waterways, representing a massive acceleration of the natural phosphorus flow from land to water.
-
Agricultural runoff and eutrophication: Excess phosphorus from fertiliser runoff enters rivers, lakes, and coastal waters, causing eutrophication — algal blooms that deplete dissolved oxygen, creating "dead zones." Examples include the Gulf of Mexico dead zone (fed by Mississippi River runoff) and eutrophication in Lake Erie, USA.
-
Sewage discharge: Human and animal waste contains high phosphorus concentrations. In areas without adequate treatment, this enters waterways directly, further contributing to eutrophication.
-
Disruption of the natural cycle's closure: In the natural cycle, phosphorus returns to soil through decomposition. In modern food systems, phosphorus is mined in one location (e.g., Morocco), applied to fields in another, consumed in cities, and discharged into waterways — breaking the local cycling of phosphorus and creating a linear, open system.
Assessment of sustainable management [3 marks]:
Can be managed sustainably — evidence for:
- Precision agriculture technologies (GPS-guided fertiliser application, soil testing) can reduce excess fertiliser use by 20–30%, maintaining yields while reducing runoff.
- Phosphorus recovery from wastewater is increasingly feasible. Struvite (magnesium ammonium phosphate) can be precipitated from sewage and used as a slow-returning fertiliser, closing the loop. Plants in countries like the Netherlands and Japan already do this.
- Buffer strips and constructed wetlands along waterways can trap phosphorus before it reaches water bodies, reducing eutrophication.
- Policy measures such as the EU's Nitrates Directive and limits on phosphorus in detergents have successfully reduced phosphorus pollution in some regions.
Challenges to sustainable management:
- Global phosphate reserves are concentrated in a few countries (Morocco holds ~70%), creating geopolitical supply risks.
- Many developing countries lack wastewater treatment infrastructure, making phosphorus recovery difficult.
- Economic incentives for farmers to over-apply fertiliser remain strong in many contexts.
Conclusion: Sustainable management of the phosphorus cycle is technically achievable through a combination of precision agriculture, wastewater treatment with phosphorus recovery, and policy regulation. However, it requires significant investment, international cooperation, and changes to agricultural practices. The challenge is more political and economic than technological.
Marking scheme:
- Up to 3 marks for explaining human disruptions (at least two well-developed points)
- Up to 3 marks for assessment of sustainable management (must include both possibilities and challenges, with a reasoned conclusion)
Free quiz and exam paper access
Enter your details to view this paper
Your access is remembered on this device.