From Real Exams Exam Paper
A Level H2 Geography Practice Paper 5
Free A Level H2 Geography Practice Paper 5, LongCat Exam version, with questions, answers, and A Level-style practice for Singapore students.
These static practice materials are generated from the site's syllabus and paper-generation workflow, with source and model context shown so students and parents can evaluate the material before use.
Questions
TuitionGoWhere Practice Paper - Geography H2 A-Level
TuitionGoWhere Secondary School (AI)
Subject: Geography H2 Level: A-Level (Pre-University) Paper: Practice Paper — Resources & Sustainability (Paper 1 Style) Version: 5 of 5 Duration: 1 hour 30 minutes Total Marks: 60
Name: ___________________________ Class: ___________________________ Date: ___________________________
Instructions to Candidates
- Write your answers in the spaces provided.
- Answer ALL questions.
- Begin each section on a fresh page where possible.
- The number of marks for each question is shown in brackets [ ].
- You are advised to spend approximately:
- Section A: 25 minutes
- Section B: 35 minutes
- Section C: 25 minutes
- Review: 5 minutes
- Credit will be given for the use of relevant examples, case studies, and evidence.
- Use appropriate geographical terminology throughout.
Section A: Data-Based Questions (20 marks)
Answer ALL questions in this section.
Question 1
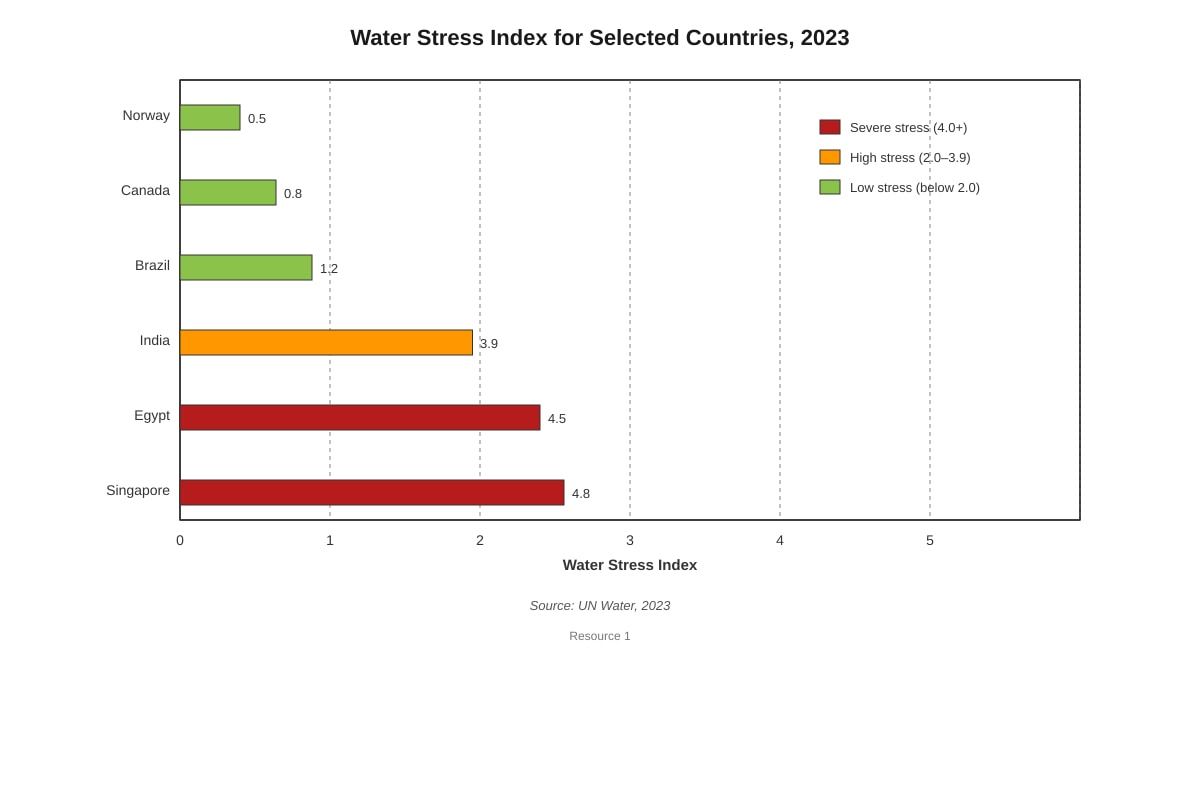
Resource 1 shows the water stress index for six countries in 2023.
Generated chart for Q1.
(a) Compare the water stress levels of the six countries shown in Resource 1. [5]
(b) Suggest two reasons why a country with a high water stress index may still maintain a high level of food security. [4]
(c) Explain how technological solutions can help a water-stressed country improve its long-term water sustainability. [6]
Question 2
Resource 2 is an extract about Singapore's approach to water resource management.
"Singapore, despite being one of the most water-stressed nations in the world, has developed a diversified water supply strategy known as the 'Four National Taps': (1) local catchment water, (2) imported water from Johor, Malaysia, (3) NEWater (recycled water), and (4) desalinated water. By 2060, NEWater and desalination are projected to meet up to 85% of Singapore's water demand. The Public Utilities Board (PUB) manages the entire water cycle, from collection and purification to distribution and reclamation. Investments in membrane technology and reverse osmosis have reduced the energy cost of desalination by nearly 50% since 2005. However, desalination remains energy-intensive, and NEWater production depends on advanced purification processes including microfiltration, reverse osmosis, and ultraviolet disinfection."
— Adapted from PUB Annual Report, 2023
(a) Using Resource 2, identify the Four National Taps that make up Singapore's water supply strategy. [4]
(i) _______________________________________________________________________
(ii) _______________________________________________________________________
(iii) _______________________________________________________________________
(iv) _______________________________________________________________________
(b) Using information from Resource 2, explain two challenges Singapore may face in achieving its 2060 water supply targets. [6]
Section B: Structured Response Questions (20 marks)
Answer ALL questions in this section.
Question 3
(a) Define the concept of sustainable yield in the context of renewable resource management. [2]
(b) Explain why the extraction of groundwater in many parts of the world exceeds sustainable yield. [5]
(c) Evaluate the effectiveness of regulatory approaches versus market-based approaches in managing groundwater resources sustainably. [8]
Question 4
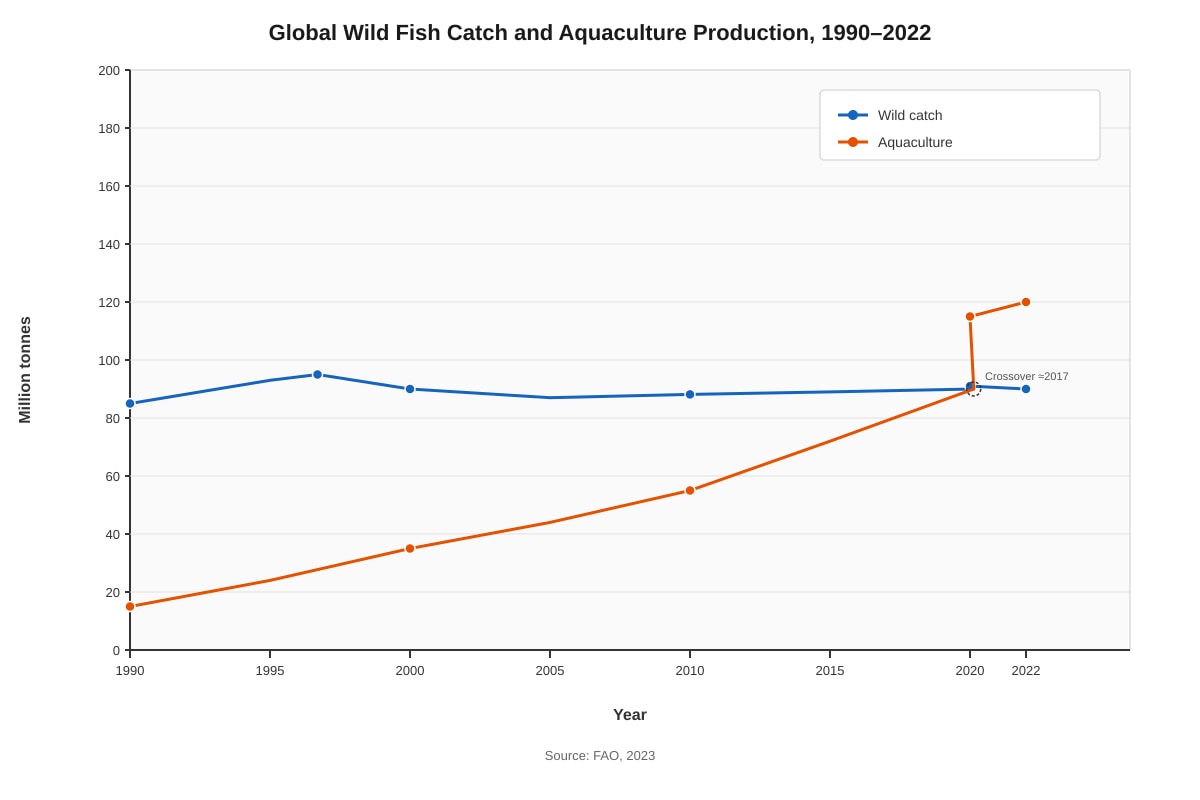
Resource 3 shows a graph of global fish catch and aquaculture production from 1990 to 2022.
Generated graph for Q4.
(a) Describe the trends in global wild fish catch and aquaculture production between 1990 and 2022 as shown in Resource 3. [5]
(b) Explain the environmental consequences of the continued rise in aquaculture production. [5]
Section C: Extended Response / Essay Questions (20 marks)
Answer ONE question from this section.
Question 5
"To what extent is the concept of a circular economy more effective than traditional linear economic models in achieving resource sustainability?"
In your answer, refer to specific examples and case studies. Evaluate the strengths and limitations of both approaches at different scales. [20]
Question 6
"Energy transitions in developing countries are constrained more by economic factors than by technological limitations."
How far do you agree with this statement? Support your answer with reference to specific examples and evidence. [20]
END OF PAPER
Answers
TuitionGoWhere Practice Paper — Geography H2 A-Level
Answer Key & Marking Scheme
Subject: Geography H2 | Paper: Practice Paper — Resources & Sustainability | Version: 5 of 5 Total Marks: 60
Section A: Data-Based Questions (20 marks)
Question 1 (15 marks total)
(a) Compare the water stress levels of the six countries shown in Resource 1. [5]
Marking Scheme:
| Marks | Descriptor |
|---|---|
| 1–2 | Simple description of individual country values without comparative language. Limited reference to data. |
| 3–4 | Valid comparison using comparative language for most countries. Some data reference. |
| 5 | Clear, well-structured comparison across all six countries with accurate data reference, comparative language, and identification of overall pattern. |
Model Answer:
The water stress levels vary considerably among the six countries. Singapore records the highest water stress index at 4.8, closely followed by Egypt at 4.5 and India at 3.9 — all three fall into the category of extreme water stress (above 4.0 on the index). In contrast, Brazil records a moderate level of 1.2, while Canada (0.8) and Norway (0.5) both register very low water stress. The difference between the most stressed country (Singapore, 4.8) and the least stressed (Norway, 0.5) is 4.3 index points, indicating a nearly tenfold variation. Notably, the three countries with the highest stress are all located in tropical to arid regions or are highly urbanised city-states with limited natural freshwater resources, whereas the three lowest-stressing countries possess abundant freshwater from rivers, lakes, or glacial sources.
Common Mistakes:
- Simply listing each country's value without using comparative language such as "higher than," "in contrast," or "significantly lower."
- Failing to reference actual index values from the resource.
- Not identifying the overall pattern or grouping of countries.
(b) Suggest two reasons why a country with a high water stress index may still maintain a high level of food security. [4]
Marking Scheme: 2 marks per valid reason. Reason must be explained, not just stated.
Model Answer:
Reason 1 — Food imports (virtual water trade): A water-stressed country may import large quantities of food rather than producing it domestically. By importing water-intensive crops such as rice or wheat, the country effectively imports "virtual water" embedded in those products. This allows it to maintain food security without drawing on its own scarce water resources. For example, Singapore imports over 90% of its food, bypassing the need for water-intensive domestic agriculture.
Reason 2 — Technological investment in water-efficient agriculture: Countries may invest in advanced agricultural technologies such as drip irrigation, hydroponics, or precision farming, which dramatically reduce the amount of water needed per unit of food produced. Israel, despite being in an arid region with high water stress, maintains high food security through widespread use of drip irrigation and desalination-powered agriculture.
Alternative valid reasons:
- Desalination providing water for irrigation (e.g., Saudi Arabia historically).
- Economic wealth enabling purchase of food on global markets (e.g., Gulf states).
- Government subsidies for food imports or strategic food reserves.
Common Mistakes:
- Stating a reason without explaining the mechanism linking it to food security.
- Confusing water stress with food stress without explaining the disconnect.
(c) Explain how technological solutions can help a water-stressed country improve its long-term water sustainability. [6]
Marking Scheme:
| Marks | Descriptor |
|---|---|
| 1–2 | One or two technological solutions mentioned but explanation is superficial or lacks development. |
| 3–4 | Two relevant technologies explained with some detail about how they improve sustainability. Limited range or depth. |
| 5–6 | At least two well-developed explanations of specific technologies, clearly linked to long-term water sustainability. Uses relevant examples. |
Model Answer:
Technological solutions can significantly enhance long-term water sustainability in water-stressed countries through several mechanisms:
Desalination: Advances in reverse osmosis membrane technology have made it possible to convert seawater into potable water at progressively lower energy costs. For instance, Singapore's Tuas Desalination Plant uses advanced membrane systems that are nearly 50% more energy-efficient than earlier plants. As desalination becomes more energy-efficient and can be powered by renewable energy, it provides a climate-independent water source that is not subject to rainfall variability, thereby enhancing long-term supply reliability.
Water recycling (NEWater technology): Singapore's NEWater programme uses a three-stage purification process — microfiltration, reverse osmosis, and ultraviolet disinfection — to reclaim used water to a standard that exceeds WHO drinking water guidelines. By recycling water, the country reduces its dependence on imported water and rainfall, creating a closed-loop system that is inherently more sustainable. NEWater currently meets about 40% of Singapore's water demand, with plans to increase this to 55% by 2060.
Smart water management systems: Internet of Things (IoT) sensors and AI-driven monitoring systems can detect leaks in distribution networks in real time, reducing non-revenue water losses. In many developing countries, up to 40% of treated water is lost through pipe leaks; smart systems can cut this significantly, making existing supplies go further without requiring new sources.
Common Mistakes:
- Listing technologies without explaining how they improve sustainability.
- Failing to link the technology to the concept of "long-term" sustainability.
- Not providing specific examples or details.
Question 2 (10 marks total)
(a) Using Resource 2, identify the Four National Taps that make up Singapore's water supply strategy. [4]
Marking Scheme: 1 mark per correct identification.
Model Answer:
(i) Local catchment water (ii) Imported water from Johor, Malaysia (iii) NEWater (recycled water) (iv) Desalinated water
Common Mistakes:
- Writing "rainwater" instead of "local catchment water" — accept if clearly equivalent.
- Writing "recycled water" without naming NEWater — accept, but full credit for the proper name.
(b) Using information from Resource 2, explain two challenges Singapore may face in achieving its 2060 water supply targets. [6]
Marking Scheme: 3 marks per challenge. Must be explained, not just identified. Must draw on Resource 2.
Model Answer:
Challenge 1 — Energy intensity of desalination: Resource 2 states that desalination remains energy-intensive despite a 50% reduction in energy costs since 2005. As Singapore plans for desalination to meet a growing share of demand (up to 85% combined with NEWater by 2060), the total energy required will increase substantially. This creates a tension between water sustainability and carbon emissions / energy sustainability, particularly if the energy is derived from fossil fuels. Securing sufficient clean energy to power expanded desalination capacity is a significant challenge.
Challenge 2 — Dependence on advanced technology for NEWater: Resource 2 notes that NEWater production depends on advanced purification processes including microfiltration, reverse osmosis, and ultraviolet disinfection. Maintaining and upgrading these systems requires sustained investment in research, skilled personnel, and infrastructure. Any technological failure or supply chain disruption (e.g., membrane shortages) could affect production capacity. Additionally, public acceptance of recycled water, while currently high in Singapore, requires ongoing public education.
Alternative valid challenges (from Resource 2):
- Reliance on imported water from Johor, which is subject to bilateral agreements that expire (the current agreement runs until 2061) and geopolitical considerations.
- The ambitious scale of the 85% target requiring massive infrastructure investment.
Common Mistakes:
- Providing challenges not mentioned or implied in Resource 2 (e.g., climate change effects on rainfall — not in the extract).
- Stating a challenge without explaining why it is a challenge for the 2060 targets.
Section B: Structured Response Questions (20 marks)
Question 3 (15 marks total)
(a) Define the concept of sustainable yield in the context of renewable resource management. [2]
Marking Scheme: 2 marks for a clear, complete definition. 1 mark for a partial definition.
Model Answer:
Sustainable yield is the maximum rate at which a renewable resource can be used indefinitely without depleting the resource base or reducing its capacity for natural regeneration. In other words, it is the harvest or extraction rate that does not exceed the rate of natural replenishment, ensuring the resource remains available for future generations.
Key elements for full marks:
- Must refer to a rate or amount of use.
- Must indicate that the resource is not depleted / can regenerate.
- Must imply indefinite or long-term availability.
Common Mistakes:
- Confusing sustainable yield with carrying capacity.
- Defining it only as "using resources sustainably" without specifying the rate relative to regeneration.
(b) Explain why the extraction of groundwater in many parts of the world exceeds sustainable yield. [5]
Marking Scheme:
| Marks | Descriptor |
|---|---|
| 1–2 | One or two reasons identified but explanation is limited or lacks development. |
| 3–4 | Two to three reasons with clear explanation of how each leads to over-extraction. |
| 5 | Well-developed explanation covering multiple reasons with clear causal chains and, ideally, examples. |
Model Answer:
Groundwater extraction exceeds sustainable yield in many parts of the world due to several interconnected factors:
1. Rising agricultural demand: Agriculture accounts for approximately 70% of global freshwater withdrawals. In regions such as the Indo-Gangetic Plain and the Ogallala Aquifer region in the United States, farmers rely heavily on groundwater for irrigation to maintain crop yields. As populations grow and diets shift toward more water-intensive foods, demand for irrigation water increases, driving extraction rates far beyond natural recharge rates. In India, for example, groundwater levels have dropped by an average of 0.3 metres per year in some states due to over-abstraction for agriculture.
2. Lack of effective regulation and governance: In many countries, groundwater is treated as a common-pool resource with poorly enforced extraction rights. Drilling boreholes is often unregulated or under-regulated, meaning there is no mechanism to limit total extraction to sustainable levels. In parts of sub-Saharan Africa and South Asia, the absence of metering, licensing, or monitoring systems allows unrestricted pumping.
3. Subsidised energy for pumping: In countries such as India and Pakistan, governments subsidise electricity for agricultural use, effectively reducing the cost of pumping groundwater to near zero. This removes the economic incentive for farmers to conserve water and encourages over-extraction. The subsidy creates a perverse incentive where the marginal cost of extracting an additional unit of water is negligible.
4. Population growth and urbanisation: Rapid urbanisation increases demand for domestic and industrial water. Cities such as Jakarta and Mexico City have experienced severe groundwater depletion as urban water demand outpaces recharge, compounded by impermeable surfaces reducing infiltration.
Common Mistakes:
- Listing reasons without explaining the causal mechanism.
- Not providing examples.
- Confusing groundwater depletion with surface water pollution.
(c) Evaluate the effectiveness of regulatory approaches versus market-based approaches in managing groundwater resources sustainably. [8]
Marking Scheme:
| Marks | Descriptor |
|---|---|
| 1–3 | Describes one or both approaches but with limited evaluation. May be one-sided. |
| 4–6 | Explains both approaches with some evaluation of strengths and weaknesses. May lack balance or specific examples. |
| 7–8 | Comprehensive evaluation of both approaches with clear comparison, specific examples, and a reasoned conclusion about effectiveness in different contexts. |
Model Answer:
Regulatory approaches involve government-imposed rules and restrictions on groundwater extraction, such as licensing systems, extraction quotas, well-spacing requirements, and bans on new boreholes in over-exploited areas. For example, the European Union's Water Framework Directive requires member states to achieve "good quantitative status" for groundwater bodies, setting legal limits on abstraction.
Strengths:
- Can be highly effective when well-enforced, as they set clear, non-negotiable limits. Australia's Murray-Darling Basin Plan imposed a cap on water diversions, which helped stabilise groundwater levels in some areas.
- Ensure equitable access by preventing powerful actors from monopolising the resource.
- Can be tailored to local hydrogeological conditions.
Weaknesses:
- Enforcement is costly and difficult, especially in developing countries with limited institutional capacity. In India, despite regulations on groundwater extraction, illegal boreholes are widespread.
- May lack flexibility — fixed quotas may not respond well to changing conditions such as drought or population growth.
- Can create black markets for water if restrictions are too severe relative to demand.
Market-based approaches use economic incentives to influence behaviour, such as water pricing, tradable extraction permits, and removal of subsidies. For instance, tradable water rights in Chile and parts of Australia allow water entitlements to be bought and sold, theoretically directing water to its highest-value use.
Strengths:
- Can achieve the same level of conservation at lower economic cost by allowing water to flow to higher-value uses. Tradable permits in Australia's water markets have improved allocative efficiency.
- Generate revenue that can be reinvested in resource management.
- Provide flexibility — users can respond to price signals by adopting water-saving technologies.
Weaknesses:
- May disadvantage low-income users who cannot afford higher prices or to purchase permits, raising equity concerns. In Chile, small-scale farmers have sometimes been priced out of water markets.
- Require well-defined property rights and robust monitoring systems, which are difficult to establish for groundwater.
- Prices may not reflect the full environmental cost of extraction, leading to continued over-use even with pricing.
Conclusion: Neither approach is universally superior. Regulatory approaches are essential as a baseline to prevent catastrophic depletion, but they are most effective when combined with market-based mechanisms that provide flexibility and economic efficiency. In practice, the most successful groundwater management systems — such as those in Australia and parts of the western United States — use a hybrid approach combining extraction limits (regulatory) with tradable permits and pricing (market-based). The effectiveness of either approach ultimately depends on institutional capacity, enforcement, and the specific socio-economic context.
Common Mistakes:
- Only evaluating one approach.
- Providing generic descriptions without specific examples.
- Failing to reach a conclusion or make a comparative judgement.
Question 4 (10 marks total)
(a) Describe the trends in global wild fish catch and aquaculture production between 1990 and 2022 as shown in Resource 3. [5]
Marking Scheme:
| Marks | Descriptor |
|---|---|
| 1–2 | Describes one trend only or gives vague descriptions without data reference. |
| 3–4 | Describes both trends with some data reference. May lack detail on fluctuations or crossover. |
| 5 | Comprehensive description of both trends with accurate data reference, identification of key features (peak, fluctuations, crossover point), and overall pattern. |
Model Answer:
Wild fish catch: Global wild fish catch increased gradually from approximately 85 million tonnes in 1990 to a peak of about 95 million tonnes in 1996. After 1996, wild catch declined and then fluctuated between approximately 85 and 93 million tonnes for the remainder of the period, showing no clear upward trend. By 2022, wild catch stood at approximately 90 million tonnes, broadly similar to the 1990 level. This stagnation suggests that most wild fisheries have reached or exceeded their maximum sustainable yield.
Aquaculture production: In contrast, aquaculture production showed a consistent and accelerating upward trend throughout the entire period. It rose from approximately 15 million tonnes in 1990 to about 35 million tonnes by 2000, then to approximately 55 million tonnes by 2010. The rate of increase accelerated further, reaching approximately 120 million tonnes by 2022. Aquaculture surpassed wild catch at approximately 2017, marking a significant shift in global fish supply.
Overall pattern: The data reveals a fundamental transition in global fisheries — from a wild-catch-dominated system to one increasingly reliant on aquaculture. While wild catch has plateaued, reflecting biological and ecological limits, aquaculture has grown exponentially to meet rising global demand for seafood.
Common Mistakes:
- Describing only one of the two trends.
- Not referencing specific data values or years.
- Missing the crossover point (approximately 2017).
- Saying wild catch "decreased" overall — it fluctuated but did not show a sustained decline.
(b) Explain the environmental consequences of the continued rise in aquaculture production. [5]
Marking Scheme:
| Marks | Descriptor |
|---|---|
| 1–2 | One consequence identified with limited explanation. |
| 3–4 | Two consequences explained with some detail. |
| 5 | At least two well-developed environmental consequences with clear causal chains and, ideally, examples. |
Model Answer:
The continued rise in aquaculture production has several significant environmental consequences:
1. Habitat destruction and coastal ecosystem degradation: The expansion of aquaculture, particularly shrimp farming in Southeast Asia and salmon farming in Chile and Norway, has led to the destruction of mangrove forests, wetlands, and coastal habitats. Mangroves are cleared to create pond areas, resulting in loss of biodiversity, reduced coastal protection from storms, and release of stored carbon. In Thailand, approximately 50–65% of mangrove loss between 1975 and 2000 was attributed to shrimp aquaculture.
2. Water pollution and eutrophication: Intensive aquaculture systems release large quantities of organic waste (uneaten feed, faeces) and chemical inputs (antibiotics, pesticides, fertilisers) into surrounding water bodies. This nutrient loading can cause eutrophication — excessive algal growth that depletes dissolved oxygen and creates hypoxic "dead zones." In China's coastal waters, nutrient pollution from fish farms has been linked to harmful algal blooms that damage wild fisheries and marine ecosystems.
3. Disease transmission and genetic contamination: High-density aquaculture creates conditions conducive to disease outbreaks. The use of antibiotics in fish farming contributes to antimicrobial resistance. Additionally, farmed fish that escape can interbreed with wild populations, reducing genetic diversity and potentially introducing diseases. In Norway, escaped farmed salmon have been found to genetically compromise wild Atlantic salmon populations.
Common Mistakes:
- Focusing only on economic or social consequences rather than environmental ones.
- Providing vague statements (e.g., "it pollutes the water") without explaining the mechanism.
- Not providing examples.
Section C: Extended Response / Essay Questions (20 marks)
Answer ONE question. Each question is marked out of 20.
Question 5
"To what extent is the concept of a circular economy more effective than traditional linear economic models in achieving resource sustainability?" [20]
Marking Scheme:
| Marks | Band Descriptor |
|---|---|
| 1–5 | Basic understanding of one or both models. Limited evaluation. No or few examples. Argument is unclear or one-sided. |
| 6–10 | Understanding of both models with some evaluation. At least one example provided. Some attempt at balanced argument but may lack depth or coherence. |
| 11–14 | Clear understanding of both models. Effective evaluation with specific examples. Balanced argument with some synthesis. Good use of geographical terminology. |
| 15–18 | Thorough understanding with well-developed evaluation. Multiple specific examples at different scales. Strong, balanced argument with clear synthesis and a reasoned conclusion. |
| 19–20 | Exceptional depth and breadth. Sophisticated evaluation with nuanced argument. Excellent range of examples, including counter-arguments. Fluent, well-structured response with precise terminology. |
Model Answer / Expected Content:
Introduction: Define both models. The linear economy follows a "take-make-dispose" pattern where raw materials are extracted, manufactured into products, used, and discarded as waste. The circular economy aims to eliminate waste by designing products for durability, reuse, repair, and recycling, keeping materials in continuous loops of use.
Arguments that circular economy is more effective:
-
Reduces primary resource extraction: By reusing and recycling materials, the circular economy reduces demand for virgin resources. For example, the Netherlands aims to be fully circular by 2050, and Amsterdam's circular strategy targets a 50% reduction in primary raw material use by 2030 through industrial symbiosis and material recovery.
-
Minimises waste and pollution: Circular design principles reduce landfill use and associated pollution. Japan's "Sound Material-Cycle Society" policy has achieved a recycling rate of approximately 20% for overall waste and over 90% for certain materials like metals.
-
Creates economic opportunities: The Ellen MacArthur Foundation estimates the circular economy could generate $4.5 trillion in economic benefits by 2030. In Finland, circular economy business models have created new industries in textile recycling and bio-based materials.
-
Addresses resource scarcity: For critical raw materials (e.g., rare earth elements in electronics), recycling and urban mining reduce dependence on geopolitically concentrated supply chains.
Arguments that circular economy has limitations / linear model may still be relevant:
-
Thermodynamic limits: Not all materials can be recycled indefinitely without quality degradation (downcycling). Plastics, for example, lose polymer chain length with each recycling cycle, limiting true circularity.
-
Energy requirements: Recycling and remanufacturing processes can be energy-intensive. If the energy comes from fossil fuels, the environmental benefit is reduced.
-
Economic and behavioural barriers: Transitioning to circular models requires significant upfront investment in new infrastructure, redesign of products, and changes in consumer behaviour. Many developing countries lack the institutional and financial capacity to implement circular systems at scale.
-
Scale and complexity of global supply chains: Globalised production makes it difficult to track and recover materials. Products manufactured across multiple countries with diverse regulatory frameworks complicate circular recovery.
-
Some linear processes may be more efficient for certain materials: For example, the energy required to recycle certain low-grade materials may exceed the energy needed to produce them from virgin sources.
Conclusion: The circular economy is significantly more effective than the linear model in principle for achieving resource sustainability, particularly for high-value, easily recoverable materials. However, its effectiveness is constrained by thermodynamic limits, energy requirements, economic barriers, and the complexity of global supply chains. A hybrid approach — applying circular principles where feasible while improving the efficiency of remaining linear processes — may be the most pragmatic path forward. The effectiveness also varies by scale: circular economy principles are more easily implemented at local and national scales (e.g., city-level waste management) than at the global scale.
Question 6
"Energy transitions in developing countries are constrained more by economic factors than by technological limitations." How far do you agree? [20]
Marking Scheme:
| Marks | Band Descriptor |
|---|---|
| 1–5 | Basic understanding of energy transitions. Limited evaluation of economic vs technological factors. Few or no examples. |
| 6–10 | Some understanding of both economic and technological constraints. At least one example. Attempt at balanced argument but may lack depth. |
| 11–14 | Clear understanding of both types of constraints with specific examples. Effective evaluation with balanced argument and some synthesis. |
| 15–18 | Thorough analysis of both factors with well-developed evaluation. Multiple specific examples at different scales. Strong, balanced argument with clear conclusion. |
| 19–20 | Exceptional depth. Nuanced argument acknowledging complexity and variation across different developing countries. Excellent examples and synthesis. |
Model Answer / Expected Content:
Introduction: Define energy transition — the shift from fossil fuel-based energy systems to low-carbon, renewable sources. Acknowledge that both economic and technological factors play roles, but the question asks which is the greater constraint in developing countries.
Arguments that economic factors are the greater constraint:
-
High upfront capital costs: Renewable energy infrastructure (solar farms, wind turbines, grid-scale storage) requires significant initial investment. Developing countries often face high borrowing costs and limited access to international finance. For example, sub-Saharan Africa receives less than 2% of global renewable energy investment despite having enormous solar potential.
-
Fossil fuel subsidies: Many developing countries subsidise fossil fuels to keep energy affordable for their populations. Indonesia, for instance, spent over $15 billion on fossil fuel subsidies in 2022, diverting funds that could support renewable energy deployment.
-
Poverty and competing development priorities: Developing countries face urgent needs in healthcare, education, and infrastructure. Energy transition investments may be deprioritised. In many Least Developed Countries (LDCs), per capita energy consumption is so low that expanding any energy access — regardless of source — takes precedence over transition.
-
Loss of revenue from fossil fuel exports: Countries such as Nigeria, Angola, and Mozambique depend heavily on oil and gas revenues. Transitioning away from fossil fuels threatens government revenue, employment, and economic stability.
-
Limited grid infrastructure: Many developing countries lack the transmission and distribution infrastructure needed to integrate intermittent renewable sources. Building this infrastructure is an economic challenge as much as a technical one.
Arguments that technological factors are also significant:
-
Energy storage limitations: Battery technology for grid-scale storage remains expensive and geographically constrained. Developing countries in tropical regions face challenges with battery degradation in high temperatures. Without affordable storage, the intermittency of solar and wind limits their reliability.
-
Technology transfer barriers: Intellectual property rights and patent protections can restrict developing countries' access to the most efficient renewable technologies. While solar panel costs have fallen globally, the latest high-efficiency technologies remain concentrated in developed countries.
-
Technical skills gap: Developing and maintaining renewable energy systems requires skilled engineers and technicians. Many developing countries lack the technical training infrastructure to build and sustain a renewable energy workforce.
-
Grid integration challenges: Integrating variable renewable energy into weak or small grids (common in developing countries) requires sophisticated grid management technology that may not be readily available.
Counter-argument / Synthesis: However, many technological barriers are ultimately rooted in economics. If developing countries had greater financial resources, they could purchase advanced technologies, invest in training, and build storage infrastructure. The falling cost of solar PV (down 90% since 2010) demonstrates that technological limitations diminish as investment increases. International climate finance mechanisms such as the Green Climate Fund aim to address this, but funding remains insufficient.
Furthermore, the distinction between economic and technological factors is not always clear-cut. For example, the lack of grid infrastructure is simultaneously an economic constraint (insufficient investment) and a technical one (engineering challenges of grid extension in remote areas).
Conclusion: Economic factors are indeed the primary constraint on energy transitions in developing countries, as they underpin the ability to access, deploy, and maintain technology. However, technological limitations — particularly in energy storage and grid integration — are not negligible and can be binding constraints in specific contexts. The most effective approach combines increased international climate finance (addressing economic barriers) with technology transfer and capacity building (addressing technological barriers). The balance between these constraints varies by country: middle-income developing countries such as India and Brazil face primarily economic constraints, while low-income countries in sub-Saharan Africa face both economic and technological challenges simultaneously.
END OF ANSWER KEY
Free quiz and exam paper access
Enter your details to view this paper
Your access is remembered on this device.