From Real Exams Exam Paper
A Level H2 Geography Practice Paper 4
Free A Level H2 Geography Practice Paper 4, LongCat Exam version, with questions, answers, and A Level-style practice for Singapore students.
These static practice materials are generated from the site's syllabus and paper-generation workflow, with source and model context shown so students and parents can evaluate the material before use.
Questions
TuitionGoWhere Practice Paper - Geography H2 A-Level
TuitionGoWhere Secondary School (AI)
Subject: Geography Level: A-Level H2 (9173) Paper: Practice Paper — Resources & Sustainability Version: 4 of 5 Duration: 1 hour 45 minutes Total Marks: 60
Name: ___________________________ Class: ___________________________ Date: ___________________________
Instructions
- Answer ALL questions.
- Write your answers in the spaces provided.
- Begin each section on a new page if needed.
- The number of marks for each question is shown in brackets [ ].
- Quality of written communication will be assessed in questions marked with an asterisk (*).
- You may use a calculator where appropriate.
Section A: Source-Based Questions (30 marks)
Answer ALL questions in this section.
Question 1
Resource 1: Water Stress Index for Selected Countries, 2023
| Country | Water Stress Index (%) | Annual Renewable Water per capita (m³) | Population (millions) | Main Water Use Sector |
|---|---|---|---|---|
| Singapore | 78 | 110 | 5.9 | Industrial (45%) |
| Qatar | 98 | 26 | 2.7 | Agricultural (85%) |
| Netherlands | 22 | 5,400 | 17.5 | Agricultural (60%) |
| Kenya | 55 | 580 | 54.0 | Agricultural (80%) |
| Japan | 35 | 3,380 | 125.0 | Industrial (55%) |
| Egypt | 95 | 570 | 104.0 | Agricultural (88%) |
(Source: Adapted from World Resources Institute Aqueduct Data, 2023)
(a) Define the term water stress index. [2]
(b) Using Resource 1, compare the water stress levels of Qatar and the Netherlands. [3]
(c) Suggest two reasons why a country with a high water stress index may still have a relatively low annual renewable water per capita. [4]
(d)* To what extent is agriculture the main cause of water stress in countries shown in Resource 1? [6]
Question 2
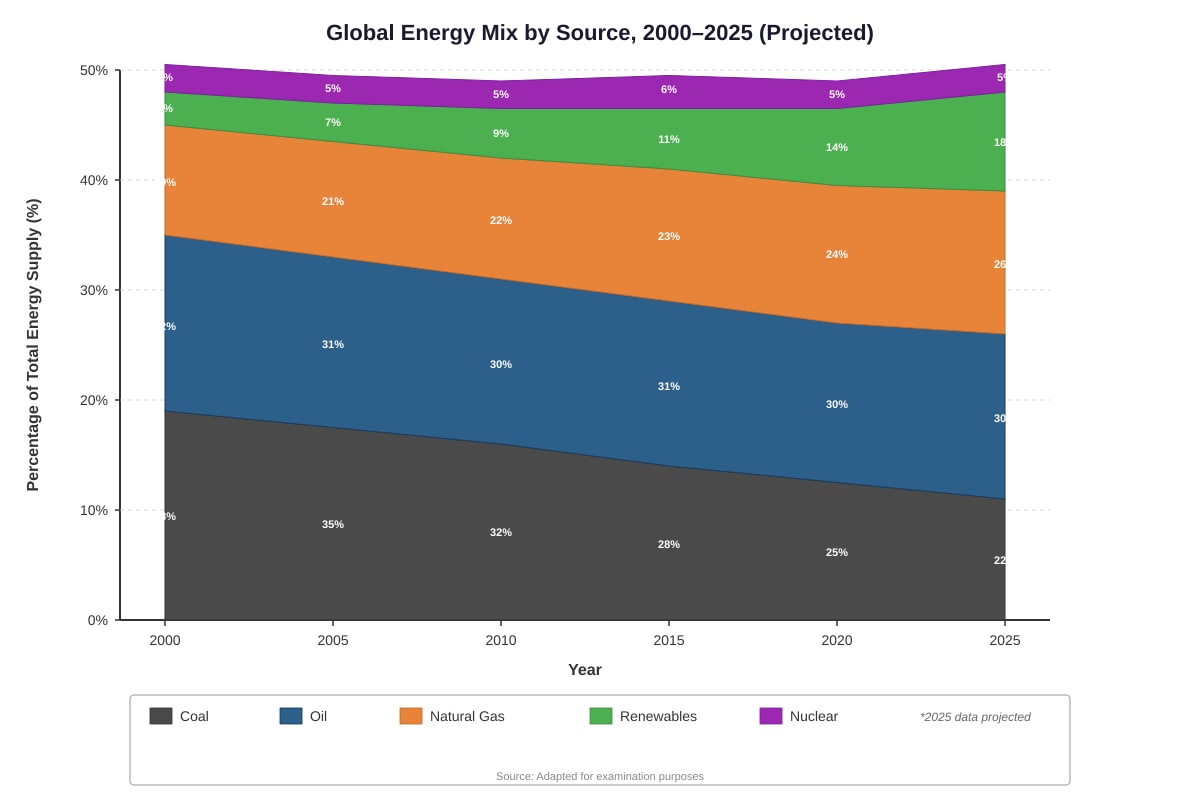
Resource 2: Graph showing Global Energy Mix by Source, 2000–2025 (projected)
Generated graph for Q2.
(a) Using Resource 2, describe the trend in the use of renewable energy sources between 2000 and 2025. [3]
(b) Explain two factors that have contributed to the change in coal usage shown in Resource 2. [4]
(c)* "The transition to renewable energy is the most effective strategy for achieving resource sustainability." How far do you agree with this statement? [8]
Section B: Structured Response Questions (20 marks)
Answer ALL questions in this section.
Question 3
(a) Define the term energy security. [2]
(b) Explain three strategies that a small island nation like Singapore can adopt to improve its energy security. [6]
(c) Assess the effectiveness of nuclear energy as a strategy for improving energy security. [4]
Question 4
(a) Outline two characteristics of a circular economy. [2]
(b) With reference to a named example, explain how a circular economy approach can contribute to resource sustainability. [6]
Section C: Essay Question (10 marks)
Answer ONE question in this section.
Question 5
"Population growth is the greatest threat to global resource sustainability." Evaluate this view. [10]
END OF PAPER
Section A: 30 marks | Section B: 20 marks | Section C: 10 marks | Total: 60 marks
Answers
TuitionGoWhere Practice Paper - Geography H2 A-Level
Answer Key & Marking Scheme — Resources & Sustainability (Version 4 of 5)
Section A: Source-Based Questions (30 marks)
Question 1
(a) Define the term water stress index. [2]
Answer: The water stress index measures the ratio of total water withdrawals to available renewable water supplies in a given area, expressed as a percentage. A higher percentage indicates greater competition for water resources and more severe water stress.
Marking:
- [1] for identifying it as a ratio/percentage of water use relative to availability
- [1] for linking it to scarcity/competition for water resources
Common mistakes:
- Confusing water stress with water quality or pollution levels
- Simply defining it as "lack of water" without reference to the ratio of withdrawals to supply
(b) Using Resource 1, compare the water stress levels of Qatar and the Netherlands. [3]
Answer: Q Qatar has a significantly higher water stress index (98%) compared to the Netherlands (22%), indicating Qatar faces extreme water stress while the Netherlands has low water stress. Qatar's annual renewable water per capita is only 26 m³, far below the Netherlands' 5,400 m³. Despite Qatar's much smaller population (2.7 million vs 17.5 million), its water stress is far more severe due to its arid climate and limited freshwater resources.
Marking:
- [1] for identifying the difference in water stress index values (98% vs 22%) with comparative language
- [1] for referencing the difference in annual renewable water per capita (26 vs 5,400 m³)
- [1] for making a valid comparative point about population size or overall water availability
Common mistakes:
- Simply stating raw figures without comparative language ("Qatar has 98% and Netherlands has 22%")
- Not referencing data from the resource
(c) Suggest two reasons why a country with a high water stress index may still have a relatively low annual renewable water per capita. [4]
Answer:
Reason 1: High population density relative to available water resources. A country may have a large population concentrated in a small area with limited freshwater sources (e.g., Singapore has only 110 m³ per capita despite advanced water management), meaning demand far exceeds natural renewable supply.
Reason 2: Arid or semi-arid climatic conditions with low rainfall and high evapotranspiration rates. Countries like Egypt and Qatar receive very little precipitation, so natural renewable water supplies are inherently limited regardless of water management efforts.
Marking:
- [2] per reason: [1] for a valid reason, [1] for clear development/explanation linking the reason to both high water stress and low per capita availability
- Acceptable reasons include: high population density, arid climate, over-extraction of groundwater, pollution reducing usable supply, seasonal variability in rainfall, high agricultural/industrial demand
Common mistakes:
- Giving the same reason twice with different wording
- Providing reasons that explain only one of the two metrics (stress index OR per capita) without linking both
(d)* To what extent is agriculture the main cause of water stress in countries shown in Resource 1? [6]
Answer:
Agree — agriculture is the main cause:
- In Qatar, Kenya, and Egypt, agriculture accounts for 80–88% of water use, and all three have high water stress indices (55–98%). This strong correlation suggests agriculture is the dominant driver of water stress in these countries.
- Agricultural irrigation is often inefficient (e.g., flood irrigation), leading to significant water wastage through evaporation and runoff, exacerbating water stress.
Disagree — other factors are also significant:
- Singapore has a high water stress index (78%) but agriculture is not the main water user — industrial use accounts for 45%. This shows that industrialisation and urbanisation can also drive water stress independently of agriculture.
- Egypt's extremely high water stress (95%) is compounded by its very low annual renewable water per capita (570 m³) due to its arid climate and dependence on the Nile, suggesting natural scarcity and geopolitical factors also play a role.
- Population pressure and rapid urbanisation increase domestic and industrial water demand, which can be as significant as agricultural demand in some contexts.
Conclusion: While agriculture is a major cause of water stress in many countries shown (particularly Qatar, Kenya, and Egypt), it is not the sole or universal cause. Industrial demand (Singapore) and natural climatic scarcity (Egypt) also contribute significantly. The extent to which agriculture is the main cause depends on the economic structure and climatic context of each country.
Marking:
- Level 1 (1–2 marks): Simple statements about agriculture and water use with limited reference to Resource 1. No evaluation.
- Level 2 (3–4 marks): Some explanation of agriculture's role with reference to data from Resource 1. Limited counter-argument or one-sided argument.
- Level 3 (5–6 marks): Balanced argument with clear reference to Resource 1 data, considering both agriculture and other factors. Well-structured evaluation with a reasoned conclusion. Quality of written communication is good.
Common mistakes:
- Ignoring the data in Resource 1 and writing generically
- One-sided argument without considering counter-examples (e.g., Singapore)
- Not reaching a conclusion
Question 2
(a) Using Resource 2, describe the trend in the use of renewable energy sources between 2000 and 2025. [3]
Answer: The proportion of renewable energy in the global energy mix has increased steadily from approximately 6% in 2000 to a projected 18% in 2025. The rate of increase has accelerated after 2015, rising from 11% in 2015 to 18% in 2025 (a 7 percentage point increase in 10 years), compared to a 5 percentage point increase in the preceding 15 years (2000–2015).
Marking:
- [1] for identifying the overall increasing trend
- [1] for referencing specific data values from the graph (e.g., 6% to 18%)
- [1] for noting the acceleration in rate of increase after 2015
Common mistakes:
- Vague descriptions ("renewables have increased") without data references
- Not noting the change in rate of increase
(b) Explain two factors that have contributed to the change in coal usage shown in Resource 2. [4]
Answer:
Factor 1: Environmental policies and climate agreements. International agreements such as the Paris Agreement (2015) have committed nations to reducing greenhouse gas emissions. Coal is the most carbon-intensive fossil fuel, producing approximately 820 g CO₂/kWh compared to natural gas at approximately 490 g CO₂/kWh. Governments have introduced carbon taxes, emissions trading systems, and coal phase-out policies, leading to a decline in coal's share from 38% to 22%.
Factor 2: Competition from cheaper and cleaner energy sources. The cost of renewable energy technologies (particularly solar PV and wind) has fallen dramatically — solar PV costs have decreased by approximately 90% since 2010. Natural gas has also become more accessible due to shale gas extraction (e.g., fracking in the USA). These cheaper alternatives have displaced coal in electricity generation.
Marking:
- [2] per factor: [1] for identifying a valid factor, [1] for clear explanation of how it contributed to the decline in coal usage
- Acceptable factors: environmental policies, carbon pricing, renewable energy cost reductions, natural gas competition, energy efficiency improvements, public pressure/NGO campaigns
Common mistakes:
- Stating "coal is bad for the environment" without explaining the mechanism of decline
- Not linking the factor specifically to the trend shown in Resource 2
(c)* "The transition to renewable energy is the most effective strategy for achieving resource sustainability." How far do you agree with this statement? [8]
Answer:
Agree — renewable energy transition is highly effective:
- Renewable energy sources (solar, wind, hydro) are inexhaustible on human timescales, unlike fossil fuels which are finite. Transitioning to renewables directly addresses the depletion of non-renewable resources.
- Renewables produce little to no greenhouse gas emissions during operation, mitigating climate change which is itself a major threat to resource sustainability (e.g., changing rainfall patterns affecting water resources).
- The declining cost of renewables makes them increasingly accessible — solar PV costs have fallen ~90% since 2010, enabling widespread adoption even in developing countries.
Disagree — other strategies are equally or more important:
- Energy efficiency and conservation may be more cost-effective. Reducing energy demand through efficiency measures (e.g., building insulation, efficient appliances) can achieve significant resource savings without requiring new infrastructure. Japan's "Top Runner" programme has improved appliance energy efficiency by up to 80%.
- Nuclear energy provides reliable baseload power with very low carbon emissions (~12 g CO₂/kWh) and a small land footprint compared to solar/wind. France generates ~70% of its electricity from nuclear, achieving one of the lowest carbon electricity grids in Europe.
- Circular economy approaches address resource sustainability more holistically by reducing material consumption, reusing products, and recycling waste. This tackles resource depletion across all sectors, not just energy.
- Limitations of renewables: Intermittency issues require energy storage (battery production requires lithium and cobalt mining, creating new sustainability challenges). Large-scale solar and wind farms require significant land use and can have ecological impacts.
Conclusion: While the transition to renewable energy is a crucial and highly visible strategy for resource sustainability, it is not necessarily the "most effective" in isolation. A combination of strategies — including energy efficiency, nuclear power, circular economy approaches, and demand management — is likely to be more effective than relying solely on renewable energy transition. The most effective strategy depends on the specific resource context and national circumstances.
Marking:
- Level 1 (1–3 marks): Basic understanding of renewable energy and sustainability. Limited reference to Resource 2. One-sided argument with little development.
- Level 2 (4–6 marks): Good understanding with reference to Resource 2 and/or other examples. Some balance in argument but may lack depth in evaluation or a clear conclusion.
- Level 3 (7–8 marks): Comprehensive and balanced argument with clear reference to Resource 2 and relevant examples. Well-developed evaluation considering multiple strategies. Clear, reasoned conclusion. Quality of written communication is excellent with effective use of geographical terminology.
Common mistakes:
- Writing only about renewable energy without addressing "most effective"
- Failing to compare renewable energy with alternative strategies
- No reference to Resource 2 data
- No conclusion or a conclusion that does not answer the question
Section B: Structured Response Questions (20 marks)
Question 3
(a) Define the term energy security. [2]
Answer: Energy security refers to the uninterrupted availability of energy sources at an affordable price. It encompasses both the reliability of energy supply (physical availability) and the accessibility of energy at prices that do not disrupt economic performance.
Marking:
- [1] for identifying uninterrupted/ reliable availability of energy
- [1] for mentioning affordability/accessible pricing
Common mistakes:
- Defining only one aspect (availability OR affordability)
- Confusing energy security with energy efficiency
(b) Explain three strategies that a small island nation like Singapore can adopt to improve its energy security. [6]
Answer:
Strategy 1: Diversification of energy sources. Singapore currently relies heavily on natural gas (~95% of electricity generation). By diversifying into solar energy (target of 2 GWp by 2030), importing renewable electricity from regional neighbours, and exploring hydrogen fuel, Singapore can reduce dependence on any single energy source and mitigate supply disruption risks.
Strategy 2: Investment in energy storage and smart grid technology. Deploying battery energy storage systems (BESS) and developing a smart grid can help manage the intermittency of renewable energy, store excess energy during low-demand periods, and improve overall grid reliability and efficiency.
Strategy 3: Regional energy cooperation and imports. Singapore can participate in regional power grids (e.g., the ASEAN Power Grid initiative) to import renewable energy from neighbouring countries with greater renewable resources (e.g., hydropower from Laos, solar from Australia). This reduces reliance on domestic generation and enhances supply resilience.
Marking:
- [2] per strategy: [1] for identifying a valid strategy, [1] for clear explanation of how it improves energy security with reference to Singapore's context
- Acceptable strategies: diversification, energy efficiency measures, strategic fuel reserves, demand management, investment in R&D for new technologies, regional cooperation, energy storage
Common mistakes:
- Generic strategies not linked to Singapore's specific context (small island nation, limited land area, lack of natural resources)
- Listing strategies without explaining HOW they improve energy security
(c) Assess the effectiveness of nuclear energy as a strategy for improving energy security. [4]
Answer:
Effective aspects:
- Nuclear energy provides reliable baseload power with a very high capacity factor (~90%), meaning it can generate electricity continuously regardless of weather conditions, unlike solar or wind. This enhances supply reliability.
- A small amount of uranium produces a vast amount of energy (1 kg of uranium-235 can produce approximately 24,000,000 kWh of electricity), reducing dependence on large volumes of fuel imports and associated supply chain vulnerabilities.
- Nuclear power plants have long operational lifespans (40–60 years), providing long-term energy security.
Limitations:
- Nuclear energy requires significant capital investment and long construction times (typically 10–15 years), making it a slow solution to immediate energy security concerns.
- Safety concerns following disasters such as Fukushima (2011) and Chernobyl (1986) can lead to public opposition and political barriers, particularly for small, densely populated nations like Singapore where evacuation would be extremely difficult.
- Radioactive waste disposal remains an unresolved challenge, with waste remaining hazardous for thousands of years, posing long-term environmental and security risks.
- Uranium is a finite resource and many countries depend on imports from politically unstable regions, creating a different form of energy insecurity.
Conclusion: Nuclear energy can be effective for improving energy security in terms of reliability and energy density, but its effectiveness is limited by high costs, safety concerns, waste management challenges, and political feasibility, particularly for small nations.
Marking:
- [1–2] for advantages of nuclear energy for energy security
- [1–2] for limitations/challenges
- Award full marks for a balanced assessment with clear reasoning on both sides
Common mistakes:
- One-sided answer (only advantages or only disadvantages)
- Not linking specifically to energy security (e.g., discussing only environmental impacts)
Question 4
(a) Outline two characteristics of a circular economy. [2]
Answer:
Characteristic 1: Products and materials are designed for durability, reuse, refurbishment, and recycling, keeping them in the economic system for as long as possible rather than being disposed of after single use.
Characteristic 2: Waste is minimised or eliminated by treating waste from one process as a resource/input for another process (industrial symbiosis), creating closed-loop systems.
Marking:
- [1] per valid characteristic
- Acceptable characteristics: design for longevity, reuse/recycling, industrial symbiosis, waste-as-resource, product-as-a-service models, regenerative design
(b) With reference to a named example, explain how a circular economy approach can contribute to resource sustainability. [6]
Answer:
Named example: Kalundborg Symbiosis, Denmark
The Kalundborg Symbiosis is an industrial ecosystem where waste and by-products from one company become resources for another. Key exchanges include:
- The Asnæs Power Station supplies excess steam to the Novo Nordisk pharmaceutical plant and the Gyproc wallboard factory, reducing energy waste.
- Fly ash from the power station is used by cement manufacturers, diverting waste from landfills.
- Novo Nordisk's organic waste (biomass) is processed into fertiliser for local agriculture.
- Statoil refinery's cooling water is used by the power station, reducing freshwater consumption.
Contribution to resource sustainability:
- Reduced resource extraction: By reusing waste materials as inputs, the need to extract virgin raw materials is significantly reduced. For example, using fly ash in cement reduces the need to quarry limestone.
- Energy efficiency: Waste heat and steam are captured and reused, reducing overall energy demand. The symbiosis saves approximately 240,000 MWh of energy annually.
- Waste reduction: The network diverts thousands of tonnes of waste from landfills each year, reducing environmental pollution and the need for landfill space.
- Water conservation: Shared water systems reduce freshwater consumption by approximately 3.6 million m³ annually.
Marking:
- [1] for naming a valid example
- [2] for describing the circular economy approach in the named example
- [3] for explaining how the approach contributes to resource sustainability (at least two well-developed points)
- Acceptable examples: Kalundborg (Denmark), Japan's Sound Material-Cycle Society, Netherlands' circular economy strategy, Singapore's Zero Waste initiatives, Ellen MacArthur Foundation case studies
Common mistakes:
- Describing recycling without explaining the closed-loop/systemic nature of a circular economy
- Not naming a specific example
- Explaining the circular economy in general without linking to resource sustainability
Section C: Essay Question (10 marks)
Question 5
**"Population growth is the greatest threat to global resource sustainability." Evaluate this view. [10]
Answer:
Introduction: Resource sustainability refers to the management of natural resources to meet current needs without compromising the ability of future generations to meet their own needs. While population growth is a significant pressure on resources, it is one of several interconnected threats, and its impact varies by context.
Agree — population growth is a major threat:
- A growing global population (projected to reach 9.7 billion by 2050, UN estimates) increases demand for food, water, energy, and raw materials. The UN estimates that food production will need to increase by 60% by 2050 to feed the growing population.
- Rapid population growth in developing countries often leads to deforestation, land degradation, and overexploitation of water resources as communities expand agricultural land and settlements. For example, Ethiopia's population growth has contributed to deforestation rates of approximately 1.1% per year.
- Population growth in urban areas creates megacities with enormous resource demands. Cities like Lagos (Nigeria) and Dhaka (Bangladesh) face severe water scarcity, waste management challenges, and energy shortages due to rapid population growth outpacing infrastructure development.
Disagree — other threats are equally or more significant:
- Overconsumption in developed countries: The ecological footprint of high-income countries far exceeds that of low-income countries. The average American consumes approximately 8.1 global hectares of resources compared to 1.0 global hectare for the average Indian. Consumption patterns, not just population numbers, drive resource depletion.
- Inefficient resource use and waste: Approximately one-third of all food produced globally is wasted (FAO, ~1.3 billion tonnes/year). Industrial processes in many countries operate with low resource efficiency, meaning resources are depleted faster than necessary regardless of population size.
- Climate change: Climate change threatens resource sustainability through changing rainfall patterns (affecting water and food resources), rising sea levels (threatening coastal agricultural land), and extreme weather events (damaging infrastructure and crops). These impacts can be more immediately devastating than gradual population growth.
- Economic systems and governance: Market failures, lack of regulation, corruption, and poor governance can lead to unsustainable resource extraction even in countries with stable or declining populations. For example, deforestation in Brazil is driven more by agricultural commodity markets and weak enforcement than by population growth.
- Technological change: Technological innovation can decouple population growth from resource depletion. For example, the Green Revolution dramatically increased food production without proportional increases in land use, and desalination technology has enabled water-scarce countries like Israel and Singapore to meet water demands despite population growth.
Conclusion: Population growth is undoubtedly a significant threat to global resource sustainability, particularly in regions where it outpaces economic development and institutional capacity. However, it is not the greatest threat in isolation. Overconsumption, inefficient resource use, climate change, and poor governance are equally or more important drivers of unsustainability. The relationship between population and resources is mediated by technology, consumption patterns, and governance. A holistic approach addressing all these factors is necessary for achieving resource sustainability.
Marking:
- Level 1 (1–3 marks): Basic understanding of population and resources. Limited examples. One-sided argument. Poor structure.
- Level 2 (4–6 marks): Good understanding with some examples. Some balance but may lack depth. Attempt at evaluation. Reasonable structure.
- Level 3 (7–8 marks): Strong understanding with well-developed examples from different contexts. Balanced argument with clear evaluation. Good structure.
- Level 4 (9–10 marks): Comprehensive and sophisticated understanding with detailed, relevant examples. Thoroughly balanced evaluation considering multiple factors. Clear, well-reasoned conclusion that directly addresses the question. Excellent use of geographical terminology and effective written communication.
Common mistakes:
- Writing only about population growth without evaluating other threats
- Using vague statements without specific examples or data
- Not defining key terms (resource sustainability, population growth)
- No conclusion or a conclusion that merely restates the question
- Confusing population growth with urbanisation
Mark Total: Section A (30) + Section B (20) + Section C (10) = 60 marks
Free quiz and exam paper access
Enter your details to view this paper
Your access is remembered on this device.