From Real Exams Exam Paper
A Level H2 Geography Practice Paper 4
Free A Level H2 Geography Practice Paper 4, HY3 Exam version, with questions, answers, and A Level-style practice for Singapore students.
These static practice materials are generated from the site's syllabus and paper-generation workflow, with source and model context shown so students and parents can evaluate the material before use.
Questions
TuitionGoWhere Practice Paper - Geography H2 A-Level
School: TuitionGoWhere Exam Practice (AI)
Subject: Geography H2
Level: A-Level
Paper: Practice Paper (Version 4 of 5)
Duration: 1 hour 30 minutes
Total Marks: 80
Name: ______________________
Class: ______________________
Date: ______________________
Instructions:
- This practice paper contains Section A (Resources & Sustainability) and Section B (Integrated Application).
- Answer all questions in Section A and Section B.
- Use the resources provided. For visual-dependent items, the explicit image placeholders describe the required diagrams.
- Write your answers in the spaces provided.
Section A: Resources & Sustainability (50 marks)
Q1. Source/Data-Based
Resource 1 below shows the 2023 Sustainable City Index scores for four Southeast Asian cities across three dimensions: Environment (E), Economy (Ec), and Society (S). Scores range from 0 (poor) to 100 (excellent).
| City | E | Ec | S | Overall |
|---|---|---|---|---|
| Singapore | 82 | 88 | 79 | 83 |
| Kuala Lumpur | 64 | 71 | 68 | 68 |
| Jakarta | 51 | 63 | 54 | 56 |
| Manila | 47 | 59 | 52 | 53 |
Compare the scores for the four Southeast Asian cities shown in Resource 1. [5]
Q2. Source/Data-Based
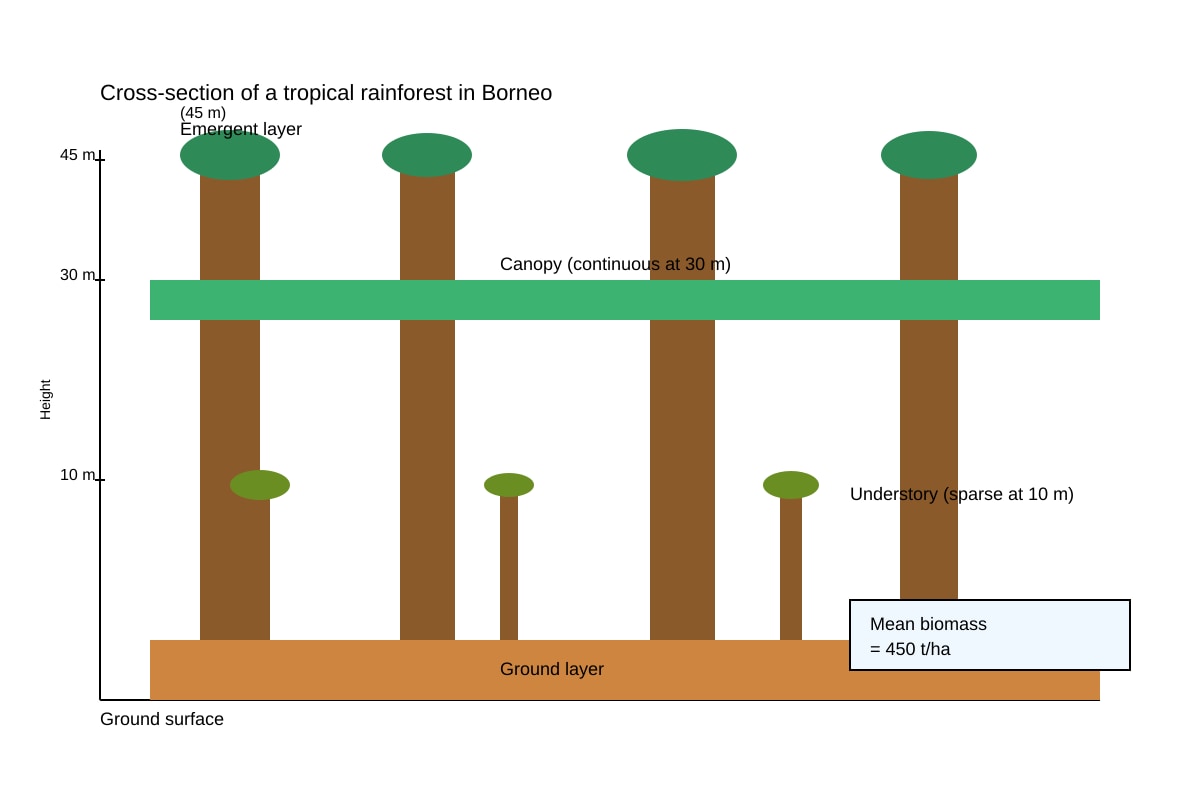
Describe the vegetation structure and mean biomass of a typical tropical rainforest in Borneo as shown in Resource 2. [3]
Image pending generation: diagram for Q2.
Q3. Source/Data-Based
Explain the processes that have contributed to the formation of the karst landscape shown in Resource 3. [7]
Image pending generation: diagram for Q3.
Q4. Short Answer
Identify two renewable resources and state one limitation of each for energy security. [4]
(a) Resource 1: __________ Limitation: ________________________ [2]
(b) Resource 2: __________ Limitation: ________________________ [2]
Q5. Structured Response
The table below shows proven and speculative reserves of a mineral (million tonnes).
| Type | Amount |
|---|---|
| Proven | 120 |
| Conditional | 80 |
| Hypothetical | 200 |
| Speculative | 150 |
(a) Define "proven reserves". [1]
(b) Explain why speculative reserves are less reliable for current supply planning. [2]
(c) Calculate the total of all reserve categories. [1]
Q6. Source/Data-Based
Resource 4 shows annual extractive output (tonnes) of a non-renewable resource by three firms in Region X.
| Firm | 2020 | 2023 |
|---|---|---|
| A | 5000 | 6200 |
| B | 4100 | 4000 |
| C | 3000 | 5100 |
Compare the changes in output between 2020 and 2023. [3]
Q7. Essay-style (Structured)
To what extent can solar power replace fossil fuels in Southeast Asia? Use the template of management of renewable energy from the syllabus. [10]
Q8. Source/Data-Based
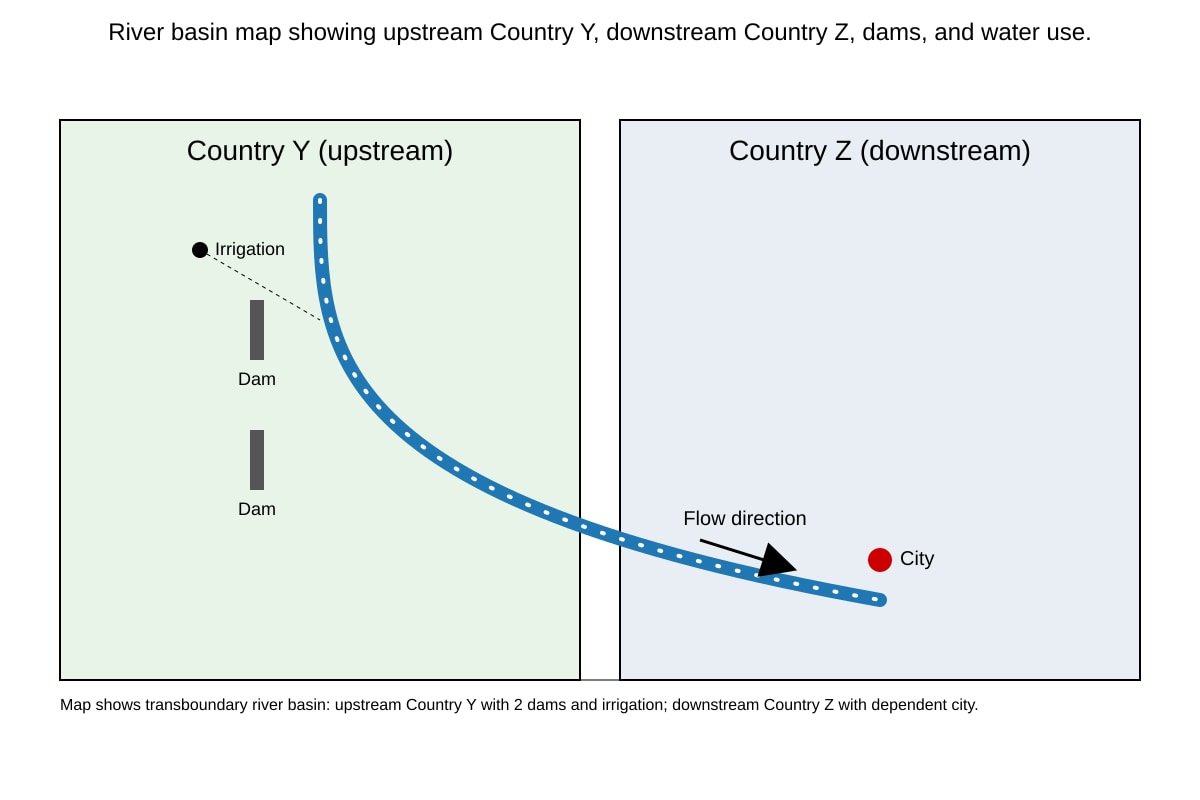
Resource 5 is a map of a transboundary river basin shared by Countries Y and Z.
Image pending generation: map for Q8.
Explain one potential conflict and one management strategy for the basin. [4]
Q9. Short Answer
State one provisioning and one regulating ecosystem service. [2]
(a) Provisioning: ________________________ [1]
(b) Regulating: ________________________ [1]
Q10. Calculation/Proof
A country uses 2 million barrels of oil per year. Its proven reserves are 20 million barrels. If consumption grows at 5% per year, calculate how many years until reserves are exhausted (use simple compound formula R=U(1.05n−1)/0.05 where R=reserves, U=initial use). [3]
Section B: Integrated Application (30 marks)
Q11. Source/Data-Based
Resource 6 shows SDG progress (%) for two countries on Goal 7 (Affordable Clean Energy) and Goal 12 (Responsible Consumption).
| Country | Goal 7 | Goal 12 |
|---|---|---|
| P | 74 | 61 |
| Q | 52 | 48 |
Compare and suggest a reason for the difference. [4]
Q12. Structured Response
Explain Boserup's view on technology and resource limits, and state one limitation of her view. [4]
Q13. Source/Data-Based
Resource 7 is a graph of renewable vs non-renewable share in total energy (%) for 2000 and 2023.
Image pending generation: graph for Q13.
Describe the trend and state one trade-off. [3]
Q14. Essay
"Resource scarcity is primarily a problem of distribution, not absolute shortage." Discuss with reference to Malthus and Boserup. [15]
Q15. Short Answer
Identify one human activity that compromises ecosystem services and state its impact. [2]
(a) Activity: ________________________ [1]
(b) Impact: ________________________ [1]
Section B Total: 30 marks
Paper Total: 80 marks
Answers
Answer Key - Geography H2 A-Level Practice Paper (Version 4)
Section A: Resources & Sustainability (50 marks)
Q1 [5]
Compare scores for Singapore, Kuala Lumpur, Jakarta, Manila.
- Singapore highest overall (83), leads in all dimensions (E82, Ec88, S79).
- Kuala Lumpur second (68), closest to Singapore in Economy (71).
- Jakarta (56) and Manila (53) lowest; Manila weakest in Environment (47).
- Gap between top and bottom ~30 points overall.
Marking: 1 mark per valid comparative point across cities/dimensions (max 5).
Q2 [3]
Typical Borneo rainforest: emergent layer ~45 m, continuous canopy at 30 m, sparse understory 10 m, ground layer; mean biomass 450 t/ha.
Marks: structure (1), layers described (1), biomass value (1).
Q3 [7]
Karst processes: limestone soluble; rain + CO₂ → H₂CO₃; dissolves CaCO₃ along joints; infiltration percolation; cave formation; sinkhole from collapse; spring at outlet. Climate: high rainfall accelerates.
Marks: rock type (1), chemical weathering eq (2), water movement (2), landforms (1), timescale/climate (1).
Q4 [4]
(a) Solar; limitation: intermittent, needs storage. (2)
(b) Hydropower; limitation: site-specific, ecological impact. (2)
Q5 [4]
(a) Proven: economically extractable at current price/tech. [1]
(b) Speculative: unknown feasibility, not for planning. [2]
(c) Total = 120+80+200+150 = 550 million tonnes [1]
Q6 [3]
Firm A +24%, B -2.4%, C +70%; C fastest growth, B declined.
Marks: each comparison 1.
Q7 [10]
Essay structured: solar potential reduces fossil dependence (env benefit), but limitations: land use, storage, grid (economic/social trade-offs). Extent: partial, not full replacement.
Descriptors: Knowledge 2, Analysis 4, Evaluation 4.
Q8 [4]
Conflict: Y dams reduce Z downstream flow. Strategy: bilateral water treaty / joint authority.
Marks: conflict (2), strategy (2).
Q9 [2]
(a) Provisioning: food, water. (b) Regulating: flood control, climate. 1 each.
Q10 [3]
20=2(1.05n−1)/0.05 → 20∗0.05/2=1.05n−1 → 0.5=1.05n−1 → 1.5=1.05n → n = ln1.5/ln1.05 ≈ 8.3 years.
Marks: formula sub (1), solve (1), answer (1).
Section B (30 marks)
Q11 [4]
P ahead of Q in both; reason: higher investment in infrastructure. 2 compare, 2 reason.
Q12 [4]
Boserup: tech expands resource base as pop grows. Limitation: uneven access, not automatic. 2 each.
Q13 [3]
Renewable up 10→25%, non down 90→75%. Trade-off: intermittency vs emissions. 2+1.
Q14 [15]
Essay: Malthus absolute limit, Boserup tech override; distribution unevenness key.
Descriptors: AO1 3, AO2 6, AO3 6.
Q15 [2]
(a) Activity: deforestation. (b) Impact: loss of habitat/regulating service. 1 each.
Free quiz and exam paper access
Enter your details to view this paper
Your access is remembered on this device.