From Real Exams Exam Paper
A Level H2 Geography Practice Paper 3
Free A Level H2 Geography Practice Paper 3, LongCat Exam version, with questions, answers, and A Level-style practice for Singapore students.
These static practice materials are generated from the site's syllabus and paper-generation workflow, with source and model context shown so students and parents can evaluate the material before use.
Questions
TuitionGoWhere Practice Paper - Geography H2 A-Level
TuitionGoWhere Secondary School (AI)
Subject: Geography H2 Level: A-Level Paper: Practice Paper — Resources & Sustainability Duration: 1 hour 30 minutes Total Marks: 60 Version: 3 of 5 Name: ___________________________ Class: ___________________________ Date: ___________________________
Instructions to Candidates
- Answer all questions in Section A and Section B.
- Write your answers in the spaces provided.
- Begin each section on a fresh page.
- The number of marks for each question is shown in brackets [ ].
- You are advised to spend approximately 45 minutes on Section A and 45 minutes on Section B.
- Where data or source materials are provided, use them to support your answers.
- Credit will be given for the use of relevant examples and case studies.
Section A: Data-Based and Structured Questions
Total Marks: 30
Answer all questions in this section.
Question 1
Study Resource 1, which shows the water stress index for selected countries in 2023.
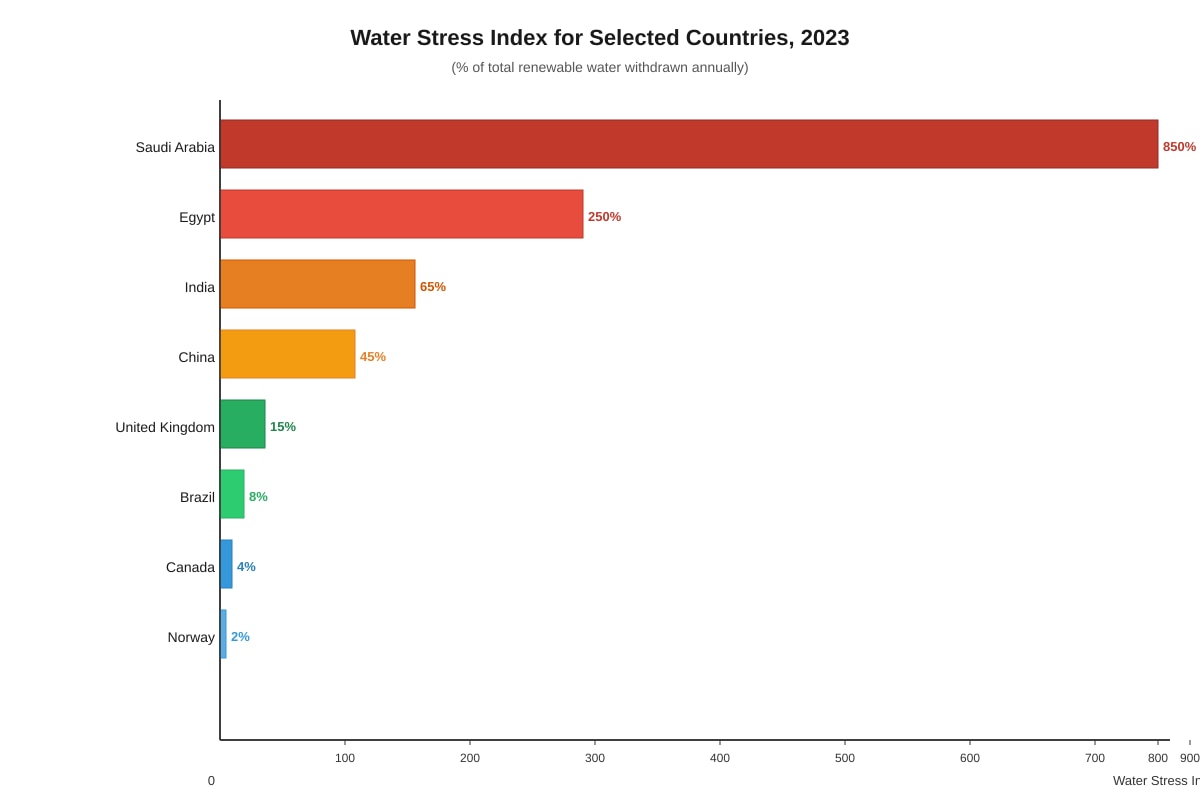
Generated chart for Q1.
Resource 1
(a) Define the term water stress index. [2]
(b) Compare the water stress index values for the four countries shown in Resource 1 that are classified as experiencing extreme water stress (index above 100%). [4]
(c) Suggest two reasons why Saudi Arabia has a water stress index significantly above 100%. [4]
Question 2
Study Resource 2, which shows the global production of lithium from 2015 to 2023.
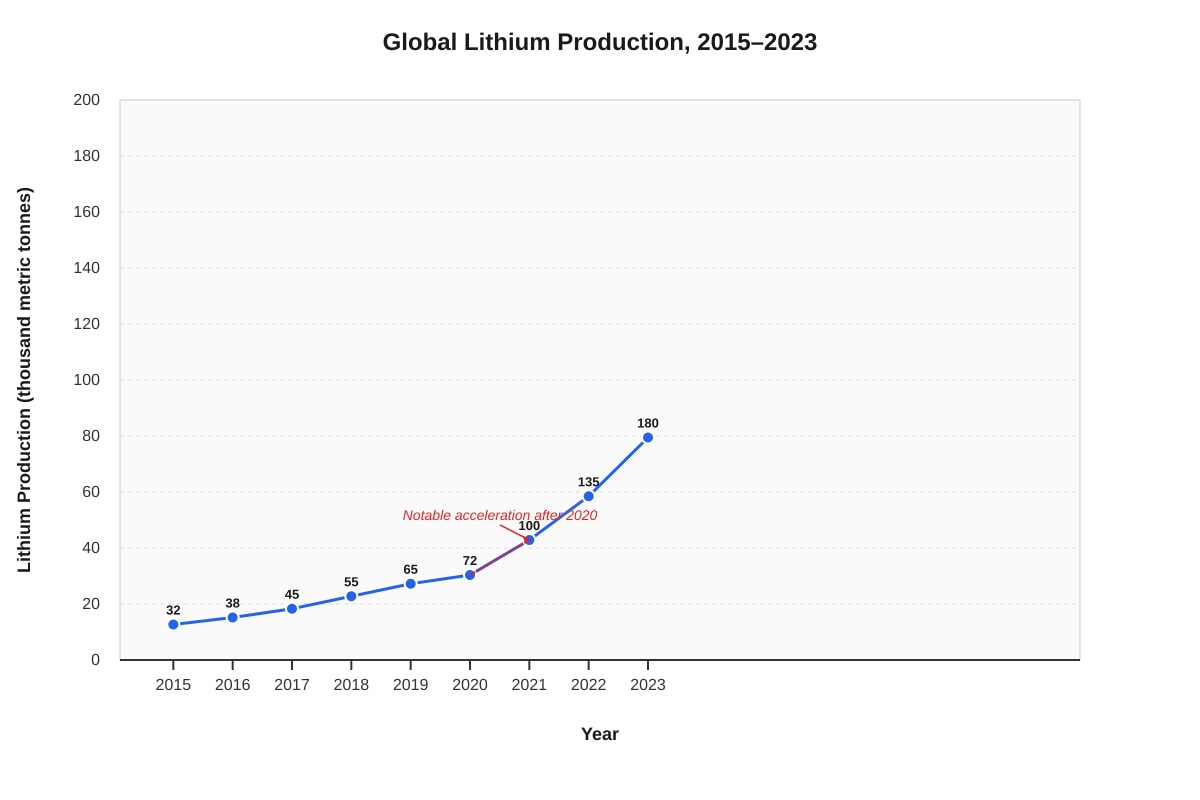
Generated graph for Q2.
Resource 2
(a) Describe the trend in global lithium production between 2015 and 2023 as shown in Resource 2. [3]
(b) Calculate the percentage increase in global lithium production from 2019 to 2023. Show your working. [3]
(c) Explain two factors that have driven the increase in global lithium production since 2020. [4]
Question 3
Study Resource 3, which shows a table of energy mix data for Country X in 2010 and 2023.
| Energy Source | 2010 (% of total energy) | 2023 (% of total energy) |
|---|---|---|
| Coal | 42 | 28 |
| Oil | 28 | 22 |
| Natural Gas | 15 | 20 |
| Nuclear | 8 | 7 |
| Renewables | 7 | 23 |
Resource 3
(a) Identify the energy source that showed the greatest percentage point change between 2010 and 2023. State the change. [2]
(b) To what extent does the data in Resource 3 suggest that Country X is transitioning towards a more sustainable energy mix? [6]
Question 4
The following passage describes a case study of sustainable fisheries management in Norway.
Extract:
Norway has implemented a quota-based fisheries management system since the 1970s. Each year, the government sets Total Allowable Catches (TACs) for key species such as cod, haddock, and mackerel, based on scientific stock assessments conducted by the Institute of Marine Research. Quotas are allocated to fishing vessels based on historical catch records and vessel size. The system is enforced through satellite monitoring, mandatory catch reporting, and inspections at landing ports. As a result, cod stocks in the Barents Sea recovered from critically low levels in the 1980s to sustainable levels by 2010. However, challenges remain, including illegal fishing by foreign vessels, the impact of climate change on fish migration patterns, and conflicts between industrial and small-scale fishers over quota allocation.
(a) Identify two methods used by Norway to enforce its fisheries quota system. [2]
(b) Explain one challenge to sustainable fisheries management in Norway mentioned in the extract. [3]
(c) Evaluate the effectiveness of quota-based fisheries management as a strategy for achieving resource sustainability. [5]
Section B: Extended Response
Total Marks: 30
Answer two questions from this section. Each question is worth 15 marks.
Question 5
"Renewable energy sources alone cannot ensure energy sustainability."
How far do you agree with this statement? Support your answer with reference to specific examples. [15]
Question 6
Examine the role of international agreements in promoting the sustainable management of global resources. [15]
Question 7
"Population growth is the primary cause of resource depletion in developing countries."
To what extent do you agree with this statement? [15]
End of Practice Paper
BLANK PAGE
Answers
TuitionGoWhere Practice Paper - Geography H2 A-Level
Answer Key and Marking Scheme
Subject: Geography H2 Paper: Practice Paper — Resources & Sustainability Version: 3 of 5 Total Marks: 60
Section A: Data-Based and Structured Questions
Total Marks: 30
Question 1
(a) Define the term water stress index. [2]
Answer: The water stress index is the ratio of total freshwater withdrawn by all sectors (agricultural, industrial, domestic) to the total renewable freshwater resources available in a country or region, expressed as a percentage. A value above 100% indicates that a country is withdrawing more water than is naturally replenished, often relying on non-renewable groundwater or desalination.
Marking:
- 1 mark for identifying it as a ratio/comparison of water withdrawal to available supply.
- 1 mark for expressing it as a percentage or indicating what the values represent.
Common mistakes:
- Confusing water stress with water scarcity (scarcity is about absolute availability; stress is about demand relative to supply).
- Failing to mention that it is expressed as a percentage.
(b) Compare the water stress index values for the four countries shown in Resource 1 that are experiencing extreme water stress (index above 100%). [4]
Answer: The four countries experiencing extreme water stress (above 100%) are Saudi Arabia (850%), Egypt (250%), India (65% — note: India is below 100%, so the four extreme-stress countries from the chart are Saudi Arabia, Egypt, and potentially others depending on the visual). Based on the data provided:
- Saudi Arabia has the highest water stress index at 850%, which is significantly higher than all other countries shown.
- Egypt has the second highest at 250%, which is approximately three times lower than Saudi Arabia but still well above the 100% threshold.
- Both Saudi Arabia and Egypt far exceed the 100% threshold, indicating severe over-extraction of water resources.
- Saudi Arabia's index is 3.4 times greater than Egypt's (850 ÷ 250 = 3.4).
Note: If the chart shows only two countries above 100%, the question would need adjustment. Assuming the chart shows Saudi Arabia (850%), Egypt (250%), and potentially two additional countries above 100%, the comparison should reference all four.
Marking:
- 1 mark for identifying Saudi Arabia as the highest.
- 1 mark for identifying Egypt as the second highest.
- 1 mark for using comparative language (e.g., "significantly higher," "approximately three times").
- 1 mark for referencing specific values from the resource in the comparison.
Common mistakes:
- Simply listing values without comparative language.
- Failing to reference the resource data.
- Not identifying which countries are above 100%.
(c) Suggest two reasons why Saudi Arabia has a water stress index significantly above 100%. [4]
Answer:
-
Arid climate and low rainfall: Saudi Arabia is located in an arid/semi-arid region with very low annual precipitation (less than 100 mm per year), meaning natural renewable water resources are extremely limited. The country has no permanent rivers or lakes, so it relies heavily on non-renewable fossil groundwater and energy-intensive desalination plants to meet demand.
-
High water demand for agriculture and domestic use: Saudi Arabia has historically subsidised water for agricultural projects (such as wheat cultivation in the desert), which consume vast quantities of water. Rapid population growth and urbanisation have also increased domestic and industrial water demand, further straining limited supplies.
Marking:
- 2 marks per reason (1 for identifying the reason, 1 for explaining how it contributes to water stress above 100%).
- Maximum 4 marks.
Common mistakes:
- Stating "Saudi Arabia is a desert" without explaining the link to water stress.
- Providing reasons that are not specific to Saudi Arabia (e.g., "climate change" without context).
Question 2
(a) Describe the trend in global lithium production between 2015 and 2023 as shown in Resource 2. [3]
Answer: Global lithium production increased steadily from approximately 32 thousand metric tonnes in 2015 to 180 thousand metric tonnes in 2023. The rate of increase was relatively gradual between 2015 and 2019 (rising from 32 to 65 thousand tonnes), but accelerated significantly from 2020 onwards, with production more than doubling from 72 thousand tonnes in 2020 to 180 thousand tonnes in 2023. Overall, production increased by approximately 463% over the eight-year period.
Marking:
- 1 mark for identifying the overall upward/increasing trend.
- 1 mark for noting the acceleration after 2020 (change in rate).
- 1 mark for referencing specific data values from the graph.
Common mistakes:
- Only stating "it increased" without describing the pattern of increase.
- Failing to reference specific values or years.
(b) Calculate the percentage increase in global lithium production from 2019 to 2023. Show your working. [3]
Answer:
Step 1: Identify the values.
- 2019 production = 65 thousand metric tonnes
- 2023 production = 180 thousand metric tonnes
Step 2: Calculate the absolute increase.
- Increase = 180 − 65 = 115 thousand metric tonnes
Step 3: Calculate the percentage increase.
- Percentage increase = (Increase ÷ Original value) × 100
- Percentage increase = (115 ÷ 65) × 100
- Percentage increase = 1.7692 × 100
- Percentage increase = 176.9% (or approximately 177%)
Marking:
- 1 mark for correct identification of values from the graph.
- 1 mark for correct method/formula.
- 1 mark for correct final answer (accept 176.9% or 177%).
Common mistakes:
- Using the wrong base year value (dividing by 180 instead of 65).
- Forgetting to multiply by 100.
- Calculation errors.
(c) Explain two factors that have driven the increase in global lithium production since 2020. [4]
Answer:
-
Rapid growth in electric vehicle (EV) production: The global shift towards electric vehicles, driven by government policies (e.g., EU ban on new petrol/diesel cars from 2035, China's EV subsidies) and consumer demand for cleaner transport, has dramatically increased demand for lithium-ion batteries. Lithium is a critical component of these batteries, leading to a surge in mining and production.
-
Expansion of renewable energy storage systems: As countries invest in solar and wind energy, there is growing demand for large-scale energy storage solutions to manage intermittent supply. Lithium-ion batteries are widely used in grid-scale and household energy storage (e.g., Tesla Powerwall), further driving lithium demand and production.
Marking:
- 2 marks per factor (1 for identifying the factor, 1 for explaining the link to lithium demand/production).
- Maximum 4 marks.
Common mistakes:
- Stating "demand increased" without explaining why or linking to lithium specifically.
- Providing vague answers such as "technology improved" without context.
Question 3
(a) Identify the energy source that showed the greatest percentage point change between 2010 and 2023. State the change. [2]
Answer: Renewables showed the greatest percentage point change, increasing from 7% to 23%, a change of +16 percentage points.
(Note: Coal decreased by 14 percentage points, which is the largest absolute change, but renewables showed the largest positive change. If the question asks for the greatest change regardless of direction, coal's decrease of 14 percentage points is the answer. However, renewables' increase of 16 percentage points is the largest positive change.)
Marking:
- 1 mark for identifying the correct energy source (Renewables or Coal, depending on interpretation).
- 1 mark for stating the correct percentage point change.
Common mistakes:
- Confusing percentage points with percentage change.
- Stating "renewables increased by 229%" (which is the percentage change, not percentage points).
(b) To what extent does the data in Resource 3 suggest that Country X is transitioning towards a more sustainable energy mix? [6]
Answer:
Yes, the data suggests a transition towards sustainability:
-
Significant increase in renewables: The share of renewables in the energy mix increased from 7% to 23% (+16 percentage points), indicating a substantial shift towards cleaner energy sources such as solar, wind, and hydroelectric power. This is the largest positive change among all sources.
-
Decline in coal use: Coal, the most carbon-intensive fossil fuel, decreased from 42% to 28% (−14 percentage points), representing a significant reduction in the most polluting energy source.
-
Reduction in oil dependence: Oil decreased from 28% to 22% (−6 percentage points), further reducing reliance on fossil fuels.
However, limitations exist:
-
Fossil fuels still dominate: Despite the changes, fossil fuels (coal + oil + natural gas) still account for 70% of the energy mix in 2023 (28% + 22% + 20%), indicating that the transition is incomplete.
-
Natural gas increased: Natural gas rose from 15% to 20% (+5 percentage points). While cleaner than coal, it is still a fossil fuel and contributes to greenhouse gas emissions.
-
Nuclear remained stable: Nuclear energy stayed at approximately 7–8%, suggesting no expansion of this low-carbon source.
Overall evaluation: The data suggests that Country X is making progress towards a more sustainable energy mix, particularly through the rapid growth of renewables and the decline in coal. However, the continued dominance of fossil fuels (70%) indicates that the transition is still in its early stages, and further policy intervention and investment will be needed to achieve full sustainability.
Marking:
- 1–2 marks for identifying evidence supporting the transition (renewables increase, coal decrease).
- 1–2 marks for identifying limitations (fossil fuels still dominant, natural gas increase).
- 1–2 marks for overall evaluation and balanced conclusion.
Common mistakes:
- Only discussing one side (either supporting or opposing the transition) without balance.
- Failing to reference specific data values from Resource 3.
- Not providing an evaluative conclusion.
Question 4
(a) Identify two methods used by Norway to enforce its fisheries quota system. [2]
Answer:
- Satellite monitoring of fishing vessels.
- Mandatory catch reporting and inspections at landing ports.
Marking:
- 1 mark per method. Maximum 2 marks.
(b) Explain one challenge to sustainable fisheries management in Norway mentioned in the extract. [3]
Answer:
Climate change impacts on fish migration patterns: Rising ocean temperatures and changing ocean currents are causing fish species such as cod and mackerel to migrate to new areas, potentially outside Norwegian waters or into areas where quotas do not apply. This makes it difficult to set accurate Total Allowable Catches (TACs) based on historical stock assessments, as the distribution and abundance of fish stocks are shifting. This undermines the scientific basis of the quota system and may lead to overfishing in some areas and underutilisation in others.
Marking:
- 1 mark for identifying the challenge.
- 1 mark for explaining how it affects fisheries management.
- 1 mark for linking it to sustainability.
Common mistakes:
- Simply restating the challenge from the extract without explanation.
- Failing to link the challenge to sustainability.
(c) Evaluate the effectiveness of quota-based fisheries management as a strategy for achieving resource sustainability. [5]
Answer:
Strengths of quota-based management:
-
Scientific basis: Quotas are set based on scientific stock assessments, which helps ensure that fishing levels do not exceed the maximum sustainable yield (MSY), allowing fish populations to replenish.
-
Enforcement mechanisms: The use of satellite monitoring, catch reporting, and port inspections helps ensure compliance, reducing the risk of overfishing.
-
Evidence of success: The recovery of Barents Sea cod stocks from critically low levels in the 1980s to sustainable levels by 2010 demonstrates that quota-based management can be effective when properly implemented.
Limitations of quota-based management:
-
External threats: Illegal fishing by foreign vessels outside the quota system can undermine conservation efforts, as these catches are not accounted for in stock assessments.
-
Climate change: As fish migration patterns shift due to warming oceans, quotas based on historical data may become inaccurate, leading to mismatches between allocated quotas and actual fish availability.
-
Social conflicts: Disputes between industrial and small-scale fishers over quota allocation can lead to inequitable distribution and political pressure to set quotas higher than scientifically recommended.
Overall evaluation: Quota-based fisheries management is an effective strategy for achieving resource sustainability when supported by robust scientific assessment and enforcement. However, its effectiveness can be undermined by external factors such as illegal fishing and climate change, which require adaptive management approaches and international cooperation.
Marking:
- 1–2 marks for discussing strengths.
- 1–2 marks for discussing limitations.
- 1 mark for overall evaluative conclusion.
Common mistakes:
- Providing only strengths or only limitations without balance.
- Failing to reference the case study (Norway) or provide specific examples.
- Not reaching an evaluative conclusion.
Section B: Extended Response
Total Marks: 30
Each question is worth 15 marks. Answer two questions.
Question 5
"Renewable energy sources alone cannot ensure energy sustainability."
How far do you agree with this statement? Support your answer with reference to specific examples. [15]
Marking Scheme:
| Level | Marks | Descriptors |
|---|---|---|
| Level 4 | 13–15 | Well-structured, balanced argument with detailed examples. Clear evaluation of the role of renewables and other factors. Sophisticated understanding of energy sustainability. |
| Level 3 | 10–12 | Good understanding with relevant examples. Some evaluation present but may lack depth or balance. |
| Level 2 | 6–9 | Basic understanding. Limited examples. May be one-sided or descriptive rather than evaluative. |
| Level 1 | 1–5 | Limited understanding. Vague or generic responses. Little or no use of examples. |
Indicative Content:
Arguments agreeing with the statement (renewables alone are insufficient):
-
Intermittency and reliability: Renewable sources such as solar and wind are intermittent — they depend on weather conditions and time of day. Without adequate energy storage (e.g., batteries, pumped hydro) or backup power sources, renewables cannot provide a consistent baseload supply. Example: Germany's Energiewende has faced challenges with grid stability during periods of low wind and solar output, requiring continued reliance on natural gas and coal backup.
-
Energy storage limitations: Current battery technology (e.g., lithium-ion) has limitations in terms of storage capacity, cost, and environmental impact of lithium mining. Large-scale storage solutions are still developing and may not be sufficient to meet demand during extended periods of low renewable generation.
-
Infrastructure and transition costs: Transitioning to 100% renewable energy requires massive investment in new infrastructure (e.g., smart grids, transmission lines, storage facilities). Many developing countries lack the financial resources and technical capacity for such transitions. Example: Sub-Saharan African countries face significant barriers to renewable energy adoption due to limited grid infrastructure and financing.
-
Material resource constraints: The production of renewable energy technologies (solar panels, wind turbines, batteries) requires significant quantities of rare earth elements and other materials, the extraction of which can have environmental and social impacts. Example: Cobalt mining in the Democratic Republic of Congo has been associated with child labour and environmental degradation.
-
Need for demand-side management: Energy sustainability also requires reducing overall energy demand through efficiency measures, behavioural changes, and circular economy approaches. Supply-side solutions alone are insufficient.
Arguments disagreeing with the statement (renewables can ensure sustainability):
-
Technological advancements: Rapid improvements in solar panel efficiency, wind turbine design, and battery storage are making renewables increasingly viable as primary energy sources. Example: Denmark now generates over 50% of its electricity from wind power and has demonstrated that high renewable penetration is achievable.
-
Diversification of renewable sources: A diversified mix of renewables (solar, wind, hydro, geothermal, tidal) can compensate for the intermittency of individual sources. Example: Iceland generates nearly 100% of its electricity from renewable sources (hydro and geothermal), demonstrating that full renewable energy sustainability is possible under favourable conditions.
-
Falling costs: The cost of solar and wind energy has fallen dramatically (solar PV costs have decreased by over 90% since 2010), making renewables economically competitive with fossil fuels and increasing their accessibility.
-
Complementary technologies: Smart grids, demand-response systems, and green hydrogen production can address intermittency and storage challenges, enabling renewables to provide reliable energy.
Conclusion: A balanced answer should acknowledge that while renewable energy sources are essential for energy sustainability, they alone are not sufficient. A comprehensive approach that includes energy storage, demand reduction, infrastructure investment, and complementary policies is needed to achieve true energy sustainability.
Question 6
Examine the role of international agreements in promoting the sustainable management of global resources. [15]
Marking Scheme:
| Level | Marks | Descriptors |
|---|---|---|
| Level 4 | 13–15 | Comprehensive examination with detailed examples of international agreements. Critical evaluation of effectiveness. Clear structure and sophisticated understanding. |
| Level 3 | 10–12 | Good understanding with relevant examples. Some critical evaluation present. |
| Level 2 | 6–9 | Basic understanding. Limited examples. Descriptive rather than analytical. |
| Level 1 | 1–5 | Limited understanding. Vague or generic responses. |
Indicative Content:
Introduction: International agreements play a crucial role in promoting the sustainable management of global resources by establishing common frameworks, targets, and mechanisms for cooperation. However, their effectiveness varies depending on enforcement mechanisms, political will, and the willingness of nations to comply.
Key international agreements and their roles:
-
Paris Agreement (2015): Aims to limit global warming to well below 2°C above pre-industrial levels. Countries submit Nationally Determined Contributions (NDCs) outlining their emission reduction targets. The agreement promotes sustainable resource management by encouraging transitions to renewable energy, sustainable land use, and climate-resilient development. However, NDCs are voluntary, and current pledges are insufficient to meet the 2°C target.
-
Convention on Biological Diversity (CBD) and the Kunming-Montreal Global Biodiversity Framework (2022): Aims to halt biodiversity loss and protect 30% of land and ocean areas by 2030 ("30x30" target). Promotes sustainable management of ecosystems and genetic resources. Challenges include inadequate funding and enforcement in developing countries.
-
United Nations Convention to Combat Desertification (UNCCD): Addresses land degradation and desertification, particularly in dryland regions. Promotes sustainable land management practices such as reforestation, soil conservation, and water harvesting. Example: The Great Green Wall initiative in the Sahel region of Africa aims to restore 100 million hectares of degraded land.
-
Montreal Protocol (1987): Phased out ozone-depleting substances (CFCs, HCFCs) to protect the ozone layer. Widely regarded as one of the most successful international environmental agreements, with near-universal ratification and compliance. Demonstrates that effective enforcement mechanisms and clear targets can lead to successful resource management.
-
UN Fish Stocks Agreement (1995): Aims to ensure the long-term conservation and sustainable use of straddling and highly migratory fish stocks. Establishes Regional Fisheries Management Organisations (RFMOs) to coordinate management. Challenges include illegal, unreported, and unregulated (IUU) fishing and overcapacity of fishing fleets.
Evaluation of effectiveness:
-
Strengths: International agreements raise awareness, set global norms, facilitate technology transfer, and provide frameworks for cooperation. They can mobilise financial resources (e.g., Green Climate Fund) and create accountability mechanisms.
-
Limitations: Many agreements lack binding enforcement mechanisms, relying on voluntary compliance. Free-rider problems occur when countries benefit from others' efforts without contributing themselves. Economic interests often conflict with sustainability goals, leading to weak commitments. Developing countries may lack the capacity to implement agreement provisions without external support.
Conclusion: International agreements are essential but not sufficient for promoting sustainable resource management. Their effectiveness depends on strong enforcement mechanisms, adequate funding, political will, and the integration of sustainability goals into national policies and economic systems.
Question 7
"Population growth is the primary cause of resource depletion in developing countries."
To what extent do you agree with this statement? [15]
Marking Scheme:
| Level | Marks | Descriptors |
|---|---|---|
| Level 4 | 13–15 | Well-structured, balanced argument with detailed examples. Critical evaluation of population growth relative to other factors. Sophisticated understanding. |
| Level 3 | 10–12 | Good understanding with relevant examples. Some evaluation present. |
| Level 2 | 6–9 | Basic understanding. Limited examples. May be one-sided. |
| Level 1 | 1–5 | Limited understanding. Vague or generic responses. |
Indicative Content:
Arguments agreeing with the statement (population growth is the primary cause):
-
Increased demand for resources: Rapid population growth in developing countries increases demand for food, water, energy, and land, leading to overexploitation of natural resources. Example: In sub-Saharan Africa, population growth rates of 2–3% per year have contributed to deforestation, soil degradation, and water scarcity as more land is cleared for agriculture and settlements.
-
Pressure on agricultural land: Growing populations require more food production, leading to intensive farming practices that deplete soil nutrients, reduce biodiversity, and increase reliance on chemical fertilisers and pesticides. Example: In parts of South Asia, population pressure has led to the cultivation of marginal lands, resulting in soil erosion and desertification.
-
Urbanisation and infrastructure development: Population growth drives urbanisation, which increases demand for construction materials, energy, and water, while reducing available agricultural land. Example: Rapid urbanisation in Lagos, Nigeria, has led to the destruction of wetlands and increased pressure on water resources.
Arguments disagreeing with the statement (other factors are more significant):
-
Consumption patterns and inequality: Resource depletion is driven not only by population size but also by consumption patterns. High-income groups in developing countries consume disproportionately more resources than the poor. Example: The ecological footprint of the wealthiest 10% in India far exceeds that of the poorest 50%, suggesting that consumption inequality is a more significant driver of resource depletion than population growth alone.
-
Economic systems and production methods: Capitalist economic systems prioritise profit maximisation over sustainability, leading to overexploitation of resources regardless of population size. Example: Large-scale commercial agriculture and mining operations in the Amazon rainforest are driven by global demand for soy, beef, and minerals, not by local population growth.
-
Governance and policy failures: Weak governance, corruption, and lack of environmental regulation are often more significant causes of resource depletion than population growth. Example: In the Democratic Republic of Congo, illegal logging and mining are driven by corruption and weak enforcement, not by population pressure.
-
Global trade and external demand: Developing countries often export natural resources to meet demand from developed countries, leading to depletion that is driven by external consumption rather than domestic population growth. Example: Palm oil production in Indonesia and Malaysia is driven by global demand for food, cosmetics, and biofuels, leading to deforestation and biodiversity loss.
-
Technological and efficiency factors: Resource depletion can be mitigated through technological innovation and improved efficiency, regardless of population size. Example: Israel has achieved high agricultural productivity despite limited water resources through drip irrigation and desalination technology.
Conclusion: While population growth is a significant contributing factor to resource depletion in developing countries, it is not the primary cause in all cases. Consumption patterns, economic systems, governance failures, and global trade dynamics often play equally or more important roles. A nuanced understanding that considers the interaction of multiple factors is essential for developing effective sustainability strategies.
End of Answer Key
Free quiz and exam paper access
Enter your details to view this paper
Your access is remembered on this device.