From Real Exams Exam Paper
A Level H2 Geography Practice Paper 3
Free A Level H2 Geography Practice Paper 3, HY3 Exam version, with questions, answers, and A Level-style practice for Singapore students.
These static practice materials are generated from the site's syllabus and paper-generation workflow, with source and model context shown so students and parents can evaluate the material before use.
Questions
Free quiz and exam paper access
Enter your details to view this paper
Your access is remembered on this device.
Answers
Answer Key – TuitionGoWhere Practice Paper Geography H2 A-Level (Version 3)
Total Marks: 70
Section A: 30 marks
Section B: 20 marks
Section C: 20 marks
Section A Answers
Q1(a) [1 mark]
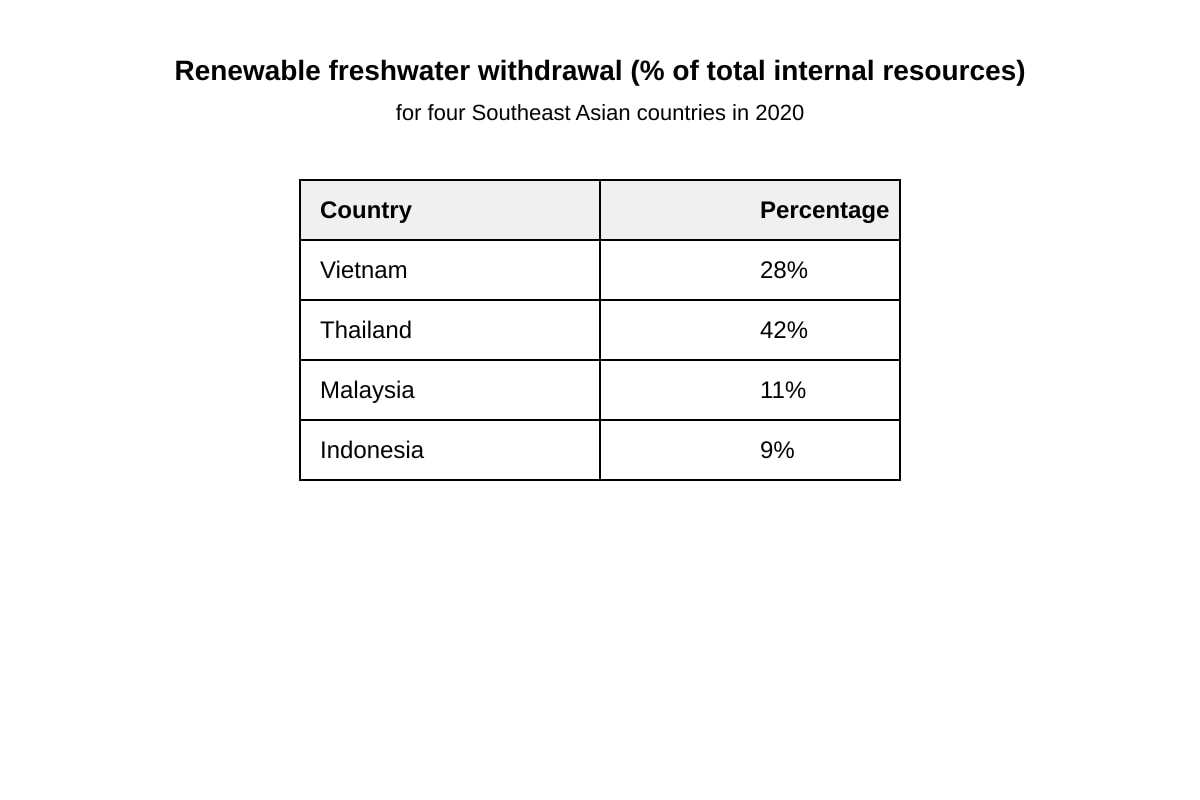
Answer: Indonesia (9%).
Teaching note: Lowest withdrawal % means smallest share of internal renewable water used. From Resource 1, Indonesia = 9%, Malaysia = 11%, Vietnam = 28%, Thailand = 42%.
Q1(b) [5 marks]
Mark breakdown: compare across all 4 countries (1m), use comparative language (1m), identify highest/lowest (1m), note mid-range (1m), synthesize pattern (1m).
Answer: Thailand had the highest withdrawal at 42%, followed by Vietnam (28%), then Malaysia (11%), with Indonesia lowest at 9%. Thailand and Vietnam withdraw over a quarter of internal resources, indicating higher pressure on water, while Malaysia and Indonesia use less than 12%, showing greater unused capacity.
Common mistake: listing numbers without "higher/lower than".
Q1(c) [4 marks]
Answer: Developing economies may lack capital to build efficient treatment plants, leading to overexploitation; political priority on growth over environment also limits sustainability. (2 points × 2m)
Teaching: Economic challenge = scarcity of funds / short-term growth focus.
Q2(a) [3 marks]
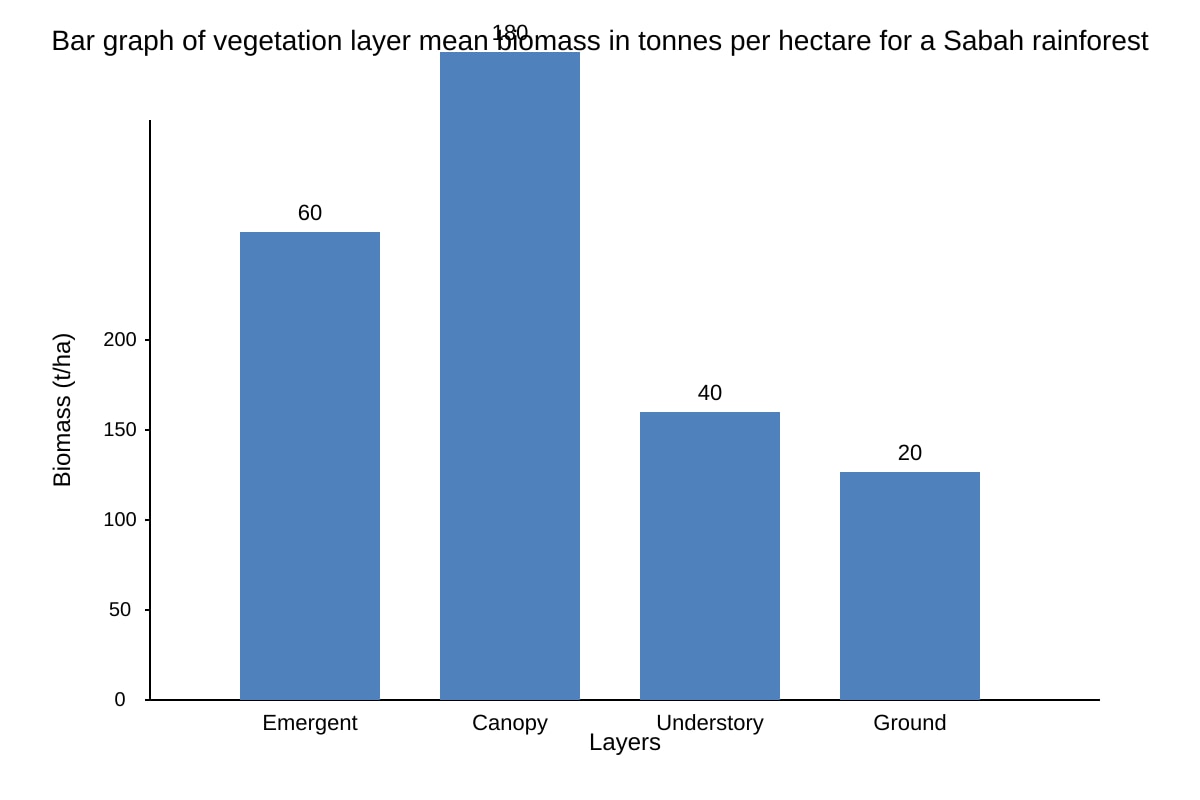
Answer: Structure has emergent (60 t/ha), continuous canopy (180), understory (40), ground (20). Total mean biomass = 300 t/ha. Dense canopy dominates.
From Resource 2 bar graph.
Q2(b) [4 marks]
Provisioning service e.g., timber (1m). Demand/technology shift: as demand for biofuels rises, crop residues become energy source not waste (3m explanation).
Q2(c) [5 marks]
Extractive industries cause habitat destruction (1m), pollution (1m), invasive species introduction (1m); each reduces regulating services like flood control (2m).
Teaching: Regulating = climate, water flow control.
Q3(a) [2 marks]
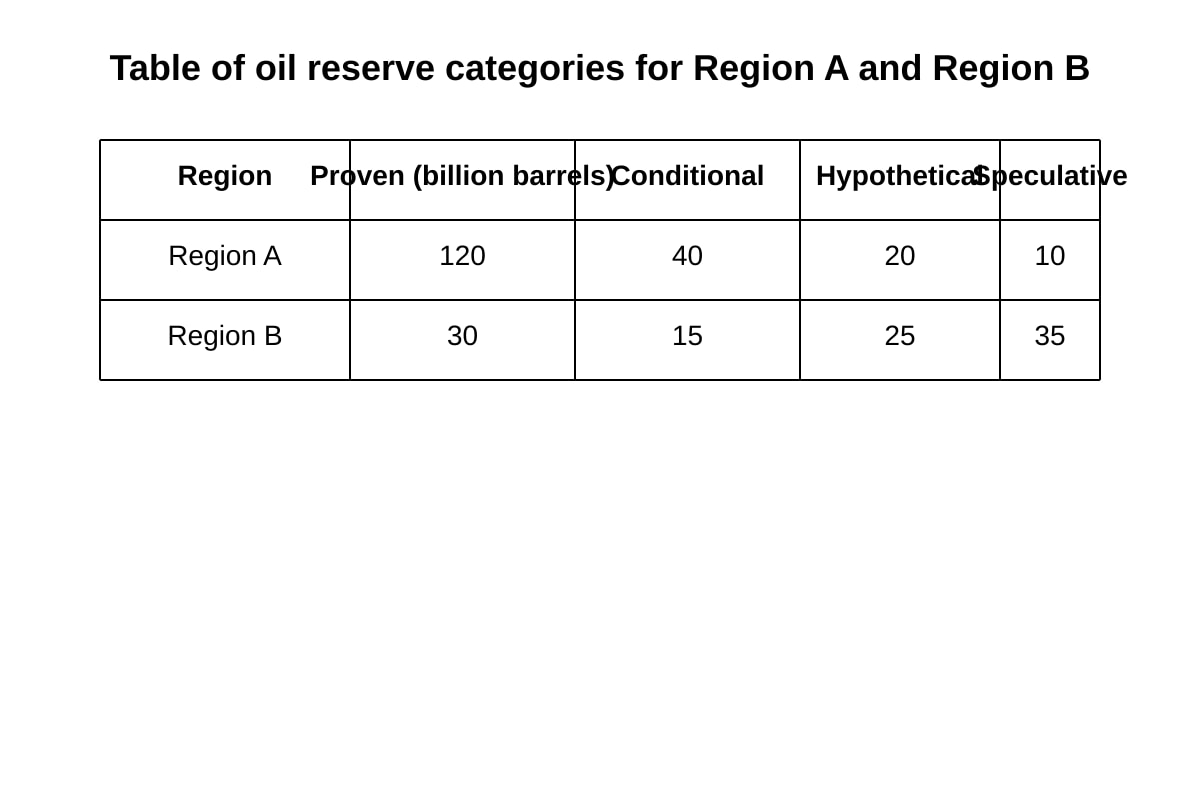
Proven = discovered, recoverable under current tech/econ (1m). Speculative = suspected but undiscovered (1m).
Q3(b) [4 marks]
Region A proven-dominated (120 vs 10 spec). Region B more balanced/speculative-heavy (30 proven, 35 spec). A = developed extraction, B = uncertain. (Compare 2 regions × 2m)
Q3(c) [6 marks]
Boserup: tech expands resource base (2m). Malthus: fixed limits (2m). Extent: tech delays but non-renewable finite so partial (2m).
Descriptors: L3 balanced judgement.
Section B Answers
Q4(a) [2 marks]
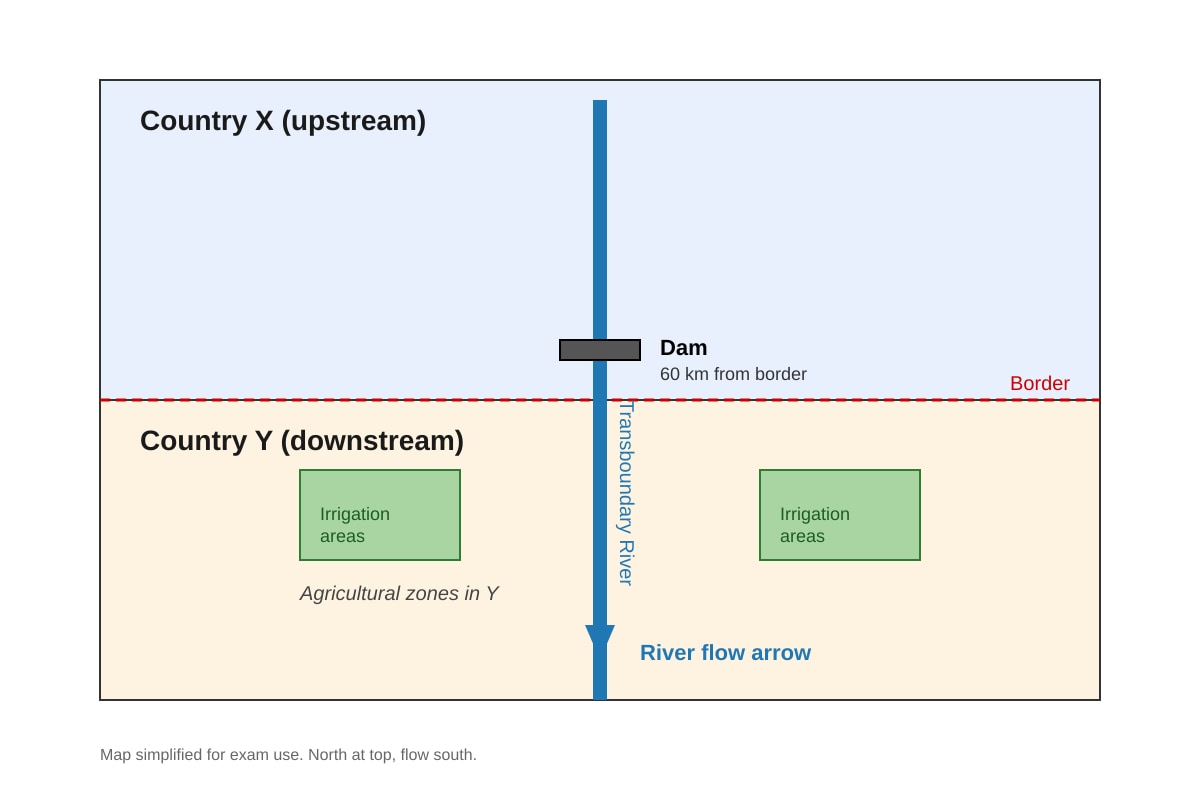
Dam in X reduces flow to Y irrigation (1m + context 1m).
Q4(b) [6 marks]
Success varies by cooperation (treaties 2m), power asymmetry (2m), data sharing (2m).
Q4(c) [4 marks]
Strategies: rainwater harvesting, efficiency irrigation (2m each).
Q5(a) [2 marks]
Area = 2500 / 500 = 5 km². Working: MWh needed ÷ MWh per km².
Q5(b) [3 marks]
Solar need = 60% × 2500 = 1500 MWh. Area = 1500/500 = 3 km². Steps shown.
Q5(c) [3 marks]
Limitation: intermittent supply / land use conflict (explain 3m).
Section C Essay Answers
Q6 [20 marks]
Descriptors: Knowledge 4, Analysis 8, Eval 8.
Content: renewables reduce fossil dependence (solar/hydro potential 4m), trade-offs: land, social, intermittency (6m), conclusion partial agreement (4m).
Evidence points from syllabus.
Q7 [20 marks]
Success: SDG 6 progress via treaties (6m), challenges: unequal power (6m), conclusion varied (8m).
Marking: L3 evaluative.