From Real Exams Exam Paper
A Level H2 Geography Practice Paper 2
Free A Level H2 Geography Practice Paper 2, LongCat Exam version, with questions, answers, and A Level-style practice for Singapore students.
These static practice materials are generated from the site's syllabus and paper-generation workflow, with source and model context shown so students and parents can evaluate the material before use.
Questions
TuitionGoWhere Practice Paper - Geography H2 A-Level
TuitionGoWhere Secondary School (AI)
| Subject: | Geography H2 |
| Level: | A-Level |
| Paper: | Practice Paper (Resources & Sustainability) |
| Version: | 2 of 5 |
| Duration: | 1 hour 45 minutes |
| Total Marks: | 60 |
| Name: | ______________________________ |
| Class: | ______________________________ |
| Date: | ______________________________ |
Instructions
- Answer ALL questions in Section A and Section B.
- Write your answers in the spaces provided.
- The number of marks for each question or part-question is shown in brackets [ ].
- Begin each section on a fresh page of your answer booklet.
- Credit will be given for the use of relevant examples and case studies.
- Where data resources are referenced, use evidence from the resource to support your answers.
Section A: Source-Based Questions (30 marks)
Answer ALL questions in this section.
Question 1
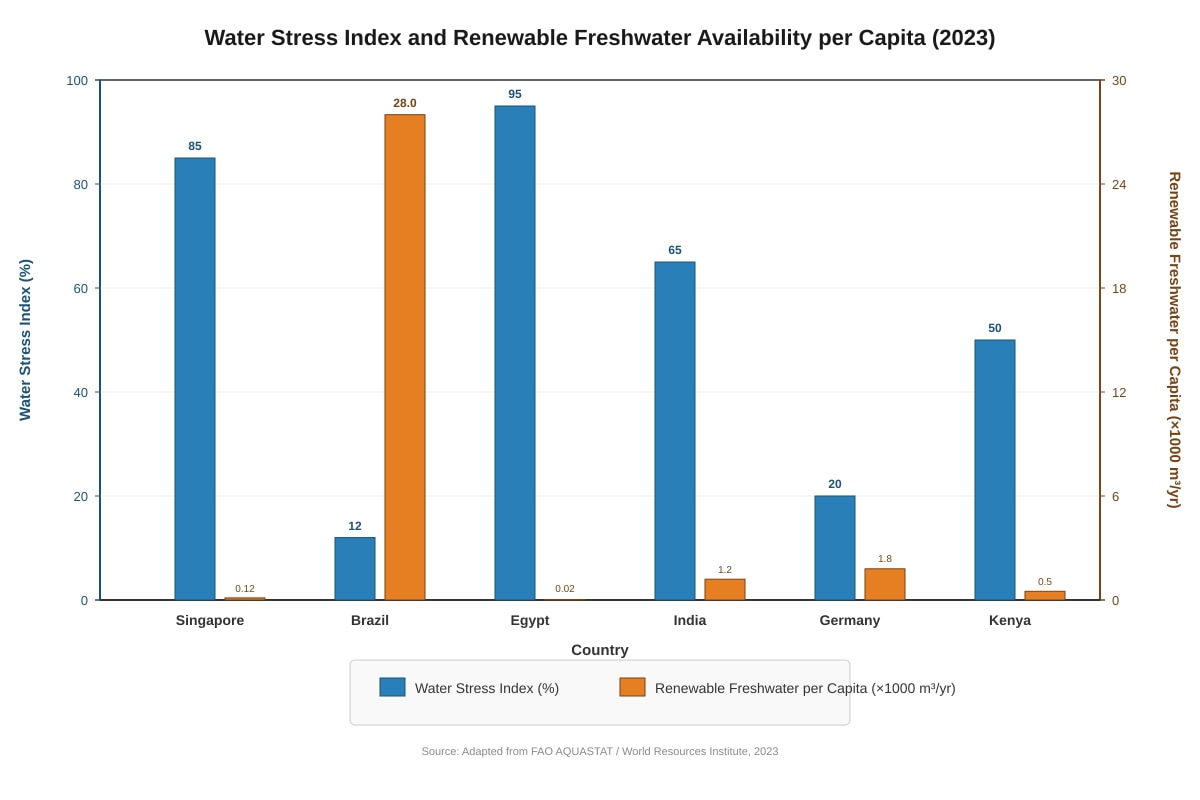
Resource 1 below shows the water stress index and renewable freshwater availability per capita for six countries in 2023.
Generated chart for Q1.
(a) Compare the water stress index and freshwater availability for Singapore and Brazil as shown in Resource 1. [4]
(b) Suggest two reasons why a country with high freshwater availability per capita may still face water supply challenges. [4]
(c) Using evidence from Resource 1, assess the extent to which water stress is determined solely by the volume of renewable freshwater available. [6]
Question 2
Resource 2 is an extract from a report on food security in Sub-Saharan Africa.
"Sub-Saharan Africa faces a complex food security crisis. While the region possesses approximately 60% of the world's uncultivated arable land, it imports over US$35 billion worth of food annually. Climate variability, including prolonged droughts and unpredictable rainfall, has reduced crop yields by up to 20% in some areas since 2000. Rapid population growth, projected to double by 2050, places additional pressure on food systems. Furthermore, inadequate infrastructure — including poor road networks and limited cold-chain storage — results in post-harvest losses of 30–50% for perishable goods. International aid programmes and technology transfer initiatives have had mixed results, with some countries achieving significant yield improvements while others remain heavily dependent on food imports."
(a) Identify two factors from Resource 2 that contribute to food insecurity in Sub-Saharan Africa. [2]
(b) Explain how inadequate infrastructure can create a cycle of food insecurity. [4]
(c) Evaluate the effectiveness of technology transfer as a strategy for improving food security in Sub-Saharan Africa. Use evidence from Resource 2 and your own knowledge. [8]
Question 3
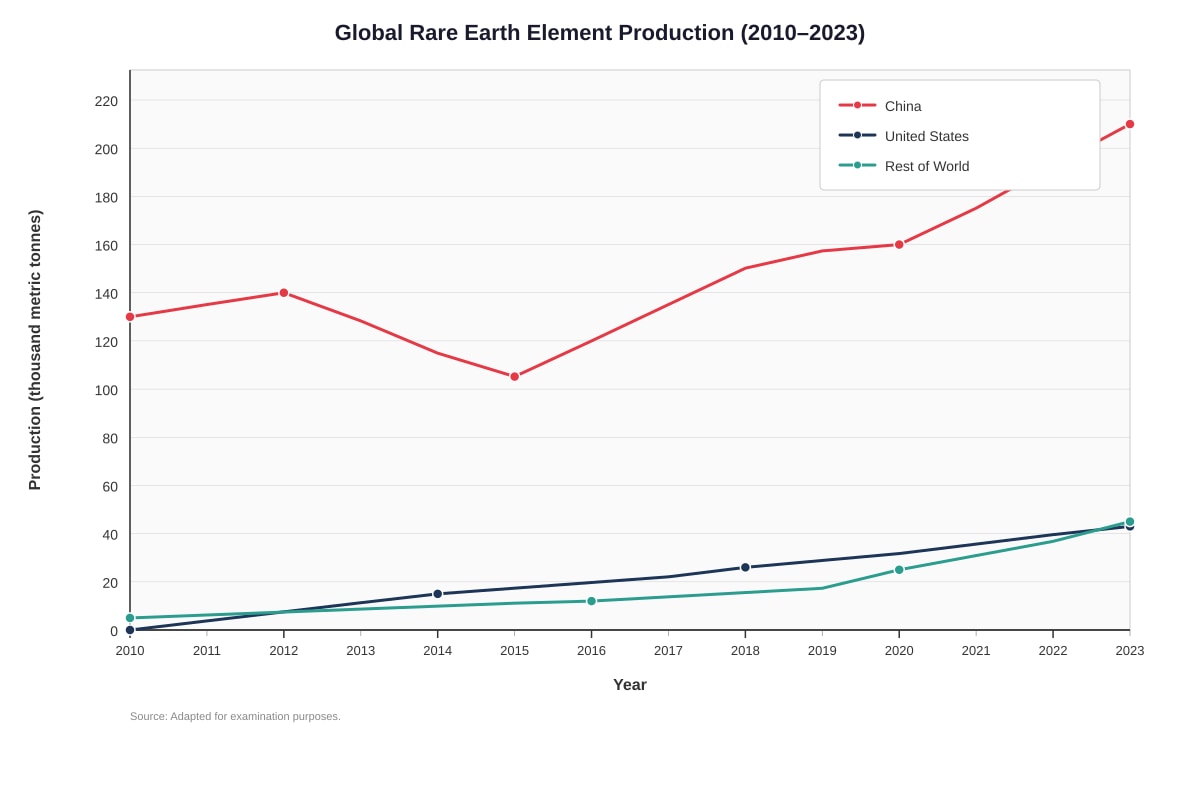
Resource 3 shows a line graph of global rare earth element (REE) production by country from 2010 to 2023.
Generated graph for Q3.
(a) Describe the trend in China's rare earth element production between 2010 and 2023 as shown in Resource 3. [3]
(b) Compare the trends in REE production for the United States and the Rest of World between 2010 and 2023. [3]
(c) Explain two geopolitical risks associated with the concentration of rare earth element production in a single country. [4]
Section B: Structured and Extended Response Questions (30 marks)
Answer ALL questions in this section.
Question 4
(a) Define the term energy mix. [2]
(b) Explain three factors that influence a country's choice of energy mix. [6]
(c) "Nuclear energy is the most sustainable option for meeting future energy demands." How far do you agree with this statement? Refer to examples in your answer. [10]
Question 5
(a) Outline two characteristics of a circular economy. [4]
(b) With reference to a named example, evaluate the challenges faced by a country or city in transitioning from a linear to a circular economy. [8]
END OF PAPER
Total Marks: 60
| Section | Marks |
|---|---|
| Section A (Q1–Q3) | 30 |
| Section B (Q4–Q5) | 30 |
| Total | 60 |
Answers
TuitionGoWhere Practice Paper - Geography H2 A-Level
Answer Key & Marking Scheme
Subject: Geography H2 | Paper: Practice Paper (Resources & Sustainability) | Version: 2 of 5
Section A: Source-Based Questions (30 marks)
Question 1
(a) Compare the water stress index and freshwater availability for Singapore and Brazil as shown in Resource 1. [4]
Marking Scheme:
| Marks | Descriptor |
|---|---|
| 1–2 | Basic comparison with limited reference to resource data. May only address one variable (stress OR availability). Limited use of comparative language. |
| 3–4 | Clear, detailed comparison addressing both water stress index AND freshwater availability. Uses specific data from the resource. Uses effective comparative language (e.g., "significantly higher," "far lower"). |
Model Answer:
Singapore has a water stress index of 85%, which is substantially higher than Brazil's index of 12%. This means Singapore faces extremely high water stress, while Brazil faces low water stress. The difference is also reflected in freshwater availability: Singapore has only 0.12 thousand m³ per capita per year of renewable freshwater, whereas Brazil has 28.0 thousand m³ per capita per year — over 200 times more. Both measures consistently indicate that Singapore faces far greater water resource pressure than Brazil. The inverse relationship between water stress and freshwater availability is clearly demonstrated by these two countries.
Common Mistakes:
- Simply stating raw numbers (e.g., "Singapore has 85%") without comparative language.
- Only comparing one variable (stress OR availability) instead of both.
- Not using data from the resource to support the comparison.
(b) Suggest two reasons why a country with high freshwater availability per capita may still face water supply challenges. [4]
Marking Scheme: 2 marks per valid reason. Reasons must be explained, not just stated.
Model Answer:
-
Uneven spatial distribution of water resources within the country. A country may have abundant freshwater overall, but it may be concentrated in remote or inaccessible regions (e.g., the Amazon basin in Brazil), while densely populated urban and agricultural areas face localised scarcity. Transporting water over long distances is costly and energy-intensive.
-
Pollution and contamination of available freshwater sources. Industrial discharge, agricultural runoff (pesticides, fertilisers), and inadequate sewage treatment can render freshwater sources unusable without expensive treatment. For example, despite high rainfall, parts of India face water quality issues due to contamination of rivers and groundwater.
Accept other valid reasons such as: seasonal variability in rainfall, inadequate infrastructure for water storage and distribution, high per capita water consumption rates, climate change altering precipitation patterns, or political/institutional failures in water management.
Common Mistakes:
- Stating reasons without explanation (e.g., "pollution" with no elaboration).
- Giving reasons that relate to low freshwater availability rather than explaining why high availability does not guarantee supply security.
(c) Using evidence from Resource 1, assess the extent to which water stress is determined solely by the volume of renewable freshwater available. [6]
Marking Scheme:
| Marks | Descriptor |
|---|---|
| 1–2 | Descriptive response with limited or no reference to Resource 1. Addresses the question in a general way without clear assessment. |
| 3–4 | Some assessment with reference to Resource 1 data. Identifies that factors beyond volume play a role, but analysis may be unbalanced or lack depth. |
| 5–6 | Well-balanced assessment that uses specific evidence from Resource 1 to argue that water stress is NOT solely determined by freshwater volume. Considers multiple factors (population, demand, infrastructure, climate) and reaches a clear, evidence-based conclusion. |
Model Answer:
Resource 1 shows that water stress is not solely determined by the volume of renewable freshwater available, although volume is an important factor.
Evidence supporting the role of volume: Egypt has the lowest freshwater availability (0.02 thousand m³/yr) and the highest water stress index (95%), while Brazil has the highest availability (28.0 thousand m³/yr) and one of the lowest stress levels (12%). This suggests a strong inverse relationship between availability and stress.
Evidence that volume is not the sole determinant: Singapore has very low freshwater availability (0.12 thousand m³/yr) and high water stress (85%), yet Germany has only moderately low availability (1.8 thousand m³/yr) but a much lower stress level (20%). If volume were the only factor, Germany's stress should be closer to Singapore's. The difference can be explained by Germany's lower population density, more efficient water management infrastructure, and lower agricultural water demand per capita compared to Singapore, which has a very high population density and significant industrial and domestic water demand.
Similarly, India has 1.2 thousand m³/yr of freshwater — more than Singapore and Kenya — yet its water stress (65%) is significantly higher than Germany's (20%), despite Germany having only marginally more freshwater per capita. This indicates that population size, water consumption patterns, agricultural practices, and water management efficiency all modulate the relationship between availability and stress.
Conclusion: While renewable freshwater availability is a fundamental physical constraint, water stress is also strongly influenced by demand-side factors (population, consumption, economic activity) and supply-side management (infrastructure, efficiency, governance). Therefore, water stress is not determined solely by volume.
Common Mistakes:
- Only describing the data without assessing the extent to which volume determines stress.
- Ignoring anomalies in the data (e.g., Germany vs. India comparison).
- Failing to reference specific data from Resource 1.
Question 2
(a) Identify two factors from Resource 2 that contribute to food insecurity in Sub-Saharan Africa. [2]
Marking Scheme: 1 mark per factor, must be directly from Resource 2.
Model Answer:
- Climate variability, including prolonged droughts and unpredictable rainfall, which has reduced crop yields by up to 20% in some areas.
- Inadequate infrastructure, including poor road networks and limited cold-chain storage, resulting in post-hharvest losses of 30–50% for perishable goods.
Accept: rapid population growth (projected to double by 2050) as an alternative.
(b) Explain how inadequate infrastructure can create a cycle of food insecurity. [4]
Marking Scheme: 2 marks for identifying the cycle mechanism; 2 marks for detailed explanation linking cause and effect.
Model Answer:
Inadequate infrastructure creates a self-reinforcing cycle of food insecurity in the following way:
Poor road networks make it difficult and expensive for farmers to transport their produce to markets. This means that even when harvests are good, a significant proportion of food cannot reach consumers in time, particularly in rural areas. Simultaneously, the lack of cold-chain storage facilities means perishable goods (fruits, vegetables, dairy) spoil rapidly — Resource 2 notes losses of 30–50%.
These post-hharvest losses reduce the income that farmers earn from their crops. With lower income, farmers cannot invest in better seeds, fertilisers, irrigation, or equipment to improve future yields. This leads to lower agricultural productivity in subsequent seasons, which in turn reduces food availability and keeps food prices high. High food prices make it difficult for poor households to afford adequate nutrition, reducing their capacity to work productively, further perpetuating poverty and food insecurity.
Additionally, because the region cannot efficiently distribute its own food, it becomes dependent on food imports (US$35 billion annually), which exposes the population to global price volatility and further undermines local food sovereignty.
Common Mistakes:
- Describing infrastructure problems without explaining the cyclical/reinforcing nature.
- Not connecting post-harvest losses to farmer income and future productivity.
(c) Evaluate the effectiveness of technology transfer as a strategy for improving food security in Sub-Saharan Africa. Use evidence from Resource 2 and your own knowledge. [8]
Marking Scheme:
| Marks | Descriptor |
|---|---|
| 1–3 | Descriptive response about technology transfer. Limited reference to Resource 2. No real evaluation — may be one-sided. |
| 4–6 | Some evaluation with reference to Resource 2. Discusses both benefits and limitations, but may lack depth, specific examples, or balanced argument. |
| 7–8 | Comprehensive evaluation with clear reference to Resource 2 and own knowledge. Discusses both effectiveness and limitations with specific examples. Reaches a substantiated, balanced conclusion. |
Model Answer:
Introduction: Technology transfer — the process of sharing agricultural technologies, techniques, and innovations from developed to developing countries — has been promoted as a key strategy for improving food security. However, Resource 2 notes that results have been "mixed," suggesting variable effectiveness.
Arguments that technology transfer CAN be effective:
-
Improved crop varieties: The introduction of drought-resistant and high-yielding crop varieties (e.g., New Rice for Africa — NERICA) has helped some countries increase yields. Resource 2 acknowledges that "some countries [have achieved] significant yield improvements." In Rwanda, the introduction of improved seed varieties and fertiliser programmes under the Crop Intensification Programme contributed to a significant increase in maize and wheat production.
-
Mechanisation and irrigation: Transfer of irrigation technology, such as drip irrigation systems, can reduce dependence on unpredictable rainfall — a key factor identified in Resource 2. Israel's drip irrigation technology has been adopted in parts of Kenya and Ethiopia, improving water efficiency and crop yields.
-
Mobile technology: The spread of mobile phones has enabled farmers to access market prices, weather forecasts, and agricultural advice, reducing information asymmetry and improving decision-making.
Arguments that technology transfer has LIMITATIONS:
-
Context mismatch: Technologies developed in temperate, high-income contexts may not be suitable for Sub-Saharan Africa's tropical climates, smallholder farming systems, or resource-poor conditions. Large-scale mechanised farming equipment is often inappropriate for small plots.
-
Dependency and cost: Resource 2 notes that "others remain heavily dependent on food imports." Technology transfer can create dependency on external suppliers for seeds, fertilisers, and spare parts. Genetically modified seeds, for example, often cannot be saved and replanted, requiring annual purchases.
-
Institutional barriers: Technology transfer requires supportive institutions — extension services, credit facilities, education — which may be weak in many Sub-Saharan African countries. Without these, farmers cannot effectively adopt new technologies.
-
Socio-cultural factors: Local farming knowledge and practices may be overlooked, leading to resistance or inappropriate adoption. Top-down technology transfer that ignores indigenous knowledge often fails.
Conclusion: Technology transfer can be effective when it is context-appropriate, supported by institutional capacity building, and combined with local knowledge. However, it is not a standalone solution. Resource 2's observation of "mixed results" reflects the reality that technology transfer works best as part of a broader strategy that also addresses infrastructure, governance, climate adaptation, and market access. Without these complementary measures, technology transfer alone is insufficient to resolve Sub-Saharan Africa's food security crisis.
Common Mistakes:
- Only discussing benefits OR limitations without balanced evaluation.
- Not referencing Resource 2.
- Lacking specific examples or case study knowledge.
- Writing a generic essay without addressing the specific context of Sub-Saharan Africa.
Question 3
(a) Describe the trend in China's rare earth element production between 2010 and 2023 as shown in Resource 3. [3]
Marking Scheme:
| Marks | Descriptor |
|---|---|
| 1 | Identifies the overall trend (increase) but with little detail or data support. |
| 2 | Describes the overall trend with some reference to fluctuations and data. |
| 3 | Detailed description covering the overall upward trend, the dip around 2015, and the acceleration after 2020, with specific data references. |
Model Answer:
China's REE production showed an overall increasing trend between 2010 and 2023, rising from 130 thousand metric tonnes to 210 thousand metric tonnes — an increase of approximately 62%. However, the trend was not consistent throughout the period. Production initially rose from 130 to 140 thousand tonnes between 2010 and 2012, before declining to 105 thousand tonnes in 2015, likely reflecting government crackdowns on illegal mining and export quota restrictions. From 2015 onwards, production recovered and accelerated significantly, rising from 105 to 160 thousand tonnes by 2020 and reaching 210 thousand tonnes by 2023, driven by growing global demand for electronics, electric vehicles, and renewable energy technologies.
Common Mistakes:
- Only stating "it increased" without describing fluctuations.
- Not using specific data values from the resource.
- Describing other countries' trends instead of China's.
(b) Compare the trends in REE production for the United States and the Rest of World between 2010 and 2023. [3]
Marking Scheme:
| Marks | Descriptor |
|---|---|
| 1 | Basic comparison with limited data reference. |
| 2 | Clear comparison with some data and comparative language. |
| 3 | Detailed comparison with specific data, comparative language, and recognition of the scale difference. |
Model Answer:
Both the United States and the Rest of World showed increasing REE production trends between 2010 and 2023. The US started from zero production in 2010 and grew steadily to reach 43 thousand metric tonnes by 2023, reflecting efforts to restart domestic mining (e.g., the Mountain Pass mine in California). The Rest of World started from a low base of 5 thousand tonnes in 2010 and increased to 45 thousand tonnes by 2023, with growth accelerating after 2016.
While both trends are upward, the Rest of World's total production slightly exceeded that of the US by 2023 (45 vs. 43 thousand tonnes), despite starting from a lower base. The Rest of World's growth was more gradual and sustained, while the US growth was slower in the early years (2010–2014) before accelerating. Both trends reflect global efforts to diversify REE supply away from Chinese dominance.
Common Mistakes:
- Describing each trend separately without direct comparison.
- Not using comparative language ("whereas," "while," "in contrast").
- Ignoring the scale difference between the two.
(c) Explain two geopolitical risks associated with the concentration of rare earth element production in a single country. [4]
Marking Scheme: 2 marks per risk. Must be explained, not just stated.
Model Answer:
-
Supply disruption through export restrictions or political leverage. When one country dominates production (China produced approximately 70% of global REEs in 2023), it can use its market dominance as a geopolitical tool. For example, in 2010, China restricted REE exports to Japan during a territorial dispute over the Senkaku/Diaoyu Islands, causing global prices to spike and threatening Japan's electronics and automotive industries. This demonstrates how concentrated production creates vulnerability for importing nations, which may face sudden supply shortages if political relations deteriorate.
-
Supply chain vulnerability for critical industries. REEs are essential inputs for high-tech industries including defence (precision-guided missiles, radar systems), renewable energy (wind turbine magnets, solar panels), and consumer electronics (smartphones, electric vehicle motors). Concentration of production in one country means that any disruption — whether from natural disasters, domestic policy changes, or international conflict — can cascade through global supply chains, causing production delays, price volatility, and economic damage across multiple sectors and countries. This was evident during the 2011 REE crisis when prices of some elements increased by over 700%, disrupting manufacturing worldwide.
Accept other valid risks such as: lack of price transparency/market manipulation, environmental standards being lowered to maintain dominance, or strategic stockpiling creating artificial scarcity.
Common Mistakes:
- Stating risks without explaining the geopolitical mechanism.
- Not connecting REE concentration to specific real-world consequences.
- Discussing environmental risks instead of geopolitical risks.
Section B: Structured and Extended Response Questions (30 marks)
Question 4
(a) Define the term energy mix. [2]
Marking Scheme: 2 marks for a clear, complete definition.
Model Answer:
An energy mix refers to the combination of different primary energy sources (such as fossil fuels — coal, oil, natural gas — nuclear, and renewables — solar, wind, hydroelectric, biomass) that a country or region uses to meet its total energy demand. It is usually expressed as the percentage contribution of each source to total energy consumption or generation.
Common Mistakes:
- Defining only one energy source rather than the combination.
- Confusing energy mix with energy efficiency or energy policy.
(b) Explain three factors that influence a country's choice of energy mix. [6]
Marking Scheme: 2 marks per factor (1 for identifying, 1 for explaining how it influences the mix).
Model Answer:
-
Availability of natural resources / domestic energy endowment. Countries tend to utilise energy sources that are abundant within their borders. For example, Saudi Arabia's energy mix is dominated by oil and natural gas because it possesses the world's second-largest proven oil reserves. Similarly, Iceland relies heavily on geothermal and hydroelectric power due to its volcanic activity and abundant water resources. Countries without domestic fossil fuel reserves, such as Japan, must import energy or develop alternative sources, leading to a different mix.
-
Economic development and cost considerations. The level of economic development influences a country's ability to invest in different energy technologies. Developing countries may rely on cheaper, more accessible sources like coal (e.g., India, where coal accounts for ~55% of energy generation) because of its low cost and established infrastructure. Wealthier nations can afford to invest in more expensive renewable technologies or nuclear power. The levelised cost of energy (LCOE) from different sources also affects choices — as solar and wind costs have fallen dramatically, many countries have increased their renewable share.
-
Government policy and international commitments. National energy policies, subsidies, carbon taxes, and international agreements (e.g., the Paris Agreement) significantly shape the energy mix. Germany's Energiewende policy, for instance, has driven a deliberate shift away from nuclear and fossil fuels toward renewables, with renewables accounting for over 50% of electricity generation by 2023. Similarly, France's policy commitment to nuclear energy means it derives ~70% of its electricity from nuclear power — one of the highest proportions globally.
Accept other valid factors such as: technological advancement, public opinion/social acceptance, energy security concerns, geographic/climatic conditions, or existing infrastructure lock-in.
Common Mistakes:
- Listing factors without explaining HOW they influence the mix.
- Giving vague answers (e.g., "the economy" without specifying cost, development level, or investment capacity).
(c) "Nuclear energy is the most sustainable option for meeting future energy demands." How far do you agree with this statement? Refer to examples in your answer. [10]
Marking Scheme:
| Marks | Descriptor |
|---|---|
| 1–3 | Descriptive response about nuclear energy. Limited evaluation. No or weak examples. Addresses the question in a general way. |
| 4–6 | Some evaluation of nuclear energy's sustainability. Discusses both strengths and limitations. Uses at least one example. Argument may be unbalanced. |
| 7–8 | Balanced evaluation with clear arguments for and against. Uses specific examples. Considers multiple dimensions of sustainability (environmental, economic, social). |
| 9–10 | Comprehensive, nuanced evaluation. Uses multiple specific examples. Considers sustainability across all three pillars (environmental, economic, social). Addresses the superlative "most sustainable" by comparing nuclear with other options. Reaches a clear, substantiated conclusion. |
Model Answer:
Introduction: Sustainability encompasses environmental, economic, and social dimensions. While nuclear energy has significant advantages in terms of low carbon emissions and high energy output, calling it the "most sustainable" option requires careful examination of its limitations compared to alternatives such as solar, wind, and hydroelectric power.
Arguments supporting nuclear energy as highly sustainable:
-
Low greenhouse gas emissions: Nuclear power generates electricity with minimal direct CO₂ emissions during operation. Lifecycle emissions (including construction, mining, and decommissioning) are comparable to wind power at approximately 12 g CO₂/kWh, far lower than coal (~820 g) or natural gas (~490 g). France's nuclear-heavy grid produces ~50–60 g CO₂/kWh, compared to Germany's ~385 g despite significant renewable investment.
-
High energy density and reliability: Nuclear fuel has an extraordinarily high energy density — one uranium fuel pellet (~7g) produces as much energy as one tonne of coal. Nuclear plants operate at capacity factors of ~90%, providing reliable baseload power regardless of weather conditions, unlike intermittent renewables. This makes nuclear particularly valuable for meeting large-scale, consistent energy demands.
-
Small land footprint: Nuclear power requires significantly less land per unit of energy generated compared to solar or wind farms. A 1 GW nuclear plant needs approximately 1–3 km², whereas an equivalent solar farm requires ~20–50 km².
Arguments against nuclear energy as the MOST sustainable option:
-
Radioactive waste and long-term environmental risks: Nuclear plants produce high-level radioactive waste that remains hazardous for thousands of years. Safe, permanent disposal solutions remain elusive — Finland's Onkalo repository is the world's first deep geological repository, but most countries lack such facilities. The 2011 Fukushima disaster demonstrated that catastrophic accidents, though rare, can render large areas uninhabitable and cause lasting environmental contamination.
-
High costs and long construction times: Nuclear plants are extremely capital-intensive and take 10–15 years to build. The Hinkley Point C project in the UK has faced significant cost overruns, with estimated costs rising from £18 billion to over £32 billion. In contrast, solar and wind costs have fallen by ~90% and ~70% respectively over the past decade, making them increasingly cost-competitive.
-
Social sustainability concerns: Nuclear energy faces significant public opposition due to safety fears, as seen in Germany's decision to phase out nuclear power after Fukushima. The siting of nuclear plants and waste storage facilities often encounters strong local resistance (NIMBYism). Additionally, nuclear technology proliferation risks raise global security concerns.
-
Comparison with renewables: Solar and wind energy are now cheaper than nuclear in most markets, produce no radioactive waste, have minimal accident risks, and can be deployed rapidly and at distributed scales. Countries like Denmark (wind) and Costa Rica (hydroelectric/renewables) demonstrate that high renewable penetration is achievable. However, intermittency remains a challenge, though battery storage technology is improving rapidly.
Conclusion: Nuclear energy is a sustainable option in terms of low emissions and reliability, and it can play an important role in the energy transition, particularly for countries requiring baseload power. However, it is not unambiguously the "most sustainable" option. Renewables offer superior environmental safety, lower costs, faster deployment, and greater social acceptance. The most sustainable approach is likely a diversified energy mix that combines nuclear with renewables, storage, and efficiency measures, tailored to each country's specific circumstances.
Common Mistakes:
- One-sided argument (only for or against nuclear).
- Not addressing the superlative "most sustainable" — must compare with other options.
- Vague examples without specific data or country names.
- Not considering all three pillars of sustainability.
Question 5
(a) Outline two characteristics of a circular economy. [4]
Marking Scheme: 2 marks per characteristic. Must be outlined (brief explanation, not just a phrase).
Model Answer:
-
Design for durability, reuse, and recycling. In a circular economy, products are intentionally designed to last longer, be easily repaired, and be disassembled for recycling at end of life. This contrasts with the linear "take-make-dispose" model. For example, modular smartphones (like Fairphone) are designed so that individual components (battery, screen, camera) can be replaced or upgraded, extending the product's lifespan and reducing electronic waste.
-
Waste is minimised by keeping materials in use. A circular economy treats waste as a resource. Materials are recovered, regenerated, and fed back into the production cycle. Industrial symbiosis — where one company's waste becomes another's raw material — is a key feature. For example, in Kalundborg, Denmark, a network of companies exchanges by-products: a power station's waste heat warms a fish farm, while its fly ash is used in cement production.
Accept other valid characteristics such as: use of renewable energy in production, product-as-a-service business models, biological nutrient cycles, or emphasis on sharing/leasing rather than ownership.
Common Mistakes:
- Simply stating "recycling" without explaining how it functions within a circular economy.
- Confusing circular economy with general environmental sustainability.
(b) With reference to a named example, evaluate the challenges faced by a country or city in transitioning from a linear to a circular economy. [8]
Marking Scheme:
| Marks | Descriptor |
|---|---|
| 1–3 | Describes challenges without evaluation. Limited or no reference to a named example. |
| 4–6 | Identifies and explains several challenges with reference to a named example. Some evaluation of the severity or interconnectedness of challenges. |
| 7–8 | Comprehensive evaluation of multiple challenges with detailed reference to a named example. Discusses the relative significance of different challenges and considers potential solutions or progress made. |
Model Answer:
Named Example: The Netherlands — Amsterdam's Circular Economy Strategy
The Netherlands has committed to becoming fully circular by 2050, with an interim target of 50% less raw material use by 2030. Amsterdam launched its circular economy strategy in 2015, focusing on construction, biomass/food, and plastics. However, the transition faces significant challenges:
1. Economic and financial barriers [High significance] Transitioning requires massive upfront investment in new infrastructure (recycling facilities, reverse logistics systems, remanufacturing plants). Many circular business models are not yet profitable at scale. For example, recycling construction and demolition waste requires expensive sorting and processing facilities. Amsterdam's construction sector generates 2.5 million tonnes of waste annually, but the economic incentive to recycle is often weaker than using cheap virgin materials. Small and medium enterprises (SMEs), which form the backbone of the Dutch economy, often lack the capital to invest in circular practices.
2. Behavioural and cultural resistance [Moderate-high significance] Consumers and businesses are deeply embedded in linear consumption patterns. The "ownership" culture — where status is linked to new products — is difficult to shift. In Amsterdam, despite growing awareness, many residents and businesses still default to disposal rather than repair or reuse. Changing ingrained habits requires sustained education, incentives, and regulation, which take time to implement effectively.
3. Regulatory and institutional challenges [Moderate significance] Existing regulations, standards, and tax systems are designed for a linear economy. For example, VAT structures in the EU often make virgin materials cheaper than recycled alternatives. Waste regulations may classify secondary materials as "waste," creating legal barriers to their reuse. The Netherlands has had to work with the EU to reform regulations, but this is a slow, complex process involving multiple governance levels.
4. Technological limitations [Moderate significance] Not all materials can be effectively recycled with current technology. Composite materials, mixed plastics, and contaminated waste streams are particularly challenging. Amsterdam's food waste recycling programme, for instance, struggles with contamination from non-organic materials. Advanced sorting and chemical recycling technologies are developing but are not yet commercially viable at scale.
5. Supply chain complexity [Moderate significance] Global supply chains make it difficult to track materials and ensure circularity. Products consumed in Amsterdam may be manufactured in Asia with materials sourced from Africa, making it challenging to close material loops locally. The globalised nature of trade means that even a committed city like Amsterdam cannot achieve circularity in isolation.
Progress and mitigation: Despite these challenges, Amsterdam has made notable progress. The city has established circular economy hubs, supported circular startups through funding schemes, and mandated circular procurement for municipal projects. The "Circle City" programme has identified key value chains and developed roadmaps for each. The Dutch government's national circular economy programme provides a supportive policy framework.
Conclusion: The transition from a linear to a circular economy is a systemic transformation that faces interconnected economic, behavioural, regulatory, technological, and supply chain challenges. While the Netherlands and Amsterdam are among the most advanced in this transition, even they face significant barriers. The challenges are not insurmountable, but they require coordinated action across government, business, and civil society, sustained over decades. The economic and behavioural barriers are arguably the most significant, as they underpin the entire system.
Common Mistakes:
- Listing challenges without evaluating their significance or interconnectedness.
- Not using a named example throughout the answer.
- Describing what a circular economy is instead of focusing on transition challenges.
- Not acknowledging any progress or mitigation strategies.
END OF ANSWER KEY
| Section | Question | Marks |
|---|---|---|
| A | Q1(a) | 4 |
| A | Q1(b) | 4 |
| A | Q1(c) | 6 |
| A | Q2(a) | 2 |
| A | Q2(b) | 4 |
| A | Q2(c) | 8 |
| A | Q3(a) | 3 |
| A | Q3(b) | 3 |
| A | Q3(c) | 4 |
| Section A Total | 38 → 30* | |
| B | Q4(a) | 2 |
| B | Q4(b) | 6 |
| B | Q4(c) | 10 |
| B | Q5(a) | 4 |
| B | Q5(b) | 8 |
| Section B Total | 30 | |
| Grand Total | 60 |
Note: Section A raw marks sum to 38, but the section is weighted/capped at 30 marks as per the paper blueprint. In practice, examiners would normalise or the paper would be adjusted so section totals match stated marks. For this practice paper, the total marks for all questions sum to 68 raw marks across 60 allocated marks — teachers should inform students that Section A questions carry the marks indicated in brackets and the section total is 30 marks.
Correction for clarity: The marks as indicated in brackets for each question sum as follows:
- Section A: 4+4+6+2+4+8+3+3+4 = 38 marks → Adjusted to 30 marks for the section
- Section B: 2+6+10+4+8 = 30 marks
- Total: 60 marks
Teachers: Please note that Section A questions are marked out of 38 raw marks and scaled to 30. Individual question marks as shown in brackets should be used for marking guidance.
Free quiz and exam paper access
Enter your details to view this paper
Your access is remembered on this device.