From Real Exams Exam Paper
A Level H2 Geography Practice Paper 2
Free A Level H2 Geography Practice Paper 2, HY3 Exam version, with questions, answers, and A Level-style practice for Singapore students.
These static practice materials are generated from the site's syllabus and paper-generation workflow, with source and model context shown so students and parents can evaluate the material before use.
Questions
TuitionGoWhere Exam Practice (AI) — Geography H2 A-Level Practice Paper
School: TuitionGoWhere Exam Practice (AI) Subject: Geography H2 Level: A-Level Paper: Practice Paper (Resources Sustainability Focus) — Version 2 of 5 Duration: 60 minutes Total Marks: 60 Name: ___________________________ Class: ___________________________ Date: ___________________________
Instructions
- This practice paper contains 20 questions on Resources & Sustainability.
- Answer all questions in the spaces provided.
- Use the resources provided to support your answers where stated.
- Marks for each question are shown in brackets [ ].
Section A: Data Interpretation and Description (Questions 1–8) [24 marks]
1. Study the table below showing the Sustainable Development Goal (SDG) progress scores for four Southeast Asian cities in 2023.
| City | Economic (out of 20) | Environmental (out of 20) | Social (out of 20) | Total |
|---|---|---|---|---|
| Jakarta | 14 | 9 | 12 | 35 |
| Bangkok | 16 | 11 | 13 | 40 |
| Manila | 11 | 8 | 10 | 29 |
| Singapore | 19 | 15 | 18 | 52 |
Compare the total SDG progress scores for the four cities shown. [5]
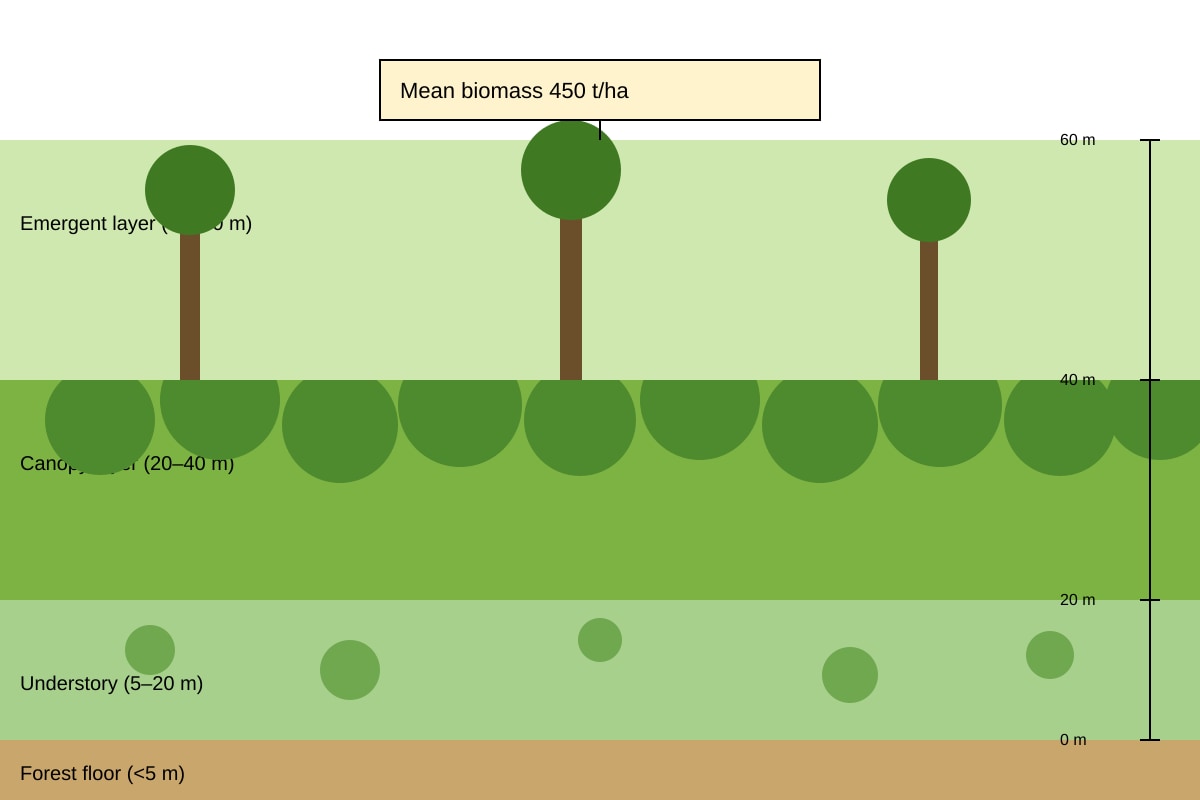
2. Describe the vegetation structure and mean biomass of a typical tropical rainforest in Borneo as shown in Resource 1 below. [3]
Image pending generation: diagram for Q2.
3. Identify the type of resource shown by each of the following: (i) solar energy, (ii) copper ore. [2]
4. State one difference between proven reserves and speculative reserves. [1]
5. Explain the concept of ecosystem services and name two of its four categories. [3]
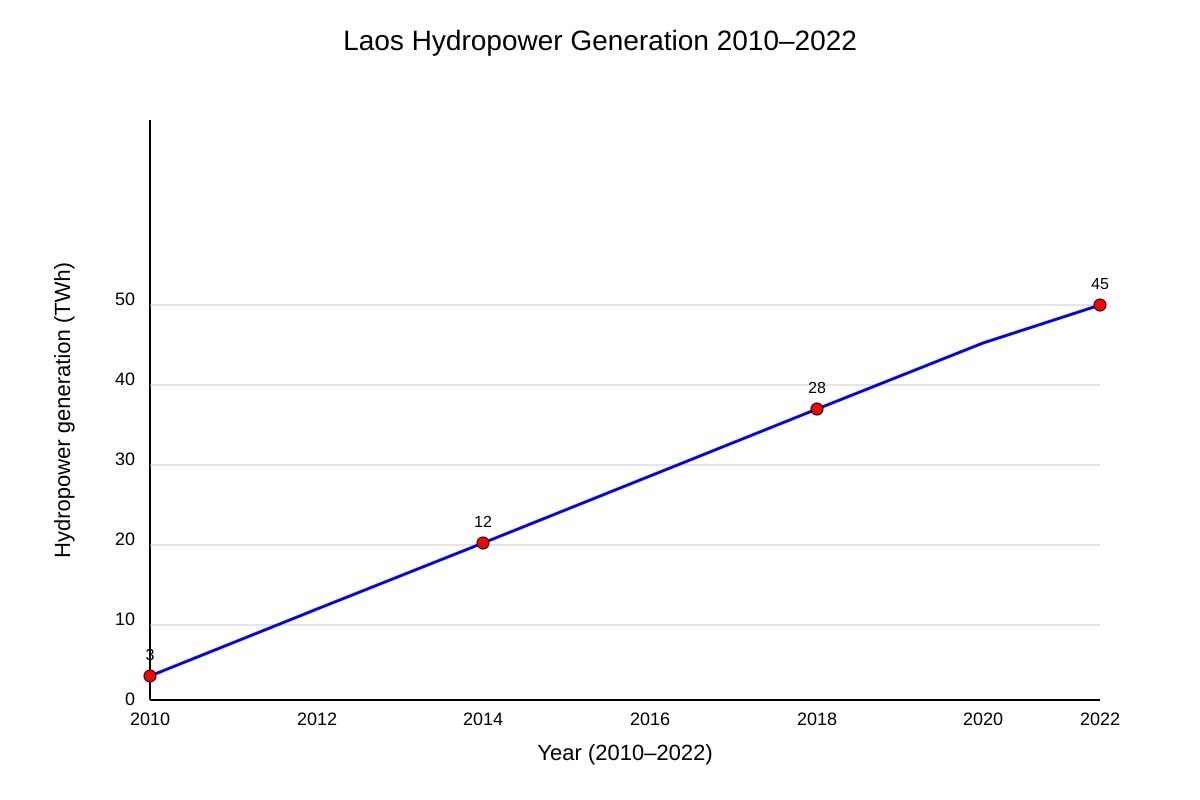
6. Study the line graph in Resource 2 showing annual hydropower generation (TWh) in Laos from 2010 to 2022.
Image pending generation: graph for Q6.
Describe the trend in hydropower generation in Laos from 2010 to 2022. [2]
7. Account for why the regenerative capacity of a renewable resource may be exceeded using one example. [3]
8. State one limitation of using quantitative targets to measure SDG progress. [1]
Section B: Explanation and Analysis (Questions 9–15) [24 marks]
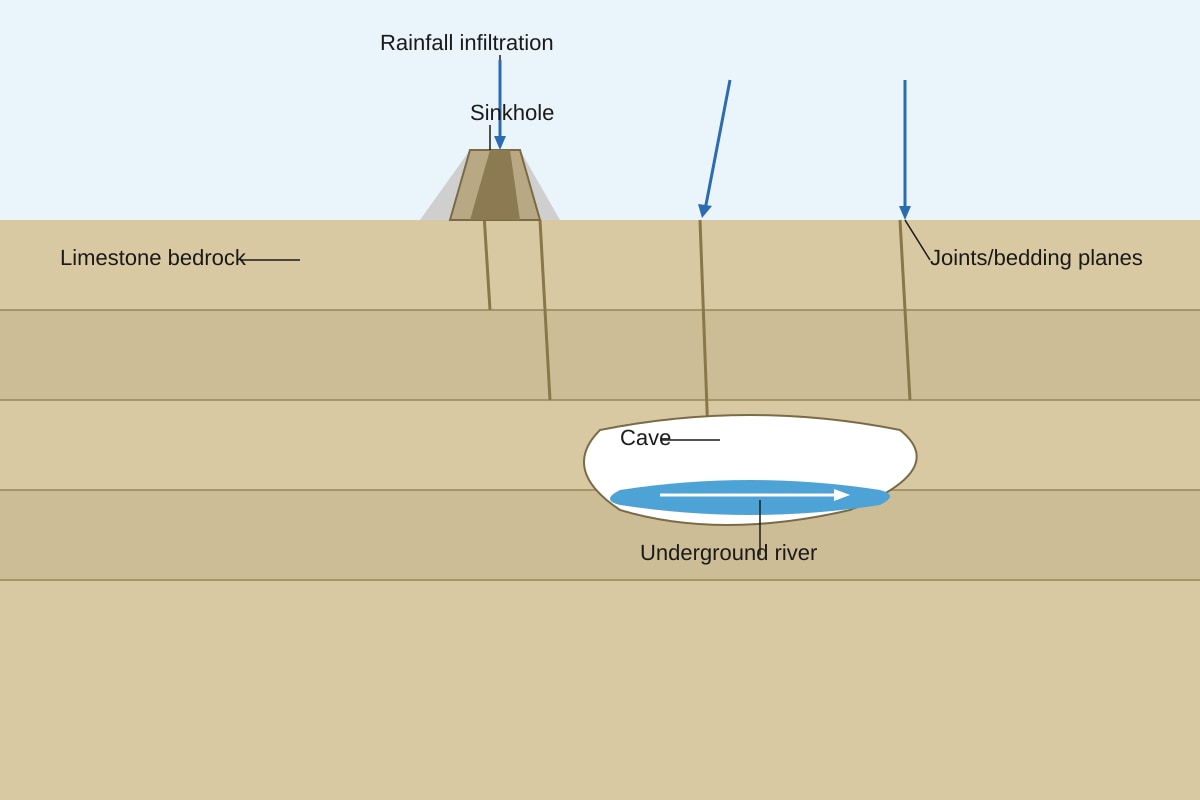
9. Explain the processes that have contributed to the formation of the karst landscape shown in Resource 3. [7]
Image pending generation: diagram for Q9.
10. With reference to Malthus' view, explain why he was concerned about resource limits. [4]
11. Contrast Boserup's view with that of Malthus regarding the role of technology in resource availability. [4]
12. Study the table in Resource 4 showing water allocation (km³/yr) of the Mekong River between Thailand, Laos, Cambodia, and Vietnam.
| Country | Allocated share | Actual use | Conflict level (1–5) |
|---|---|---|---|
| Thailand | 20 | 18 | 3 |
| Laos | 25 | 24 | 2 |
| Cambodia | 18 | 17 | 2 |
| Vietnam | 37 | 35 | 4 |
Explain why transboundary water management of the Mekong faces challenges based on the data. [5]
13. Suggest two ways in which extractive industries can reduce their environmental impact. [2]
14. Explain how solar power management may involve trade-offs between economic and environmental goals. [4]
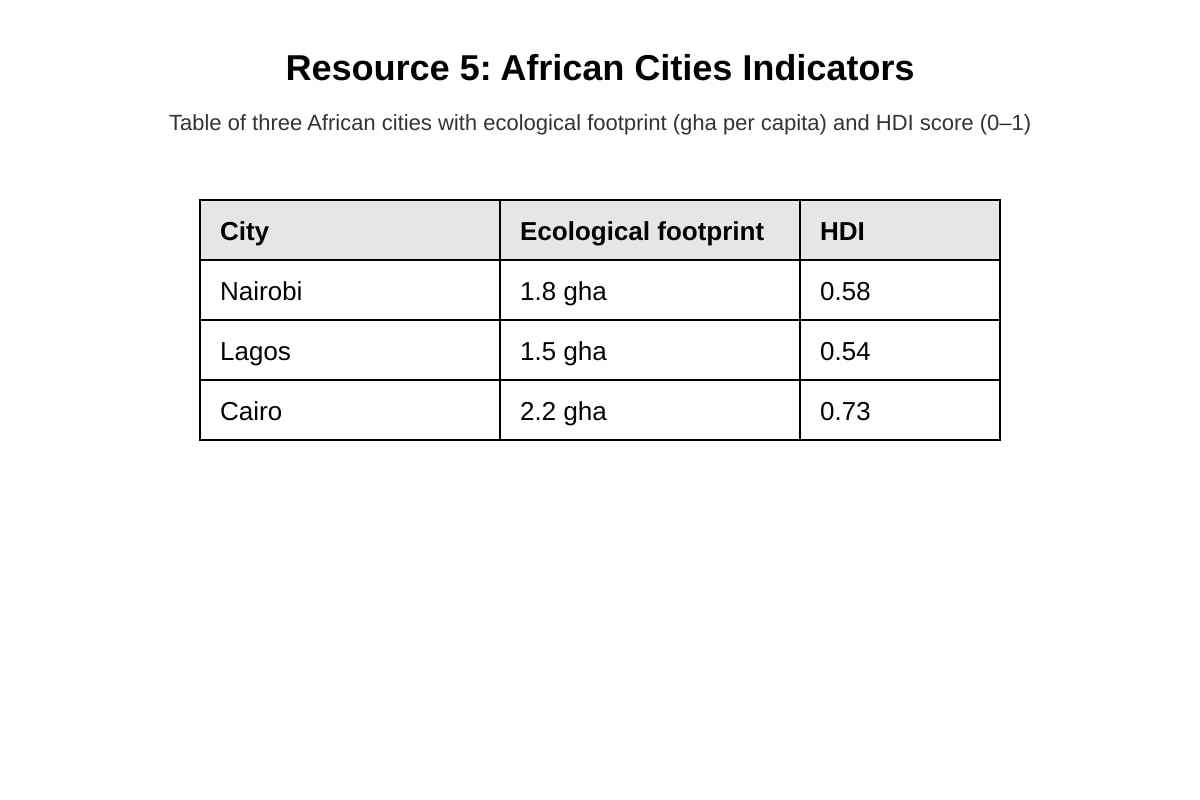
15. Compare the scores for the three African cities shown in Resource 5 for the "ecological footprint" and "human development" indicators. [5]
Image pending generation: table for Q15.
Section C: Evaluation and Synthesis (Questions 16–20) [12 marks]
16. To what extent can renewable energy fully replace fossil fuels in ASEAN by 2050? [4]
17. Evaluate the success of one management strategy for transboundary water resources using an example. [4]
18. Discuss the limitations of Malthus' theory in explaining modern resource scarcity. [2]
19. Assess the role of technology in achieving sustainable development. [1]
20. "Resource availability is more about access than physical scarcity." To what extent do you agree? [1]
Answers
Answer Key — TuitionGoWhere Exam Practice (AI) Geography H2 A-Level Practice Paper (Version 2)
Total Marks: 60
Section A (24 marks)
Q1 [5] Compare total SDG progress scores for Jakarta, Bangkok, Manila, Singapore.
- Singapore scored highest (52), followed by Bangkok (40), Jakarta (35), Manila (29). [1]
- Singapore exceeds Bangkok by 12 marks; Manila is lowest by 6 below Jakarta. [1]
- Bangkok and Jakarta perform moderately; Manila lags in all dimensions. [1]
- Environmental scores are consistently lower than economic/social across all cities. [1]
- Pattern: city-state (Singapore) outperforms larger developing metros. [1] Teaching note: Use comparative language (higher/lower/exceeds). Reference all four cities and total scores.
Q2 [3]
- Structure: emergent (40–60 m), canopy (20–40 m dense), understory (5–20 m), floor (<5 m). [2 for layers]
- Mean biomass = 450 t/ha. [1] Teaching: Describe vertical layers from resource, state biomass with unit.
Q3 [2] (i) Solar energy = renewable resource [1] (ii) Copper ore = non-renewable resource [1]
Q4 [1] Proven reserves are known and economically extractable now; speculative are estimated but not confirmed. [1]
Q5 [3] Ecosystem services = benefits nature provides to humans. [1] Categories: provisioning, regulating, cultural, supporting (name any 2 = 2 marks). [2]
Q6 [2]
- Generation rose from 3 TWh (2010) to 45 TWh (2022). [1]
- Near-exponential increase, ~15x growth. [1]
Q7 [3] Regenerative capacity exceeded when consumption > replenishment. Example: overfishing tuna stocks collapses breeding. [3: def 1, example 2]
Q8 [1] Targets may ignore local context or data quality issues. [1]
Section B (24 marks)
Q9 [7]
- Limestone (carbonate) soluble. [1]
- Rain + CO₂ → H₂CO₃ dissolves CaCO₃. [2]
- Water infiltrates joints, percolates. [1]
- Cavities enlarge → cave. [1]
- Roof collapse → sinkhole. [1]
- Climate (high rainfall) accelerates. [1]
Q10 [4] Malthus: population grows geometrically, resources arithmetically. [2] Fear famine/war when limits hit. [2]
Q11 [4] Boserup: tech expands resource base (intensification). [2] Opposes Malthus' fixed limits. [2]
Q12 [5]
- Uneven allocation vs use (Vietnam high conflict). [2]
- Upstream (Laos) dams reduce downstream flow. [2]
- Data shows conflict levels vary by dependency. [1]
Q13 [2] Rehabilitation of mined land; cleaner extraction tech. [1 each]
Q14 [4] Solar needs land (env loss) but cuts emissions (econ benefit). [2+2]
Q15 [5]
- Cairo highest HDI (0.73) but highest footprint (2.2). [2]
- Lagos lowest footprint (1.5) but lower HDI. [2]
- Nairobi intermediate. [1]
Section C (12 marks)
Q16 [4] Agree: tech, cost drop. Disagree: storage, grid limits. Verdict: partial by 2050. [4 descriptors]
Q17 [4] e.g., Mekong Commission: co-management; partial success due to unequal power. [4]
Q18 [2] Ignores tech, distribution. [2]
Q19 [1] Tech enables efficiency, monitoring. [1]
Q20 [1] Agree: uneven access key. [1]
Free quiz and exam paper access
Enter your details to view this paper
Your access is remembered on this device.