From Real Exams Exam Paper
A Level H2 Geography Practice Paper 1
Free A Level H2 Geography Practice Paper 1, LongCat Exam version, with questions, answers, and A Level-style practice for Singapore students.
These static practice materials are generated from the site's syllabus and paper-generation workflow, with source and model context shown so students and parents can evaluate the material before use.
Questions
TuitionGoWhere Practice Paper - Geography H2 A-Level
TuitionGoWhere Secondary School (AI)
Subject: Geography Level: A-Level H2 (9173) Paper: Practice Paper — Resources Sustainability Version: 1 of 5 Duration: 1 hour 45 minutes Total Marks: 60
Name: ___________________________ Class: ___________________________ Date: ___________________________
Instructions
- Answer ALL questions in Section A and Section B.
- Write your answers in the spaces provided.
- Begin Section B on a fresh page.
- The number of marks for each question is shown in brackets [ ].
- You are advised to spend approximately 45 minutes on Section A and 60 minutes on Section B.
- Where data resources are referenced, use the information provided to support your answers.
Section A: Source-Based Questions (30 marks)
Answer ALL questions in this section.
Question 1
Resource 1 shows the global Ecological Footprint per capita (in global hectares, gha) for six countries in 2010 and 2020.
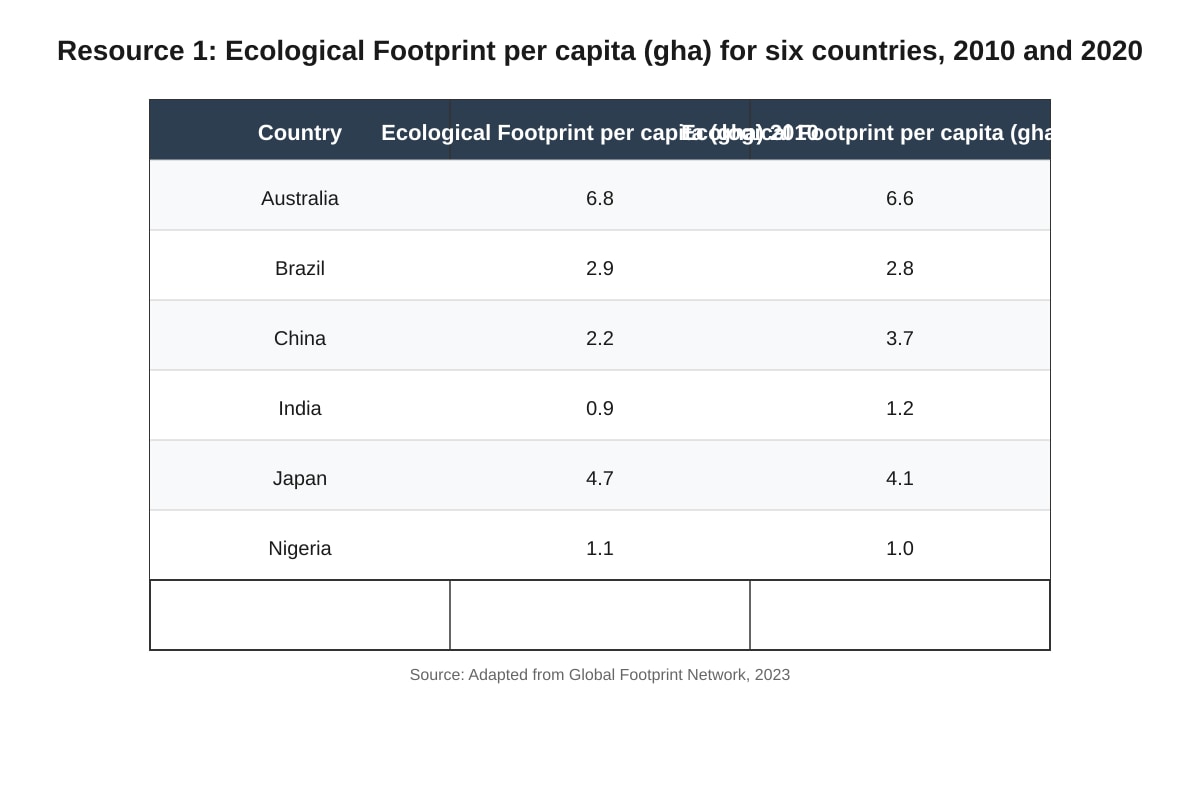
Generated table for Q1.
(a) Compare the Ecological Footprint per capita for the six countries shown in Resource 1. [5]
(b) Suggest two reasons why China's Ecological Footprint per capita increased significantly between 2010 and 2020. [4]
Question 2
Resource 2 is an extract from a report on Singapore's water sustainability strategy.
"Singapore currently imports approximately 40% of its water from Malaysia under agreements that expire in 2061. To reduce this dependence, the government has invested heavily in the 'Four National Taps' strategy: (1) local catchment water, (2) imported water, (3) NEWater (recycled water), and (4) desalinated water. NEWater now meets up to 40% of Singapore's water demand, and this is projected to increase to 55% by 2060. Desalination currently meets 25% of demand, with plans to increase capacity. However, both NEWater and desalination are energy-intensive processes. Desalination requires approximately 3.5 kWh of energy per cubic metre of water produced. Singapore's PUB (Public Utilities Board) aims to reduce this to 1.5 kWh/m³ by 2030 through technological innovation."
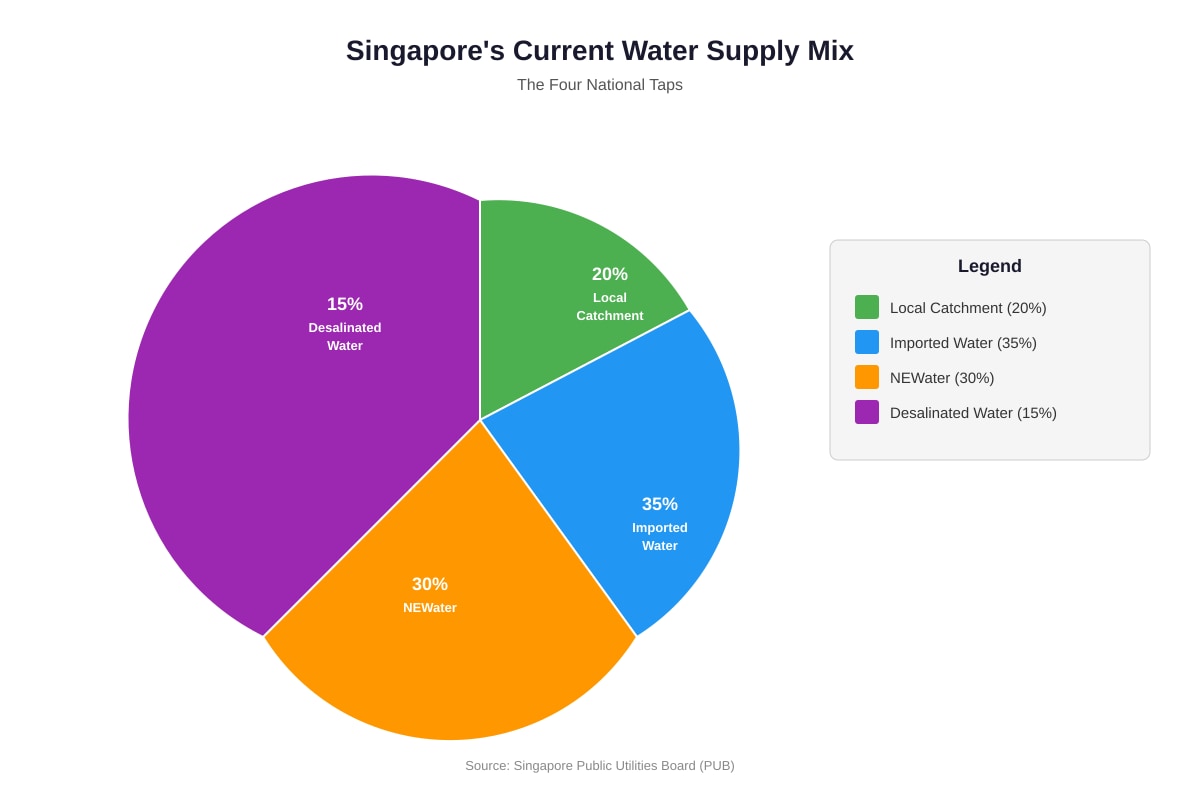
Generated chart for Q2.
(a) Using Resource 2, describe the trend in Singapore's approach to water sustainability. [4]
(b) Explain two challenges Singapore faces in achieving water sustainability. [4]
Question 3
Resource 3 shows the energy mix (percentage contribution) for Country X in 2010 and 2025 (projected).
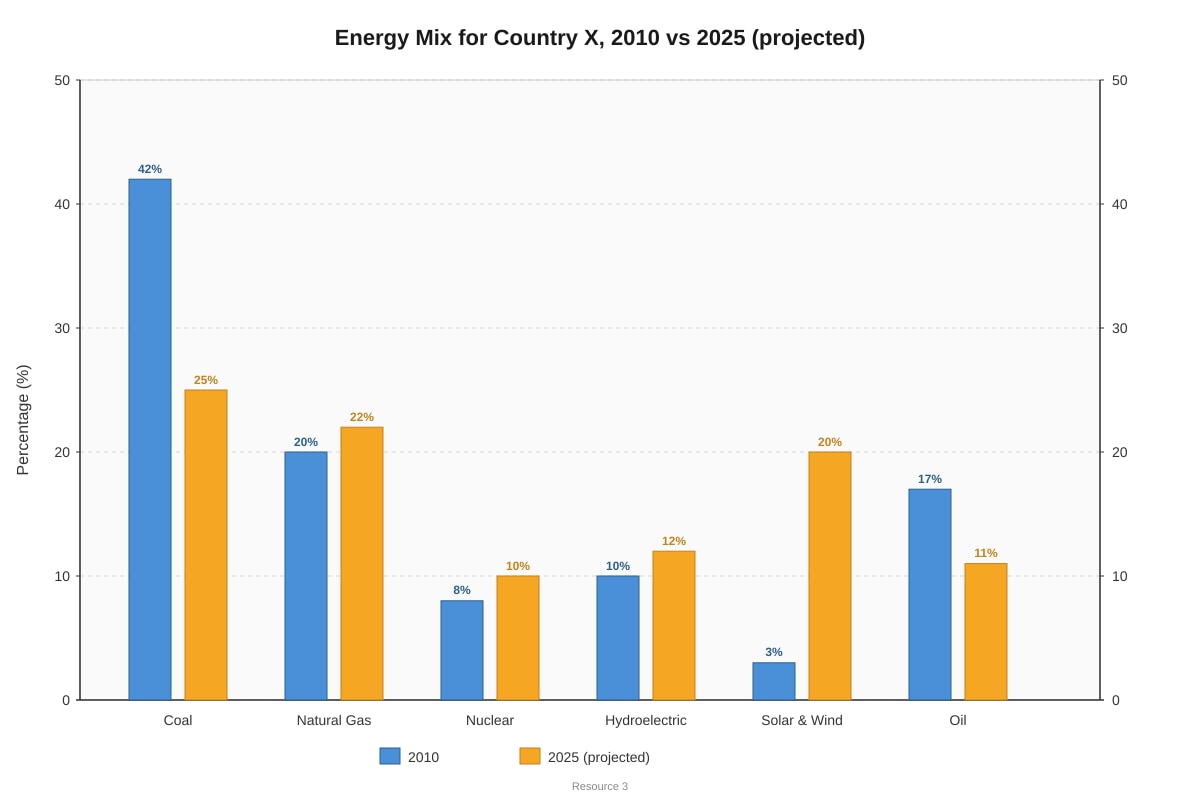
Generated chart for Q3.
(a) Describe the changes in Country X's energy mix between 2010 and 2025 (projected). [5]
(b) To what extent is Country X's projected energy transition sustainable? Discuss with reference to two dimensions of sustainability. [8]
Section B: Structured and Essay Questions (30 marks)
Answer ALL questions in this section.
Question 4
(a) Define the term carrying capacity in the context of resource sustainability. [2]
(b) Explain how overexploitation of a named renewable resource can lead to its depletion. Support your answer with a specific example. [6]
Question 5
Resource 4 shows data on food security indicators for four Southeast Asian countries in 2022.
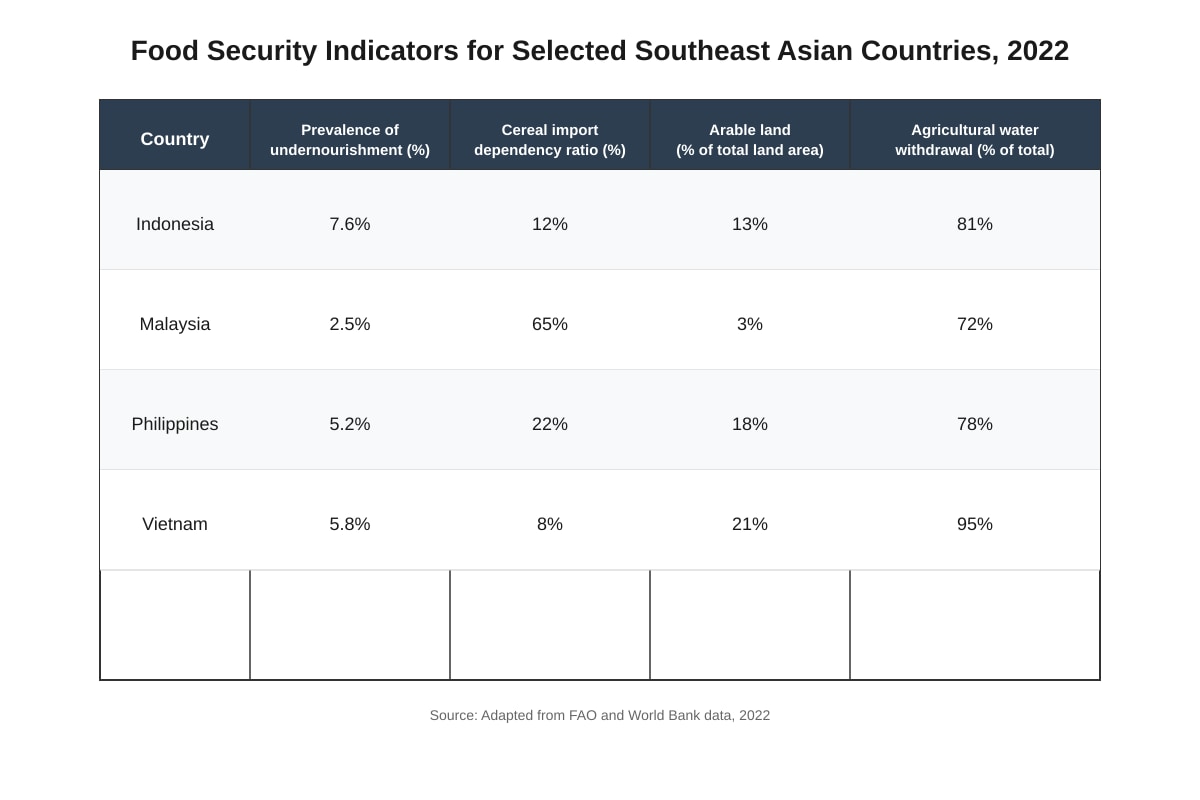
Generated table for Q5.
(a) Using Resource 4, compare the food security challenges faced by Malaysia and Vietnam. [5]
(b) Evaluate the effectiveness of technological solutions in addressing food insecurity in Southeast Asia. [12]
END OF PAPER
Section A Total: 30 marks | Section B Total: 30 marks | Grand Total: 60 marks
Answers
TuitionGoWhere Practice Paper - Geography H2 A-Level
Answer Key & Marking Scheme
Subject: Geography | Level: A-Level H2 | Paper: Practice Paper — Resources Sustainability | Version: 1 of 5
Section A: Source-Based Questions (30 marks)
Question 1(a) [5 marks]
Question: Compare the Ecological Footprint per capita for the six countries shown in Resource 1.
Expected Answer / Marking Descriptors:
| Marks | Descriptor |
|---|---|
| 1–2 | Simple description of individual country figures with little or no comparative language. Limited reference to data. |
| 3–4 | Clear comparison using comparative language ("higher than," "lower than," "similar to"). References to most countries and both years. Some use of data to support comparison. |
| 5 | Comprehensive comparison covering all six countries, using comparative language throughout, with accurate data reference. Identifies the highest and lowest values and notes the overall range. |
Model Answer:
Australia had the highest Ecological Footprint per capita in both 2010 (6.8 gha) and 2020 (6.6 gha), significantly exceeding all other countries. Japan also had a relatively high footprint, though it decreased from 4.7 gha to 4.1 gha. China showed the most dramatic change, rising from 2.2 gha to 3.7 gha, surpassing Brazil (2.9 to 2.8 gha) by 2020. India's footprint increased from 0.9 to 1.2 gha, while Nigeria's decreased slightly from 1.1 to 1.0 gha — both remaining among the lowest. Overall, the range between the highest (Australia, 6.6 gha) and lowest (Nigeria, 1.0 gha) was substantial at 5.6 gha in 2020.
Teaching Notes:
- Ecological Footprint measures the amount of biologically productive land and water area required to produce the resources a population consumes and to absorb its waste, using prevailing technology. It is measured in global hectares (ghha).
- A strong comparison must use comparative language (e.g., "higher than," "in contrast," "whereas") rather than simply listing figures. Students should identify the highest and lowest values and note the range.
- Common mistake: Students often describe each country individually without making direct comparisons between them. This limits marks to the 1–2 band.
Question 1(b) [4 marks]
Question: Suggest two reasons why China's Ecological Footprint per capita increased significantly between 2010 and 2020.
Expected Answer / Marking Descriptors:
| Marks | Descriptor |
|---|---|
| 1–2 | One valid reason explained, or two reasons stated but not developed. |
| 3–4 | Two distinct, well-explained reasons with clear links to increased resource consumption or waste generation. |
Model Answer:
Reason 1: Rapid industrialisation and economic growth. China's GDP per capita grew substantially between 2010 and 220, leading to increased consumption of energy, raw materials, and manufactured goods. Industrial production, particularly in sectors like steel, cement, and electronics, requires large inputs of natural resources and generates significant waste and emissions, all of which increase the per capita footprint.
Reason 2: Rising living standards and urbanisation. As more of China's population moved into urban areas and joined the middle class, consumption patterns shifted towards more resource-intensive diets (more meat), greater use of private vehicles, increased energy consumption for heating/cooling, and higher demand for consumer goods. Urban lifestyles generally have a larger per capita footprint than rural ones.
Teaching Notes:
- Students should link each reason directly to increased resource use or increased waste/emissions, not just state general facts about China's development.
- Acceptable alternatives include: growth in manufacturing exports, expansion of infrastructure (roads, buildings), dietary shifts, increased car ownership.
- Each reason should be a separate, distinct point with a clear explanation of the causal chain.
Question 2(a) [4 marks]
Question: Using Resource 2, describe the trend in Singapore's approach to water sustainability.
Expected Answer / Marking Descriptors:
| Marks | Descriptor |
|---|---|
| 1–2 | Simple description with limited reference to the resource. Identifies one aspect of the strategy. |
| 3–4 | Detailed description with clear reference to the resource. Covers multiple aspects: diversification, targets, and the shift away from imported water. Uses data from the resource. |
Model Answer:
Singapore's approach to water sustainability shows a clear trend towards diversification and self-sufficiency. The government has developed the "Four National Taps" strategy to reduce reliance on imported water, which currently accounts for approximately 35% of supply (and historically up to 40%). There is a significant shift towards NEWater (recycled water), which already meets 30% of demand and is projected to meet 55% by 2060. Desalination is also being expanded from 15% of current supply. Simultaneously, the government is investing in energy efficiency for these processes, aiming to reduce desalination energy from 3.5 kWh/m³ to 1.5 kWh/m³ by 2030, indicating a trend towards making water production itself more sustainable.
Teaching Notes:
- "Describe the trend" requires students to identify the direction of change (increasing self-sufficiency, diversification, technological improvement) and support it with specific data from the resource.
- Common mistake: Students may simply list the four taps without describing the trend (i.e., the shift in proportions and the direction of change over time).
- Award marks for quoting specific figures from the resource (e.g., "55% by 2060," "3.5 kWh/m³").
Question 2(b) [4 marks]
Question: Explain two challenges Singapore faces in achieving water sustainability.
Expected Answer / Marking Descriptors:
| Marks | Descriptor |
|---|---|
| 1–2 | One challenge explained, or two challenges stated but not developed. |
| 3–4 | Two distinct challenges clearly explained with specific reference to Singapore's context. |
Model Answer:
Challenge 1: High energy intensity of alternative water sources. Both NEWater (which uses advanced membrane technology and UV treatment) and desalination (which uses reverse osmosis) are highly energy-intensive. Desalination currently requires 3.5 kWh per cubic metre of water. This creates a tension between water sustainability and energy/carbon sustainability — increasing water self-sufficiency may increase Singapore's carbon footprint unless renewable energy is scaled up simultaneously.
Challenge 2: Limited land area for water catchment. Singapore is a small island city-state with limited land area. Although it has expanded local catchment to cover two-thirds of its land surface, there is a physical limit to how much rainwater can be collected. Competing land uses (housing, commerce, transport, green spaces) constrain the expansion of reservoirs and catchment areas, making it difficult to further increase the share of local catchment water.
Teaching Notes:
- Other acceptable challenges include: dependence on Malaysia (geopolitical risk), high capital costs of desalination and NEWater plants, climate change affecting rainfall patterns, small catchment area.
- Each challenge must be explained (not just stated) with a clear link to why it hinders water sustainability in Singapore specifically.
Question 3(a) [5 marks]
Question: Describe the changes in Country X's energy mix between 2010 and 2025 (projected).
Expected Answer / Marking Descriptors:
| Marks | Descriptor |
|---|---|
| 1–2 | Simple description of one or two changes. Limited use of data. |
| 3–4 | Clear description of several changes with data reference. Covers both increases and decreases. |
| 5 | Comprehensive description covering all major changes, with accurate data throughout. Identifies the most significant changes and overall trend. |
Model Answer:
Country X's energy mix is projected to undergo significant changes between 2010 and 2025. The most notable change is the decline in coal from 42% to 25%, a drop of 17 percentage points, making it less dominant though still the largest single source. Solar and wind energy show the most dramatic growth, rising from just 3% to 20% — a more than sixfold increase. Oil also declines from 17% to 11%. Meanwhile, natural gas increases slightly from 20% to 22%, nuclear rises from 8% to 10%, and hydroelectric grows modestly from 10% to 12%. Overall, the trend is a shift away from fossil fuels (particularly coal and oil) towards renewables and low-carbon sources.
Teaching Notes:
- "Describe the changes" requires students to identify what has increased, what has decreased, and by how much. Data must be used to support the description.
- Students should note the magnitude of changes, not just the direction. The largest changes (coal decline, solar/wind growth) should be highlighted.
- Common mistake: Students may only describe increases or only decreases, missing the full picture.
Question 3(b) [8 marks]
Question: To what extent is Country X's projected energy transition sustainable? Discuss with reference to two dimensions of sustainability.
Expected Answer / Marking Descriptors:
| Marks | Descriptor |
|---|---|
| 1–3 | Limited understanding of sustainability dimensions. One-sided argument. Little or no reference to Resource 3. |
| 4–6 | Explains sustainability in relation to one or two dimensions. Some reference to Resource 3. Argument is partially balanced but may lack depth. |
| 7–8 | Well-structured, balanced argument addressing two clear dimensions of sustainability (e.g., environmental, economic, social). Detailed reference to Resource 3 data. Reaches a substantiated conclusion. |
Model Answer:
Environmental Dimension: Country X's energy transition shows strong progress towards environmental sustainability. The decline in coal from 42% to 25% and oil from 17% to 11% represents a significant reduction in high-carbon energy sources, which would lower greenhouse gas emissions and air pollution. The dramatic increase in solar and wind energy (3% to 20%) further supports this, as these are clean, renewable sources with minimal operational emissions. However, coal still accounts for 25% of the energy mix in 2025, meaning Country X remains heavily reliant on fossil fuels. Additionally, the sustainability of solar and wind depends on the energy and materials used to manufacture panels and turbines, and the management of end-of-life waste from these technologies.
Economic Dimension: The transition presents both opportunities and challenges economically. Investment in renewable energy infrastructure (solar, wind) can create new industries, jobs, and technological expertise, contributing to long-term economic sustainability. The growth in nuclear energy (8% to 10%) provides a stable, low-carbon baseload supply. However, the transition requires massive capital investment, and the decline of the coal industry may lead to job losses and economic disruption in coal-dependent regions. Natural gas, which increases slightly (20% to 22%), serves as a "transition fuel" but still represents fossil fuel dependency. The economic sustainability of the transition depends on whether new green jobs can replace lost fossil fuel jobs and whether energy costs remain affordable.
Conclusion: Country X's energy transition is partially sustainable. The environmental dimension shows clear improvement with the shift to renewables, but the continued reliance on coal (25%) and fossil fuels overall (58% combined) limits the extent of sustainability. Economically, the transition is promising but carries risks of disruption. A truly sustainable transition would require further reducing coal dependency and ensuring a just transition for affected workers and communities.
Teaching Notes:
- This is an evaluative question ("To what extent..."). Students must present a balanced argument and reach a substantiated conclusion.
- The two dimensions should be clearly identified (e.g., environmental, economic, social). Students should discuss both the positive and negative aspects within each dimension.
- Reference to Resource 3 data is essential throughout. Answers that do not use the data will be capped at the lower mark band.
- Common mistake: Students may only discuss the positives without acknowledging limitations, or may discuss sustainability in vague terms without linking to specific dimensions.
Section B: Structured and Essay Questions (30 marks)
Question 4(a) [2 marks]
Question: Define the term carrying capacity in the context of resource sustainability.
Expected Answer:
Carrying capacity is the maximum population size of a species that an environment can sustainably support indefinitely, given the available resources (food, water, habitat) and without causing environmental degradation.
Teaching Notes:
- Key elements of the definition: (1) maximum population/population size, (2) that can be sustained, (3) given available resources/environmental conditions.
- Students must refer to the idea of a limit imposed by the environment. Answers that only say "the number of people an area can support" without mentioning sustainability or environmental limits may receive only 1 mark.
- Carrying capacity is a dynamic concept — it can change with technology, consumption patterns, and environmental conditions.
Question 4(b) [6 marks]
Question: Explain how overexploitation of a named renewable resource can lead to its depletion. Support your answer with a specific example.
Expected Answer / Marking Descriptors:
| Marks | Descriptor |
|---|---|
| 1–2 | Basic understanding of overexploitation. Example may be vague or missing. Limited explanation of the process. |
| 3–4 | Clear explanation of the process of overexploitation leading to depletion. A named resource is identified with some specific detail. |
| 5–6 | Detailed, well-structured explanation with a clear causal chain. Specific example with accurate detail. Explains the concept of sustainable yield vs. overexploitation. |
Model Answer:
Named resource: Fish stocks (marine fisheries)
Renewable resources like fish populations can regenerate naturally through reproduction, but only up to a certain rate known as the sustainable yield — the maximum harvest that can be taken without reducing the population's ability to replenish itself. When overexploitation occurs (i.e., harvesting exceeds the sustainable yield), the population is removed faster than it can reproduce, leading to a decline in stock size.
Over time, if overexploitation continues, the population may fall below the minimum viable population threshold, where there are too few breeding individuals to sustain the population. This can lead to commercial depletion (where it is no longer economically viable to fish) or even biological collapse of the stock.
Example: The collapse of the Atlantic cod fishery off Newfoundland, Canada. For centuries, the Grand Banks supported one of the world's richest cod fisheries. However, from the 1960s onwards, industrial fishing using factory trawlers dramatically increased catches, exceeding the cod's reproductive capacity. Despite warnings from scientists, fishing continued at unsustainable levels. By 1992, cod stocks had collapsed to less than 1% of their historical levels, and the Canadian government declared a moratorium on cod fishing. Over 40,000 people lost their jobs, and the ecosystem of the Grand Banks was fundamentally altered. Even decades later, cod stocks have not fully recovered.
Teaching Notes:
- Students must name a specific renewable resource (e.g., not just "forests" but "tropical hardwood forests in Borneo"; not just "water" but "groundwater aquifers in the Ogallala region").
- The explanation should include the concept of sustainable yield and the idea that overexploitation exceeds this threshold.
- A clear causal chain is needed: overexploitation → harvest exceeds regeneration → population decline → potential collapse/depletion.
- Common mistake: Students may describe the consequences of depletion without explaining the process of how overexploitation leads to it.
Question 5(a) [5 marks]
Question: Using Resource 4, compare the food security challenges faced by Malaysia and Vietnam.
Expected Answer / Marking Descriptors:
| Marks | Descriptor |
|---|---|
| 1–2 | Simple description of one country's data with little comparison. Limited use of data. |
| 3–4 | Clear comparison with data reference. Covers multiple indicators. Uses comparative language. |
| 5 | Comprehensive comparison across all indicators. Accurate data use. Identifies the distinct nature of each country's challenges. |
Model Answer:
Malaysia and Vietnam face distinctly different food security challenges. Malaysia has a very low prevalence of undernourishment (2.5%) compared to Vietnam (5.8%), suggesting that calorie deficiency is less of a concern in Malaysia. However, Malaysia has an extremely high cereal import dependency ratio (65%) compared to Vietnam's very low ratio (8%), indicating that Malaysia is heavily reliant on imported food — particularly cereals — making it vulnerable to global supply chain disruptions and price fluctuations. Vietnam, by contrast, is largely self-sufficient in cereals.
In terms of agricultural resources, Vietnam has a much higher proportion of arable land (21% of total land area) compared to Malaysia (3%), giving Vietnam greater domestic agricultural potential. However, Vietnam's agricultural water withdrawal is extremely high at 95% of total water withdrawal, compared to Malaysia's 72%. This suggests that Vietnam's agriculture is heavily dependent on water resources, making it vulnerable to water scarcity, drought, or competition from other sectors. Malaysia, while having less arable land, has a more diversified water use profile.
Overall, Malaysia's key food security challenge is import dependency (external vulnerability), while Vietnam's is resource pressure on water (internal vulnerability) despite greater self-sufficiency.
Teaching Notes:
- Students must use comparative language and reference specific data from the resource.
- The comparison should go beyond simply stating numbers — students should interpret what the data means in terms of food security challenges.
- Common mistake: Students may describe each country separately without making direct comparisons, or may only compare one indicator instead of multiple indicators.
Question 5(b) [12 marks]
Question: Evaluate the effectiveness of technological solutions in addressing food insecurity in Southeast Asia.
Expected Answer / Marking Descriptors:
| Marks | Descriptor |
|---|---|
| 1–4 | Limited knowledge of technological solutions. One-sided argument. Little reference to Southeast Asian context. Generic statements. |
| 5–8 | Describes several technological solutions with some evaluation. Some reference to Southeast Asia. Argument has some balance but may lack depth or specific examples. |
| 9–12 | Detailed knowledge of multiple technological solutions. Well-structured evaluation with clear criteria. Specific Southeast Asian examples. Balanced argument acknowledging both effectiveness and limitations. Reaches a substantiated conclusion. |
Model Answer:
Introduction: Food insecurity in Southeast Asia stems from a combination of population growth, climate change, land degradation, and unequal access to resources. Technological solutions — from biotechnology to precision agriculture — have been widely promoted as means to increase food production and reduce insecurity. This essay evaluates their effectiveness.
Technological Solutions and Their Effectiveness:
1. High-Yielding Variety (HYV) Seeds and Green Revolution Technologies The adoption of HYV rice seeds during the Green Revolution dramatically increased yields across Southeast Asia. In the Philippines, IRRI-developed rice varieties helped the country achieve rice self-sufficiency in the 1970s–80s. Vietnam's adoption of improved rice varieties contributed to its transformation from a food-deficit country to one of the world's largest rice exporters. This demonstrates that seed technology can be highly effective in increasing staple crop production.
However, the Green Revolution also led to increased dependence on chemical inputs (fertilisers, pesticides), which degraded soils and waterways over time. Smallholder farmers often could not afford the inputs required, leading to increased inequality. The long-term sustainability of yield gains is questionable without continued input intensification.
2. Precision Agriculture and Smart Farming Technologies such as GPS-guided tractors, drone-based crop monitoring, and sensor-based irrigation systems can optimise resource use and reduce waste. In Malaysia, the use of precision agriculture in palm oil plantations has improved yields while reducing fertiliser use by 15–20%. These technologies allow farmers to apply the right amount of inputs at the right time and place.
However, precision agriculture requires significant capital investment, technical expertise, and digital infrastructure. In Southeast Asia, where the majority of farmers are smallholders with limited land and resources (e.g., rice farmers in Myanmar or Cambodia averaging less than 2 hectares), these technologies are often inaccessible. The digital divide between large commercial farms and smallholders limits the overall effectiveness of this solution.
3. Biotechnology and Genetically Modified Organisms (GMOs) Genetic modification can create crops that are drought-resistant, pest-resistant, or nutritionally enhanced. Golden Rice, engineered to produce beta-carotene (Vitamin A), was developed to address micronutrient deficiency in rice-dependent populations. Bt rice varieties can reduce pest damage and pesticide use.
However, GMO adoption in Southeast Asia has been slow due to public resistance, regulatory hurdles, and concerns about biodiversity and corporate control of seed supply. The Philippines approved Golden Rice in 2021, but uptake remains limited. Environmental risks, such as gene flow to wild relatives and the development of resistant pest populations, also raise concerns.
4. Cold Chain and Post-Harvest Technology An estimated 20–40% of food produced in Southeast Asia is lost post-harvest due to inadequate storage, processing, and transportation. Improved cold chain infrastructure (refrigerated storage and transport) can dramatically reduce food losses. Thailand has invested in cold chain logistics for its fruit and vegetable exports, reducing post-harvest losses by up to 30%.
However, cold chain infrastructure is expensive to build and maintain, particularly in rural and remote areas. Energy costs and the lack of reliable electricity in parts of rural Southeast Asia (e.g., in parts of Indonesia or Myanmar) limit the feasibility of this solution.
5. Vertical Farming and Urban Agriculture Singapore has pioneered vertical farming to produce leafy vegetables in urban settings, reducing reliance on food imports. Companies like Sky Greens use rotating vertical towers to grow vegetables with minimal land and water.
However, vertical farming is currently limited to high-value, fast-growing crops (leafy greens, herbs) and cannot replace staple crop production. The high energy costs of artificial lighting and climate control raise questions about the sustainability and scalability of this approach.
Conclusion: Technological solutions have demonstrated significant effectiveness in increasing food production and reducing losses in Southeast Asia, as evidenced by Vietnam's rice export success and Thailand's cold chain improvements. However, their effectiveness is unevenly distributed — large commercial farms benefit disproportionately, while smallholders, who form the majority of farmers, often lack access due to cost, infrastructure, and knowledge barriers. Furthermore, some technologies create new environmental or social problems (input dependency, biodiversity loss, corporate control). Technology alone is necessary but not sufficient to address food insecurity; it must be accompanied by supportive policies, equitable access, investment in rural infrastructure, and attention to the root causes of inequality and poverty.
Teaching Notes:
- This is a 12-mark essay requiring evaluation — students must weigh the effectiveness of technological solutions, not just describe them.
- A strong answer will: (1) identify multiple specific technologies, (2) evaluate each with reference to Southeast Asian examples, (3) acknowledge limitations and trade-offs, (4) reach a clear, substantiated conclusion.
- Students should use specific country examples from Southeast Asia (e.g., Singapore, Vietnam, Philippines, Thailand, Malaysia, Indonesia, Myanmar, Cambodia).
- Common mistakes: (a) describing technologies without evaluating effectiveness, (b) using only generic examples not tied to Southeast Asia, (c) presenting a one-sided argument (only positive or only negative), (d) failing to reach a conclusion.
- Marking: Award up to 4 marks for knowledge of technologies, up to 4 marks for evaluation/analysis, up to 2 marks for examples, and up to 2 marks for structure and conclusion.
END OF ANSWER KEY
Mark Summary:
| Question | Marks |
|---|---|
| 1(a) | 5 |
| 1(b) | 4 |
| 2(a) | 4 |
| 2(b) | 4 |
| 3(a) | 5 |
| 3(b) | 8 |
| 4(a) | 2 |
| 4(b) | 6 |
| 5(a) | 5 |
| 5(b) | 12 |
| Section A Total | 30 |
| Section B Total | 30 |
| Grand Total | 60 |
Free quiz and exam paper access
Enter your details to view this paper
Your access is remembered on this device.