AI Generated Quiz
A Level H1 Geography Resources Sustainability Quiz
Free A Level H1 Geography Resources Sustainability quiz, HY3 AI version, with questions, answers, and A Level-style practice for Singapore students.
These static practice materials are generated from the site's syllabus and paper-generation workflow, with source and model context shown so students and parents can evaluate the material before use.
Questions
Free quiz and exam paper access
Enter your details to view this paper
Your access is remembered on this device.
Answers
A-Level Geography H1 Quiz - Resources Sustainability (Answer Key)
Total Marks: 40
Topic: Resources Sustainability
Note: Syllabus-first practice content from LLM-inferred templates; not past-year exam derived.
Section A Answers (1–8)
1. [2 marks]
Definition: Sustainable development is development that meets the needs of the present without compromising the ability of future generations to meet their own needs, within urban resource limits.
Teaching note: In urban context, this means using resources (water, land, energy) so cities remain functional long-term.
Mark breakdown: 1 mark for present-future balance; 1 mark for resource/urban link.
2. [1 mark]
Any one: open dumping, low collection coverage, informal recycling, riverine dumping.
Common mistake: naming hazardous waste (not asked).
3. [1 mark]
Rural-urban migration exceeding affordable housing supply; or rapid population growth.
4. [1 mark]
To attract investment/tourism; to create jobs; to raise land values.
5. [2 marks]
Liveability is the subjective quality of life in a place, while sustainability is the capacity to maintain resource use over time.
Mark: 1 for each concept correctly distinguished.
6. [1 mark]
Limited pension coverage; inability to work; high cost of aged care.
7. [1 mark]
Safety concerns in public spaces; unequal access to transport; wage gap.
8. [2 marks]
Any two: economic (jobs), environmental (air quality), social (community). 1 mark each.
Section B Answers (9–14)
9. [4 marks]
City A (low income) has low formal collection (40%) due to limited infrastructure and funding → waste accumulates, harming sustainability. City B (high income) has 95% collection from better systems and public capacity to pay. Differences due to development level, governance, and finance.
Mark: 2 for describing gap with data; 2 for causal explanation (development, infrastructure).
10. [4 marks]
(i) Poor construction: makeshift shelters from scrap → indicates poverty/informality.
(ii) Overcrowding: <1m spacing → health risk, service stress.
(iii) No piped water → service deficit.
(iv) Shared standpipe → limited access.
(Any 2 explained = 4 marks; 2 marks each with evidence+link)
11. [2 marks]
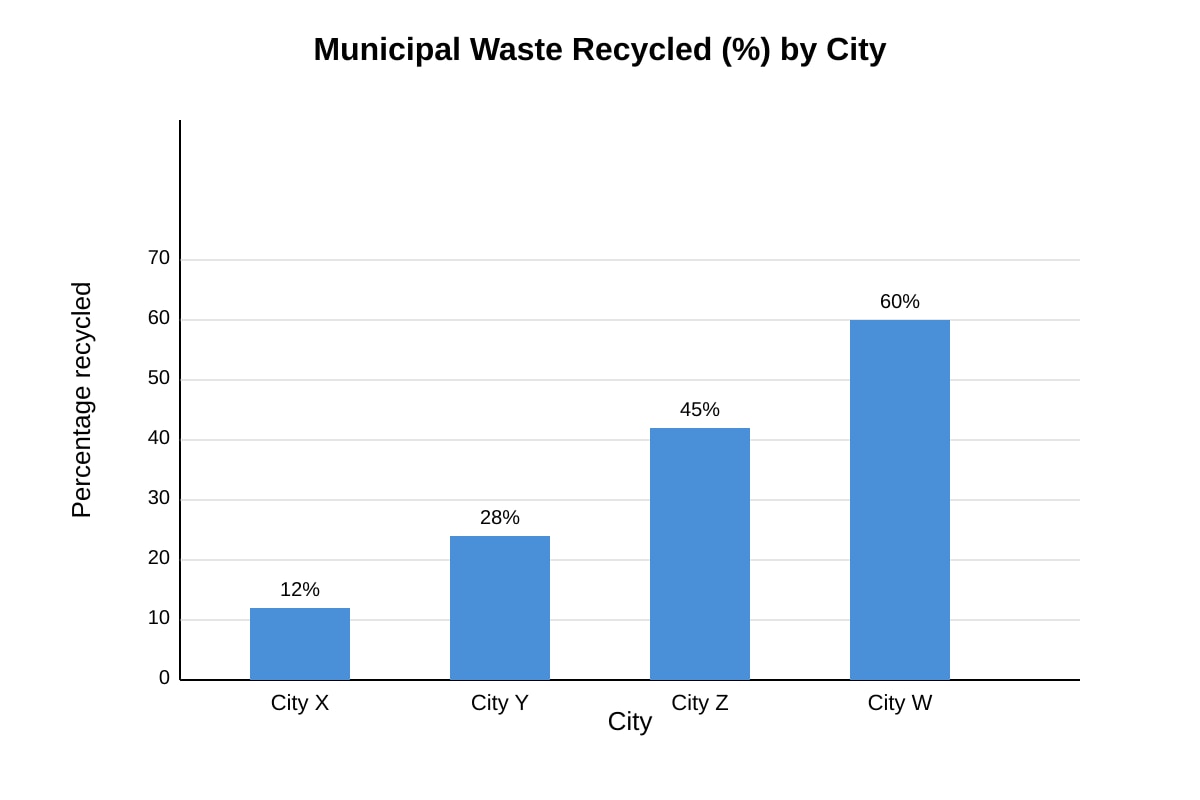
Recycling rises from X (12%) to W (60%); clear increasing trend across cities.
Mark: 1 for values, 1 for trend stated.
12. [2 marks]
City W may have better separation infrastructure, policies, or public awareness.
Mark: 1 reason + 1 link to graph.
13. [4 marks]
Useful: direct feedback from elderly, context-specific (1). Limitation: small sample, bias if only accessible residents surveyed (1). Overall: useful for needs but must pair with stats (2 for judgment).
Mark descriptors: strength (1), weakness (1), balanced conclusion (2).
14. [2 marks]
Tension: tourism development may raise costs/living pressure on locals (liveability for original residents drops) while environment improved (sustainability).
Mark: 1 identification, 1 explanation.
Section C Answers (15–20)
15. [2 marks]
Prevents pollution, protects health, conserves resources for future. 1 mark each for two points.
16. [2 marks]
(i) Overburdens services; (ii) informal expansion harms environment. 1 each.
17. [2 marks]
Safer public spaces, amenities → women's social well-being improves. 1 for strategy, 1 for gender link.
18. [2 marks]
For: green spaces aid both. Against: high liveability consumption conflicts with limits. 1 each.
19. [2 marks]
Strategy: community composting. Challenge: low awareness/funding. 1 each.
20. [2 marks]
More elderly need healthcare, housing, transport → higher per-capita resource demand. 1 concept, 1 application.