AI Generated Quiz
A Level H1 Geography Resources Sustainability Quiz
Free A Level H1 Geography Resources Sustainability quiz, AI version, with questions, answers, and A Level-style practice for Singapore students.
These static practice materials are generated from the site's syllabus and paper-generation workflow, with source and model context shown so students and parents can evaluate the material before use.
Questions
Free quiz and exam paper access
Enter your details to view this paper
Your access is remembered on this device.
Answers
A-Level Geography H1 Quiz - Resources Sustainability: Answer Key
Total Marks: 50
Section A: Short-Answer Questions (Questions 1–5)
1. Define the term 'sustainable development' as it applies to resource management. [2]
Answer: Sustainable development is development that meets the needs of the present without compromising the ability of future generations to meet their own needs. In resource management, this means using resources at a rate that does not deplete them for future use, balancing economic, social, and environmental considerations.
Marking Scheme:
- 1 mark for defining sustainable development (meeting present needs without compromising future generations)
- 1 mark for applying it to resource management (using resources responsibly to ensure availability for the future)
Common Mistake: Students often define sustainable development generally without linking it specifically to resource management.
2. State two reasons why effective waste management is important for sustainable urban development. [2]
Answer:
- It prevents environmental pollution (e.g., contamination of soil, water, and air) which protects ecosystems and public health.
- It conserves resources through recycling and recovery, reducing the need for raw material extraction and promoting a circular economy.
Marking Scheme:
- 1 mark for each valid reason (2 marks total)
- Accept: reduces greenhouse gas emissions from landfills, saves land space, creates economic opportunities through recycling, improves quality of life
Common Mistake: Students may give vague answers like "it's good for the environment" without specifying how.
3. Identify two non-hazardous solid waste problems commonly faced by cities in less developed countries. [2]
Answer:
- Inadequate collection services leading to illegal dumping and accumulation of waste in streets and waterways.
- Open dumping and burning of waste, causing air pollution and health hazards.
Marking Scheme:
- 1 mark for each valid problem (2 marks total)
- Accept: lack of proper landfill sites, contamination of water sources, breeding grounds for disease vectors (e.g., mosquitoes), scavenging by humans and animals at dump sites
Common Mistake: Students may list hazardous waste problems (e.g., toxic chemicals) which are not the focus of the question.
4. Explain the difference between a 'renewable' and a 'non-renewable' resource. [2]
Answer: A renewable resource is one that can be replenished naturally over a short period of time (e.g., solar energy, wind, timber) and can be used sustainably if consumption does not exceed regeneration rates. A non-renewable resource is one that exists in finite quantities and takes millions of years to form (e.g., fossil fuels, minerals), so it will eventually be depleted.
Marking Scheme:
- 1 mark for correctly defining renewable resource
- 1 mark for correctly defining non-renewable resource
- Accept: clear distinction based on replenishment rate
Common Mistake: Students may confuse 'renewable' with 'recyclable' or think all renewable resources are unlimited.
5. What is meant by the term 'ecological footprint'? [2]
Answer: The ecological footprint is a measure of the demand humans place on the environment, expressed as the area of land and water required to produce the resources consumed and to absorb the waste generated by a population or activity. It is usually measured in global hectares per person.
Marking Scheme:
- 1 mark for defining it as a measure of human demand on the environment
- 1 mark for mentioning resource consumption and waste absorption
- Accept: reference to land/water area required, comparison to biocapacity
Common Mistake: Students may define it simply as "human impact on the environment" without the quantitative aspect of land/water area.
Section B: Data-Response Questions (Questions 6–10)
6. Using Resource 1, describe the trend in municipal solid waste generation per capita in Mumbai from 2010 to 2020. [2]
Answer: Mumbai's per capita waste generation increased from 180 kg in 2010 to 260 kg in 2020, representing a significant rise of 80 kg (44%) over the decade. This indicates a clear upward trend.
Marking Scheme:
- 1 mark for identifying the direction of the trend (increase/upward)
- 1 mark for providing specific data from the resource (180 kg to 260 kg)
Common Mistake: Students may describe the trend without quoting specific figures from the resource.
7. Using Resource 1, compare the waste generation patterns of Singapore and Tokyo between 2010 and 2020. [3]
Answer: Singapore's per capita waste generation increased from 380 kg to 420 kg (a rise of 40 kg), while Tokyo's decreased slightly from 350 kg to 340 kg (a decline of 10 kg). In 2010, Singapore generated more waste than Tokyo (380 kg vs 350 kg), and this gap widened by 2020 (420 kg vs 340 kg). The two cities show opposite trends: Singapore's waste generation is rising, while Tokyo's is falling.
Marking Scheme:
- 1 mark for identifying Singapore's upward trend with data
- 1 mark for identifying Tokyo's downward trend with data
- 1 mark for a comparative statement (e.g., widening gap, opposite trends)
Common Mistake: Students may describe each city separately without making a direct comparison.
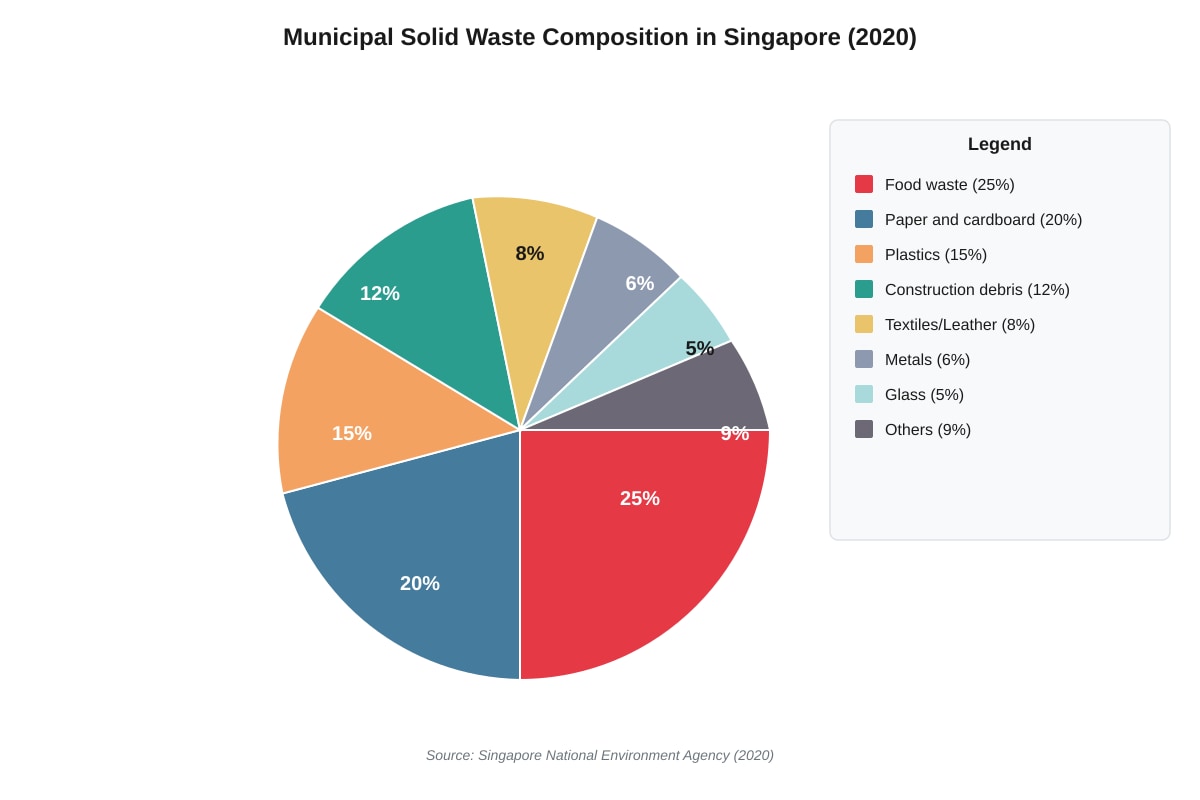
8. Using Resource 2, identify the two largest components of Singapore's municipal solid waste. Suggest one reason why these components dominate. [3]
Answer: The two largest components are food waste (25%) and paper and cardboard (20%). These dominate because Singapore is a highly urbanised, affluent society with a strong consumer culture. High food consumption, especially in a food-centric culture with many dining options, leads to significant food waste from households, food courts, and restaurants. Paper and cardboard waste is high due to packaging from online shopping, commercial activities, and office paper use.
Marking Scheme:
- 1 mark for correctly identifying food waste (25%) and paper/cardboard (20%)
- 2 marks for a well-reasoned explanation linking to Singapore's affluence, consumer culture, or urban lifestyle
- Accept: high population density, large food service industry, e-commerce growth
Common Mistake: Students may identify the components but fail to provide a convincing reason for their dominance.
9. Explain why cities in less developed countries (LDCs) often have lower per capita waste generation than cities in more developed countries (MDCs), using data from Resource 1 to support your answer. [4]
Answer: Cities in LDCs generally have lower per capita waste generation due to lower levels of consumption and economic activity. For example, Mumbai (260 kg) and Lagos (240 kg) have significantly lower waste generation than Singapore (420 kg) and London (440 kg). Reasons include:
- Lower purchasing power means less consumption of packaged goods and disposable products.
- More informal recycling and reuse practices (e.g., scavenging, repairing items).
- Smaller proportion of processed and packaged food in diets.
- Less commercial and industrial activity generating waste.
Marking Scheme:
- 1 mark for identifying the pattern (LDCs have lower waste generation)
- 1 mark for using specific data from Resource 1 (e.g., Mumbai 260 kg vs Singapore 420 kg)
- 2 marks for explaining reasons (at least two valid explanations)
- Accept: lower GDP per capita, less consumerism, different consumption patterns, informal waste sector
Common Mistake: Students may describe the data without explaining the underlying reasons.
10. Evaluate the usefulness of Resource 1 and Resource 2 in understanding the challenges of waste management in Singapore. [4]
Answer: Usefulness:
- Resource 1 shows Singapore's per capita waste generation (420 kg in 2020) and the upward trend, indicating a growing waste management challenge.
- Resource 2 shows the composition of waste, which helps identify priority areas for intervention (e.g., food waste reduction, recycling of paper/plastics).
Limitations:
- Resource 1 only provides data for two years (2010 and 2020), so it does not show year-to-year fluctuations or the impact of specific policies.
- Resource 2 does not show how waste composition has changed over time or the effectiveness of recycling programmes.
- Neither resource provides information on waste disposal methods (e.g., incineration, landfill rates), recycling rates, or the economic costs of waste management.
Overall: The resources are useful for identifying the scale and composition of the waste problem but are limited in explaining the effectiveness of management strategies or trends over time.
Marking Scheme:
- 1 mark for identifying a strength of Resource 1
- 1 mark for identifying a strength of Resource 2
- 1 mark for identifying a limitation of either resource
- 1 mark for an overall evaluative statement
- Accept: well-reasoned points about data gaps, temporal limitations, or missing variables
Common Mistake: Students may describe the resources without evaluating their usefulness or limitations.
Section C: Structured Questions (Questions 11–15)
11. Explain two environmental impacts of improper disposal of non-hazardous solid waste in urban areas. [4]
Answer:
- Soil and water contamination: When waste is dumped in open areas or unlined landfills, leachate (liquid that percolates through waste) can seep into the ground, contaminating soil and groundwater. This can harm ecosystems and pose health risks to humans who rely on contaminated water sources.
- Air pollution: Open burning of waste releases toxic gases (e.g., dioxins, furans) and particulate matter into the air, contributing to respiratory illnesses and smog. Decomposing organic waste in landfills produces methane, a potent greenhouse gas that contributes to climate change.
Marking Scheme:
- 1 mark for each correctly identified impact (2 marks)
- 1 mark for each explanation of how the impact occurs (2 marks)
- Accept: breeding of disease vectors, aesthetic degradation, greenhouse gas emissions
Common Mistake: Students may list impacts without explaining the mechanism (how the impact occurs).
12. Describe two strategies that cities in less developed countries can use to improve their waste management systems. [4]
Answer:
- Community-based waste collection programmes: Local governments can partner with community organisations to establish neighbourhood collection points and regular collection schedules. This is more affordable than door-to-door collection and can reach informal settlements. For example, in Pune, India, a community-led system has improved collection rates in slums.
- Promoting the informal recycling sector: Instead of suppressing scavenging, cities can integrate waste pickers into formal systems by providing protective equipment, fair prices for recyclables, and access to sorting facilities. This improves livelihoods while increasing recycling rates. For example, in Belo Horizonte, Brazil, waste pickers are officially recognised and paid for their services.
Marking Scheme:
- 1 mark for each strategy described (2 marks)
- 1 mark for each explanation of how it works or an example (2 marks)
- Accept: decentralised composting, public awareness campaigns, landfill improvements, waste-to-energy projects
Common Mistake: Students may describe strategies that are too expensive or technically complex for LDCs without considering affordability.
13. Account for the development of slums in urban areas of countries at different levels of development. [4]
Answer: In less developed countries (LDCs):
- Rapid rural-to-urban migration driven by push factors (lack of rural employment, poverty) and pull factors (perceived economic opportunities in cities).
- Inability of city governments to provide adequate housing and infrastructure due to limited financial resources and rapid population growth.
- High land prices and unaffordable formal housing force migrants to settle on vacant or marginal land.
In more developed countries (MDCs):
- Slums (often called 'inner-city deprivation' or 'ghettos') develop due to deindustrialisation, job losses, and suburbanisation of wealth.
- Lack of affordable housing in desirable urban areas leads to overcrowding and poor living conditions.
- Social factors such as discrimination, poverty, and lack of social mobility can concentrate disadvantage in certain neighbourhoods.
Marking Scheme:
- 2 marks for explaining slum development in LDCs (at least two factors)
- 2 marks for explaining slum development in MDCs (at least two factors)
- Accept: reference to specific examples (e.g., Dharavi in Mumbai, favelas in Rio de Janeiro, inner-city areas in Detroit)
Common Mistake: Students may focus only on LDCs and ignore the development of slums in MDCs.
14. Explain how the concept of 'multiple deprivations' affects the lives of slum dwellers. [4]
Answer: Multiple deprivations refer to the interconnected disadvantages that slum dwellers face across different dimensions of life:
- Economic deprivation: Lack of secure employment, low incomes, and limited access to credit or financial services trap slum dwellers in poverty.
- Social deprivation: Poor access to education and healthcare limits opportunities for social mobility and perpetuates the cycle of poverty.
- Environmental deprivation: Inadequate housing, lack of clean water and sanitation, and exposure to pollution create health risks and reduce quality of life.
- Political deprivation: Lack of legal tenure, limited political representation, and exclusion from decision-making processes make slum dwellers vulnerable to eviction and neglect.
These deprivations reinforce each other. For example, poor health (environmental deprivation) reduces ability to work (economic deprivation), which limits ability to afford education (social deprivation), creating a self-reinforcing cycle of poverty.
Marking Scheme:
- 1 mark for defining multiple deprivations
- 2 marks for explaining at least two types of deprivation with clear links to slum dwellers' lives
- 1 mark for explaining how deprivations are interconnected
- Accept: reference to UN-Habitat's definition, specific examples of deprivation
Common Mistake: Students may list deprivations without explaining how they affect lives or how they are interconnected.
15. Discuss the varying success of slum upgrading programmes across different places. [4]
Answer: Successful examples:
- Favela-Bairro Programme, Rio de Janeiro, Brazil: This programme integrated favelas into the formal city by providing infrastructure (water, sanitation, electricity), public spaces, and social services. It improved living conditions and residents' sense of belonging. Success factors included community participation and sustained government funding.
- Kampung Improvement Programme, Indonesia: This low-cost programme improved basic infrastructure in informal settlements across Indonesian cities. It was successful due to its community-based approach and use of appropriate technology.
Less successful examples:
- Forced evictions in various African cities: Some governments have demolished slums without providing alternative housing, displacing residents and destroying livelihoods. This approach fails to address the root causes of slum formation.
- Top-down projects with poor community engagement: Projects that do not involve residents in planning often fail because they do not meet actual needs or are not maintained by the community.
Factors affecting success: Community participation, secure tenure, adequate funding, appropriate technology, political will, and integration with broader urban planning.
Marking Scheme:
- 2 marks for discussing at least one successful example with reasons for success
- 2 marks for discussing at least one less successful example with reasons for failure
- Accept: reference to specific programmes and evaluation of outcomes
Common Mistake: Students may describe slum upgrading without evaluating its success or failure.
Section D: Essay Questions (Questions 16–20)
16. 'Economic growth is more important than environmental sustainability in resource management.' To what extent do you agree with this statement? [6]
Answer:
Level 1 (1-2 marks): Simple agreement or disagreement with limited explanation. Level 2 (3-4 marks): Balanced discussion with some examples but limited evaluation. Level 3 (5-6 marks): Well-structured evaluation with clear argument, counter-argument, and conclusion supported by specific examples.
Expected Content:
Arguments for economic growth being more important:
- Economic growth provides resources for investment in environmental protection and cleaner technologies.
- Developing countries need economic growth to lift people out of poverty, which is a prerequisite for environmental concern.
- Resource extraction and consumption drive economic development and job creation.
Arguments for environmental sustainability being more important:
- Environmental degradation undermines long-term economic growth by depleting natural capital.
- Climate change and resource depletion pose existential threats that cannot be ignored.
- Sustainable resource management can create new economic opportunities (e.g., renewable energy, green jobs).
Evaluation:
- The two goals are not necessarily in conflict; sustainable development seeks to integrate both.
- The appropriate balance depends on context: LDCs may prioritise economic growth, while MDCs can afford to prioritise sustainability.
- Short-term trade-offs may exist, but long-term sustainability is essential for continued economic prosperity.
Conclusion: A nuanced view is that both are important and should be pursued together through sustainable development approaches. Economic growth without environmental sustainability is short-sighted, but environmental sustainability without economic growth is politically and socially unrealistic.
Marking Scheme:
- 2 marks for presenting arguments supporting the statement
- 2 marks for presenting counter-arguments
- 2 marks for evaluation and conclusion with specific examples
- Accept: references to specific countries, policies, or case studies
Common Mistake: Students may take a one-sided view without acknowledging the complexity of the relationship.
17. Evaluate the effectiveness of the 'Reduce, Reuse, Recycle' (3Rs) approach in managing solid waste in cities. [6]
Answer:
Level 1 (1-2 marks): Simple description of the 3Rs with limited evaluation. Level 2 (3-4 marks): Discussion of strengths and weaknesses with some examples. Level 3 (5-6 marks): Critical evaluation with balanced argument, specific examples, and clear conclusion.
Expected Content:
Strengths of the 3Rs approach:
- Reduce: Prevents waste generation at source, which is the most effective way to minimise environmental impact. Examples include plastic bag charges (Singapore, UK) and packaging reduction initiatives.
- Reuse: Extends product life and reduces demand for new resources. Examples include refillable bottles, second-hand markets, and repair cafes.
- Recycle: Converts waste into new products, conserving resources and reducing landfill. Examples include Singapore's recycling programmes for paper, plastics, and metals.
Limitations of the 3Rs approach:
- Effectiveness depends on implementation: Recycling rates vary widely. Singapore's recycling rate is around 60%, but domestic recycling is much lower (around 20%) due to contamination and lack of participation.
- Downcycling: Many materials (e.g., plastics) are downcycled into lower-quality products, delaying rather than preventing disposal.
- Economic viability: Recycling can be expensive, especially when commodity prices are low. Collection, sorting, and processing costs may exceed the value of recovered materials.
- Consumer behaviour: The 3Rs require significant behavioural change, which is difficult to achieve. Convenience and cost often outweigh environmental concerns.
- Not a complete solution: The 3Rs do not address waste that cannot be reduced, reused, or recycled (e.g., hazardous waste, certain plastics).
Evaluation:
- The 3Rs are effective when implemented as part of a comprehensive waste management strategy that includes producer responsibility, economic incentives, and public education.
- The waste hierarchy (reduce > reuse > recycle > recover > dispose) provides a useful framework, but the focus should be on higher-order strategies (reduce and reuse) rather than relying primarily on recycling.
- Success depends on context: Japan's high recycling rates (over 80% in some cities) show what is possible with strong policies and public participation.
Marking Scheme:
- 2 marks for discussing strengths with examples
- 2 marks for discussing limitations with examples
- 2 marks for evaluation and conclusion
- Accept: references to specific city or country examples
Common Mistake: Students may describe the 3Rs without critically evaluating their effectiveness.
18. Discuss the role of government policies in promoting sustainable resource use. Use examples to support your answer. [6]
Answer:
Level 1 (1-2 marks): Simple listing of policies with limited discussion. Level 2 (3-4 marks): Discussion of policies with some examples and evaluation. Level 3 (5-6 marks): Comprehensive discussion with critical evaluation and specific examples.
Expected Content:
Types of government policies:
-
Regulatory policies:
- Bans on single-use plastics (e.g., Kenya's plastic bag ban, EU's ban on single-use plastics).
- Mandatory recycling requirements (e.g., Singapore's Mandatory Packaging Reporting).
- Building codes requiring energy-efficient design.
-
Economic instruments:
- Carbon taxes (e.g., Sweden's carbon tax, which reduced emissions by 35% since 1990).
- Subsidies for renewable energy (e.g., Germany's feed-in tariffs for solar power).
- Landfill taxes to discourage waste disposal (e.g., UK's landfill tax).
-
Information and education:
- Public awareness campaigns (e.g., Singapore's 'Say Yes to Waste Less' campaign).
- Eco-labelling schemes (e.g., Energy Star, Green Label).
- School curriculum integration of sustainability topics.
-
Infrastructure provision:
- Investment in recycling facilities and waste-to-energy plants.
- Development of public transport to reduce resource use.
- Provision of water-efficient infrastructure.
Evaluation:
- Government policies are essential because market forces alone do not account for environmental costs (externalities).
- Effectiveness depends on enforcement, public support, and integration with other policies.
- Policies must be tailored to local context: what works in Singapore (high-income, small city-state) may not work in India (large, diverse, lower-income).
- The most effective approaches combine multiple policy types (e.g., regulation + economic incentives + education).
Marking Scheme:
- 2 marks for describing at least two types of policies with examples
- 2 marks for explaining how policies promote sustainable resource use
- 2 marks for evaluation of policy effectiveness with specific examples
- Accept: references to specific countries, policies, or outcomes
Common Mistake: Students may list policies without explaining how they work or evaluating their effectiveness.
19. 'Technological solutions alone cannot solve the problem of resource depletion.' Critically evaluate this statement. [6]
Answer:
Level 1 (1-2 marks): Simple agreement or disagreement with limited reasoning. Level 2 (3-4 marks): Discussion of technology's role with some examples and limitations. Level 3 (5-6 marks): Critical evaluation with balanced argument, specific examples, and clear conclusion.
Expected Content:
Arguments for technology being able to solve resource depletion:
- Efficiency improvements: Technological advances have dramatically reduced resource use per unit of output (e.g., LED lighting uses 75% less energy than incandescent bulbs).
- Substitution: New materials can replace scarce resources (e.g., carbon fibre replacing metals, plant-based plastics replacing petroleum-based plastics).
- Renewable energy: Solar, wind, and other renewable technologies can replace fossil fuels, addressing both resource depletion and climate change.
- Recycling technology: Advanced sorting and processing technologies can recover materials that were previously non-recyclable.
Arguments against technology alone being sufficient:
- Rebound effect (Jevons Paradox): Increased efficiency can lead to increased consumption, offsetting resource savings. For example, more fuel-efficient cars may lead to more driving.
- Technological solutions often create new problems: Mining for rare earth metals for renewable energy technologies has environmental and social impacts.
- Cost and accessibility: Advanced technologies may be too expensive for developing countries, creating a technology gap.
- Behavioural and social factors: Resource depletion is driven by consumption patterns, population growth, and economic systems that technology alone cannot change.
- Limits to substitution: Some resources (e.g., water, fertile soil) have no technological substitutes.
Evaluation:
- Technology is necessary but not sufficient. It must be combined with behavioural change, policy interventions, and economic restructuring.
- The most effective approach is a combination of technological innovation, demand-side management, and systemic change.
- Technology can buy time and reduce impacts, but fundamental changes in consumption patterns and economic systems are also needed.
Marking Scheme:
- 2 marks for presenting arguments supporting technology's role
- 2 marks for presenting limitations of technological solutions
- 2 marks for evaluation and conclusion with specific examples
- Accept: references to specific technologies, case studies, or concepts (e.g., Jevons Paradox)
Common Mistake: Students may take an extreme position (technology will solve everything or technology is useless) without balanced evaluation.
20. Compare and contrast the challenges of achieving sustainable resource management in more developed countries (MDCs) and less developed countries (LDCs). [6]
Answer:
Level 1 (1-2 marks): Simple listing of challenges for MDCs or LDCs. Level 2 (3-4 marks): Comparison of challenges with some examples. Level 3 (5-6 marks): Detailed comparison and contrast with specific examples and evaluation.
Expected Content:
Challenges in MDCs:
- High consumption levels: MDCs have high per capita resource consumption (e.g., the average American consumes 10 times more resources than the average Indian).
- Waste generation: High levels of waste, including complex waste streams (e.g., e-waste, hazardous waste) that are difficult to manage.
- Infrastructure lock-in: Existing infrastructure (e.g., car-dependent transport, coal-fired power plants) is difficult and expensive to change.
- Political challenges: Vested interests (e.g., fossil fuel companies) may resist change, and short-term political cycles may discourage long-term planning.
Challenges in LDCs:
- Poverty and development priorities: Immediate needs for economic growth and poverty reduction may take priority over environmental concerns.
- Limited financial and technical resources: Lack of investment capacity for sustainable infrastructure (e.g., renewable energy, waste treatment).
- Rapid urbanisation: Fast-growing cities struggle to provide basic services, let alone sustainable resource management.
- Weak governance: Corruption, lack of enforcement, and weak institutions undermine policy implementation.
- Vulnerability to climate change: LDCs are often more vulnerable to the impacts of climate change, which can undermine resource availability.
Similarities:
- Both face challenges of population growth and urbanisation.
- Both need to transition to more sustainable consumption and production patterns.
- Both require international cooperation and technology transfer.
Contrasts:
- MDCs have the resources to invest in sustainability but face challenges of high consumption and political inertia.
- LDCs have lower consumption but face more fundamental challenges of poverty, governance, and capacity.
- MDCs bear greater historical responsibility for resource depletion and environmental degradation.
Evaluation:
- The challenges are different in nature and scale, requiring different approaches.
- MDCs should take the lead in reducing consumption and providing financial and technical support to LDCs.
- LDCs have an opportunity to leapfrog to sustainable technologies (e.g., distributed solar power) without repeating the mistakes of MDCs.
Marking Scheme:
- 2 marks for discussing challenges in MDCs with examples
- 2 marks for discussing challenges in LDCs with examples
- 2 marks for comparison/contrast and evaluation
- Accept: references to specific countries, data, or case studies
Common Mistake: Students may describe challenges for one group without comparing or contrasting with the other.
End of Answer Key