AI Generated Quiz
A Level H1 Geography Physical Geography Quiz
Free A Level H1 Geography Physical Geography quiz, AI version, with questions, answers, and A Level-style practice for Singapore students.
These static practice materials are generated from the site's syllabus and paper-generation workflow, with source and model context shown so students and parents can evaluate the material before use.
Questions
Free quiz and exam paper access
Enter your details to view this paper
Your access is remembered on this device.
Answers
A-Level Geography H1 Quiz - Physical Geography: Answer Key
Total Marks: 50
Section A: Climate Change Science (Questions 1–5)
Question 1 [2 marks]
Answer: Two proxy indicators used to reconstruct past climate variability are:
- Ice cores (from ice sheets in Antarctica and Greenland)
- Ocean cores (sediment cores from the ocean floor)
Explanation: Proxy indicators are preserved physical characteristics of the past that stand in for direct measurements. Ice cores contain trapped air bubbles that preserve samples of ancient atmosphere, allowing scientists to measure past CO2 and methane concentrations. The ratio of oxygen isotopes (δ18O) in the ice also indicates past temperatures. Ocean cores contain the shells of microscopic marine organisms (foraminifera) whose oxygen isotope ratios reflect ocean temperatures when they were formed. Other acceptable answers include tree rings, coral reefs, and pollen records.
Marking notes:
- 1 mark for each correct proxy indicator (max 2)
- Must be specific (e.g., "ice cores" not just "ice"; "ocean cores" not just "sediment")
Question 2 [3 marks]
Answer: Changes in solar output influence Earth's temperature variability through several mechanisms:
-
Direct radiative forcing: When solar output increases, more energy reaches Earth's surface, causing warming. Conversely, decreased solar output reduces incoming energy, causing cooling. Variations in solar irradiance are linked to sunspot cycles (11-year cycles) and longer-term changes in solar activity.
-
Amplification through feedbacks: Small changes in solar output can be amplified through feedback mechanisms. For example, increased solar radiation can cause more evaporation, increasing water vapour (a greenhouse gas) in the atmosphere, which further warms the planet.
-
Regional effects: Changes in solar output can alter atmospheric circulation patterns, such as the position of jet streams and storm tracks, leading to regional temperature changes beyond what would be expected from radiative forcing alone.
Explanation: Solar output varies naturally over different timescales. The Maunder Minimum (1645-1715), a period of very low sunspot activity, coincided with the Little Ice Age, suggesting a link between solar output and climate. However, since 1950, solar output has been relatively stable while global temperatures have risen sharply, indicating that solar variability alone cannot explain contemporary warming.
Marking notes:
- 1 mark for explaining direct radiative effect
- 1 mark for explaining amplification through feedbacks
- 1 mark for any additional valid point (regional effects, historical examples, limitations)
Question 3 [3 marks]
Answer: Thermohaline circulation (THC) regulates global climate by redistributing heat around the planet:
-
Heat transport: The THC moves warm surface waters from the equator towards the poles (e.g., the Gulf Stream carries warm water to the North Atlantic), releasing heat to the atmosphere and warming high-latitude regions. Cold, dense water sinks in the North Atlantic and flows southward at depth, completing the circulation loop.
-
Climate regulation: This circulation moderates temperatures, making northwest Europe 5-10°C warmer than it would otherwise be at that latitude. It also influences precipitation patterns and marine ecosystems.
-
Carbon storage: The THC transports carbon-rich surface waters to the deep ocean, where carbon can be stored for centuries to millennia, acting as a carbon sink that helps regulate atmospheric CO2 levels.
Explanation: The THC is driven by differences in water density (temperature and salinity). Warm, salty water from the tropics flows northward, cools, becomes denser, and sinks in the North Atlantic. This "conveyor belt" circulation connects all major ocean basins and plays a crucial role in global climate regulation.
Marking notes:
- 1 mark for explaining heat transport mechanism
- 1 mark for explaining climate regulation effects
- 1 mark for explaining carbon storage or another valid point
Question 4 [4 marks]
Answer: The resource provides strong evidence that human activities have significantly influenced the global carbon cycle:
-
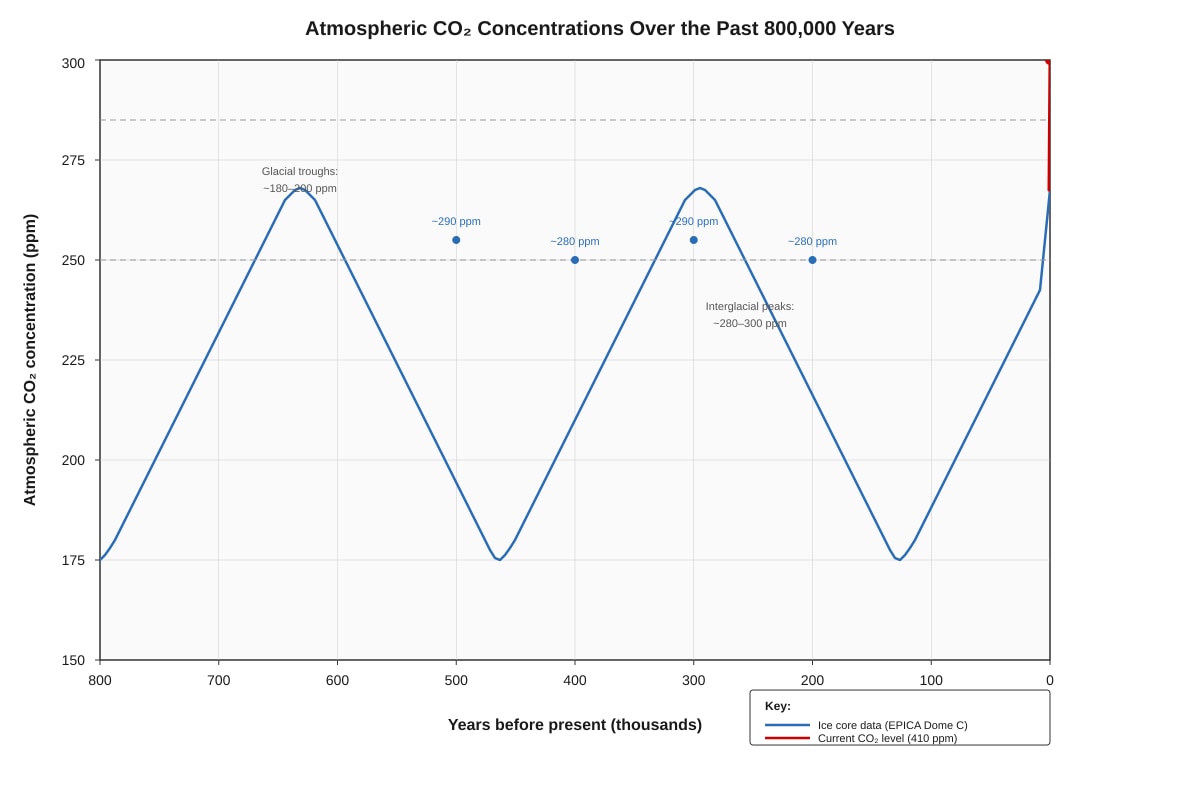
Natural range exceeded: For the past 800,000 years, atmospheric CO2 concentrations cycled between approximately 180 ppm (glacial periods) and 300 ppm (interglacial periods). The current level of 410 ppm far exceeds this natural range, indicating an unprecedented perturbation to the carbon cycle.
-
Rate of change: The increase from ~280 ppm (pre-industrial) to 410 ppm has occurred in just ~150 years, whereas natural changes occurred over thousands of years. This rapid rate is inconsistent with natural processes and aligns with the timing of industrialisation.
-
Human activities: The increase coincides with human activities that alter the carbon cycle: burning fossil fuels (adding carbon to the atmosphere that was stored underground), deforestation (reducing carbon sinks), and land-use change (releasing soil carbon).
-
IPCC consensus: The Intergovernmental Panel on Climate Change has concluded that it is unequivocal that human activities have caused the observed increase in atmospheric CO2, with fossil fuel combustion being the dominant factor.
Explanation: The global carbon cycle involves the exchange of carbon between the atmosphere, oceans, land, and living organisms. Human activities have disrupted this cycle by adding carbon to the atmosphere faster than natural sinks can absorb it. The ice core data provides a crucial baseline showing that current CO2 levels and the rate of increase are unprecedented in at least 800,000 years.
Marking notes:
- 1 mark for identifying that current CO2 exceeds natural range
- 1 mark for noting the rapid rate of increase
- 1 mark for linking to specific human activities
- 1 mark for referencing IPCC consensus or additional supporting point
Question 5 [4 marks]
Answer:
Positive feedback amplifies an initial change, leading to further change in the same direction. It accelerates the warming process.
Example: Ice-albedo feedback. As temperatures rise, ice and snow melt, exposing darker land or ocean surfaces. These darker surfaces absorb more solar radiation (lower albedo), causing further warming, which melts more ice, and so on.
Negative feedback counteracts an initial change, leading to a stabilising effect. It dampens the warming process.
Example: Increased plant growth. Higher CO2 levels can stimulate plant photosynthesis (CO2 fertilisation effect), causing plants to absorb more CO2 from the atmosphere, which reduces the rate of warming.
Explanation: Feedback mechanisms are crucial for understanding climate sensitivity—how much warming will occur for a given increase in greenhouse gases. Positive feedbacks can lead to tipping points where climate change becomes self-reinforcing, while negative feedbacks provide natural limits to warming. The concern is that positive feedbacks may dominate, leading to accelerated and potentially irreversible climate change.
Marking notes:
- 1 mark for correct definition of positive feedback
- 1 mark for correct example of positive feedback
- 1 mark for correct definition of negative feedback
- 1 mark for correct example of negative feedback
- Examples must be clearly explained to show the feedback loop
Section B: Impacts of Climate Change (Questions 6–10)
Question 6 [2 marks]
Answer: Two possible impacts of climate change on aquatic ecosystems:
- Ocean acidification: Increased atmospheric CO2 is absorbed by oceans, forming carbonic acid and lowering pH. This harms calcifying organisms like corals, shellfish, and plankton, disrupting the marine food web.
- Coral bleaching: Rising sea temperatures cause corals to expel their symbiotic algae (zooxanthellae), leading to bleaching and potentially death. This damages coral reef ecosystems that support high biodiversity.
Explanation: Aquatic ecosystems are particularly vulnerable to climate change because water temperature changes more slowly than air temperature, and because CO2 absorption directly alters water chemistry. Other acceptable answers include: changes in species distribution (species moving to cooler waters), reduced oxygen levels in warmer water, sea-level rise affecting coastal wetlands, and changes in freshwater ecosystems due to altered precipitation patterns.
Marking notes:
- 1 mark for each correct impact with brief explanation (max 2)
Question 7 [3 marks]
Answer: The impacts of climate change are expected to be uneven across regions due to:
-
Geographic vulnerability: Low-lying coastal areas and small island states are more vulnerable to sea-level rise and storm surges. Arid and semi-arid regions are more vulnerable to increased drought and desertification. Tropical regions are closer to temperature thresholds that species and ecosystems can tolerate.
-
Adaptive capacity: Developed countries have greater financial resources, technology, and infrastructure to adapt to climate change (e.g., flood defences, drought-resistant crops, air conditioning). Developing countries often lack these resources, making them more vulnerable to impacts.
-
Exposure and dependence: Regions whose economies depend on climate-sensitive sectors (e.g., agriculture, tourism, fisheries) are more exposed to impacts. For example, many African countries rely on rain-fed agriculture, making them highly vulnerable to changes in precipitation patterns.
Explanation: Climate change does not affect all regions equally. The IPCC has documented that the most severe impacts are often felt in regions that have contributed least to greenhouse gas emissions, raising issues of climate justice. The uneven distribution of impacts is a key concern for sustainable development.
Marking notes:
- 1 mark for each valid factor explaining uneven impacts (max 3)
- Must explain why impacts are uneven, not just state that they are
Question 8 [5 marks]
Answer: The projected changes in agricultural productivity have significant consequences for human populations:
Negative consequences (regions with declining productivity):
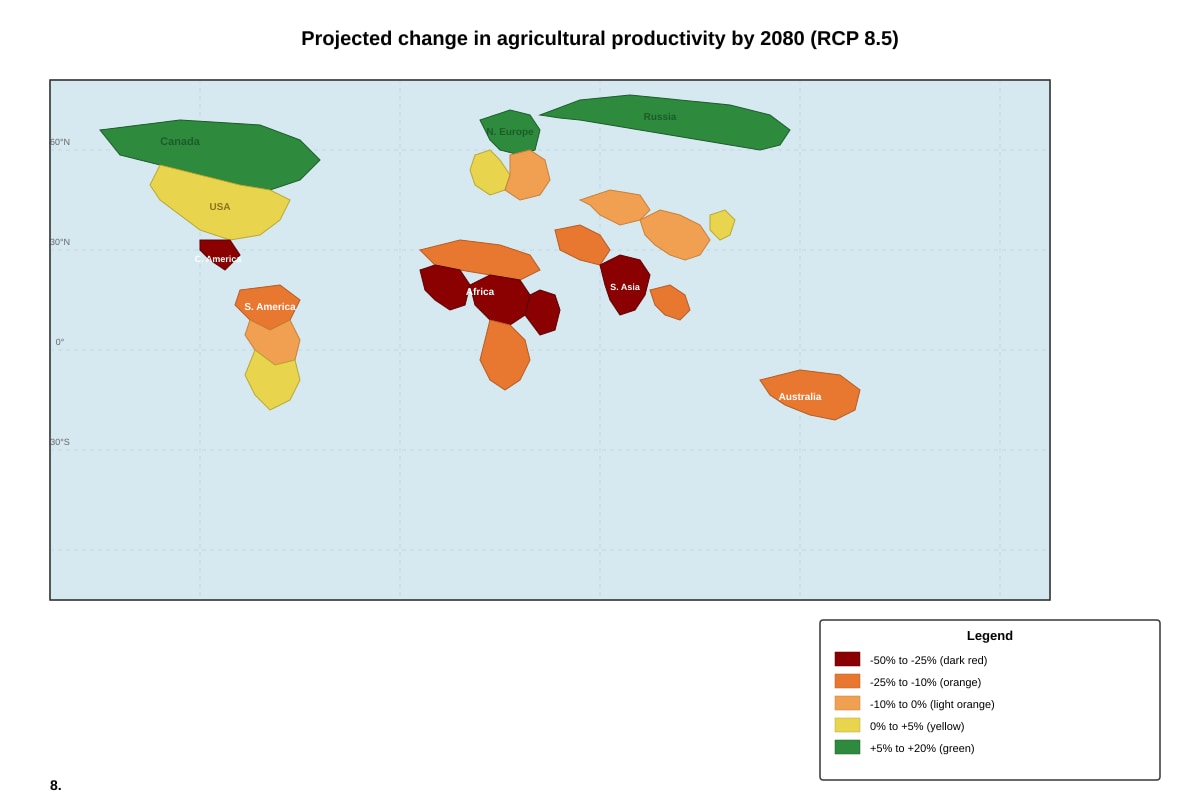
- Food security: Regions projected to experience the largest declines (Africa: -25% to -50%; South Asia: -10% to -25%) already face food insecurity. Reduced agricultural output would worsen malnutrition, hunger, and poverty.
- Economic impacts: Agriculture employs a large proportion of the population in these regions. Declining productivity would reduce incomes, increase food prices, and strain national economies.
- Migration and conflict: Food shortages could trigger migration from affected areas and increase competition for resources, potentially leading to conflict.
Positive consequences (regions with potential gains):
- Northern latitudes: Regions like Canada, Russia, and Scandinavia may see increased agricultural productivity (+5% to +20%), potentially creating new agricultural opportunities.
- However: These gains may be limited by poor soil quality, shorter growing seasons, and the need for new infrastructure.
Overall evaluation: The net effect is highly uneven, with tropical developing regions bearing the greatest burden while some high-latitude developed regions may benefit. This raises significant equity concerns and could exacerbate existing global inequalities.
Explanation: Agricultural productivity is determined by temperature, precipitation, CO2 levels, and soil quality. While higher CO2 can stimulate plant growth (CO2 fertilisation), this benefit is often outweighed by heat stress, water scarcity, and increased pest/disease pressure in tropical regions. The map shows a clear latitudinal pattern, with tropical regions most negatively affected.
Marking notes:
- 1 mark for identifying regions with declining productivity
- 1 mark for explaining food security impacts
- 1 mark for explaining economic/social impacts
- 1 mark for noting potential gains in high latitudes
- 1 mark for overall evaluation/judgment
Question 9 [2 marks]
Answer: Two ways changes in temperature and precipitation could affect human health:
-
Heat-related illness: More frequent and intense heatwaves increase the risk of heat exhaustion, heatstroke, and cardiovascular stress, particularly among the elderly and those with pre-existing conditions.
-
Vector-borne diseases: Changes in temperature and precipitation alter the geographic range and seasonality of disease-carrying vectors (e.g., mosquitoes). Warmer temperatures allow malaria and dengue fever to spread to higher altitudes and latitudes where they were previously absent.
Explanation: Climate change affects health through direct pathways (heat, extreme weather) and indirect pathways (changes in disease patterns, air quality, food and water security). The World Health Organization estimates that climate change will cause approximately 250,000 additional deaths per year between 2030 and 2050.
Marking notes:
- 1 mark for each correct impact with explanation (max 2)
- Accept other valid impacts: respiratory issues from poor air quality, water-borne diseases from flooding, malnutrition from reduced food production
Question 10 [6 marks]
Answer:
Arguments that sea-level rise poses the greatest threat:
-
Scale of population affected: Over 600 million people live in low-lying coastal areas (within 10m of sea level). Major cities like Shanghai, Mumbai, New York, and Bangkok are vulnerable. Even modest sea-level rise (1m by 2100) could displace hundreds of millions.
-
Irreversible impacts: Sea-level rise leads to permanent inundation of coastal land, loss of territory for small island states (e.g., Maldives, Tuvalu), and saltwater intrusion into freshwater aquifers. Unlike some other impacts, there is no way to "recover" lost land.
-
Economic costs: Coastal infrastructure (ports, airports, roads, buildings) is extremely expensive to protect or relocate. The cost of coastal adaptation is estimated at tens of billions of dollars annually, with developing countries least able to afford it.
Counter-arguments (other threats may be greater):
-
Food security impacts: As shown in Question 8, agricultural productivity declines could affect billions of people through food shortages and price increases. This could have more widespread impacts than sea-level rise, which is concentrated in coastal areas.
-
Water scarcity: Climate change is projected to exacerbate water scarcity in many regions, affecting 2-3 billion people. This could have more immediate and severe impacts on health, agriculture, and economic development.
-
Extreme weather events: Increases in the intensity of tropical cyclones, floods, and droughts can cause catastrophic damage and loss of life in the short term, whereas sea-level rise is a slower-onset impact.
Overall assessment: While sea-level rise is a severe and irreversible threat, particularly for coastal populations and small island states, it may not be the greatest threat overall. Food security and water scarcity impacts could affect larger populations and have more immediate consequences. The greatest threat likely varies by region and timescale. A comprehensive response must address all climate impacts simultaneously.
Explanation: This question requires evaluation—weighing different arguments and reaching a reasoned conclusion. The best answers acknowledge the severity of sea-level rise while considering other significant threats, and reach a nuanced conclusion rather than a simple "yes" or "no."
Marking notes (Level-based):
- Level 3 (5-6 marks): Well-developed evaluation with balanced arguments, specific evidence, and clear conclusion
- Level 2 (3-4 marks): Some evaluation with relevant points but may be one-sided or lack specific evidence
- Level 1 (1-2 marks): Descriptive answer listing impacts without evaluation
- 0 marks: No relevant content
Section C: Responses to Climate Change (Questions 11–15)
Question 11 [1 mark]
Answer: Mitigation refers to actions taken to reduce greenhouse gas emissions or enhance carbon sinks to limit the extent of climate change.
Explanation: Mitigation addresses the causes of climate change by reducing emissions (e.g., switching to renewable energy, improving energy efficiency) or removing CO2 from the atmosphere (e.g., afforestation, carbon capture). This is distinct from adaptation, which addresses the impacts of climate change.
Marking notes:
- 1 mark for correct definition mentioning reducing emissions or enhancing sinks
Question 12 [3 marks]
Answer: Afforestation (planting trees on land that was not previously forested) acts as a carbon sink and contributes to climate change mitigation through:
-
Carbon sequestration: Trees absorb CO2 from the atmosphere through photosynthesis and store carbon in their biomass (trunks, branches, leaves, roots) and in soil organic matter. A mature tree can absorb approximately 22 kg of CO2 per year.
-
Long-term storage: Carbon can be stored in forests for decades to centuries, keeping it out of the atmosphere. Well-managed forests can continue to accumulate carbon for many decades before reaching maturity.
-
Additional benefits: Forests also provide co-benefits such as habitat conservation, soil protection, water regulation, and local climate regulation, making afforestation a cost-effective mitigation strategy.
Explanation: Forests are among the most effective natural carbon sinks. However, the mitigation potential of afforestation depends on factors such as tree species, climate, soil type, and long-term management. There is also a time lag—newly planted trees take years to become significant carbon sinks. Additionally, afforestation must be carefully planned to avoid negative impacts on biodiversity or competition with food production.
Marking notes:
- 1 mark for explaining carbon sequestration process
- 1 mark for explaining long-term storage
- 1 mark for additional point (co-benefits, scale, or limitations)
Question 13 [3 marks]
Answer: The resource shows that transitioning to renewable energy is a key mitigation strategy because:
-
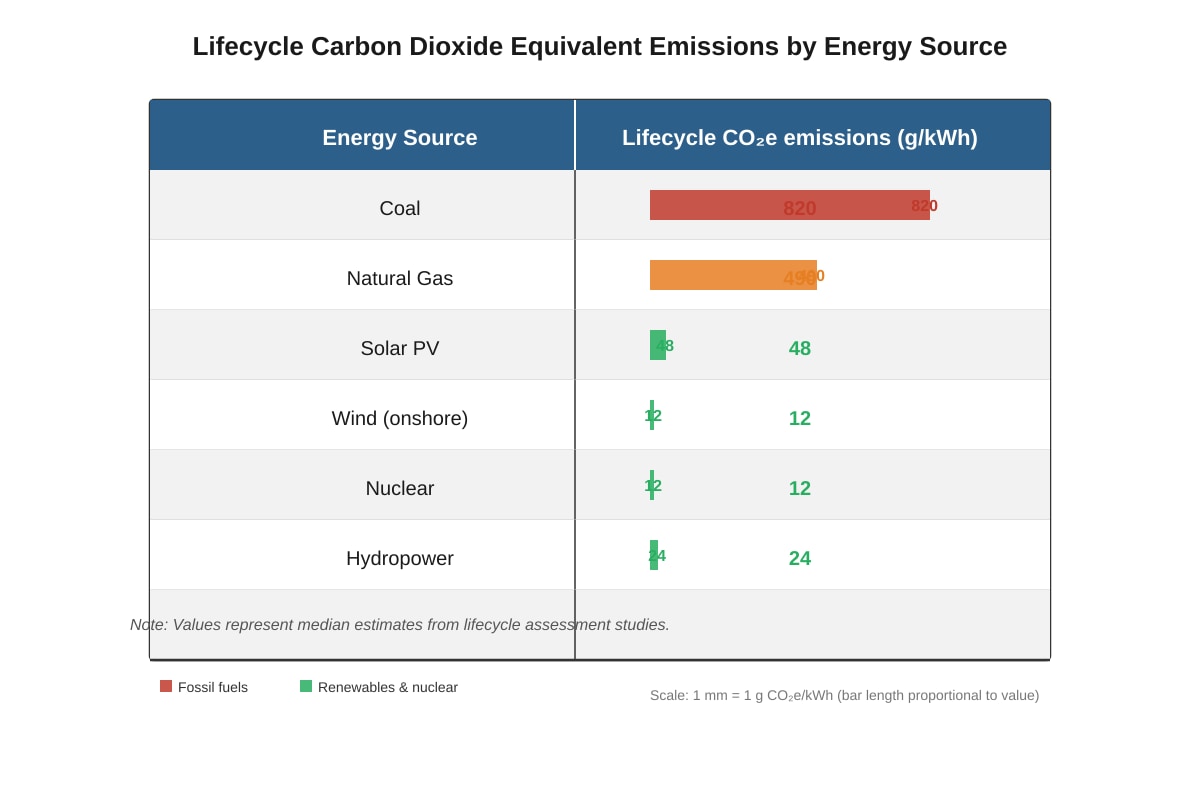
Dramatic emissions reduction: Fossil fuels (coal: 820 g CO2e/kWh, natural gas: 490 g CO2e/kWh) have emissions 10-70 times higher than renewable sources (solar: 48, wind: 12, hydropower: 24). Replacing coal with wind power reduces emissions by approximately 98%.
-
Lifecycle emissions are low: Even when accounting for manufacturing, installation, and decommissioning, renewable energy sources have minimal lifecycle emissions. This means the climate benefit is real and substantial, not offset by other stages of the energy lifecycle.
-
Scalability: Renewable energy technologies can be deployed at scale to replace fossil fuel power generation. The rapid cost reductions in solar and wind (solar costs fell 90% from 2010-2020) make them economically viable alternatives.
Explanation: The energy sector is the largest source of greenhouse gas emissions globally, accounting for approximately 73% of total emissions. Transitioning to low-carbon energy sources is therefore the most direct and effective mitigation strategy. The data shows that even natural gas, often promoted as a "bridge fuel," has emissions 10 times higher than wind power.
Marking notes:
- 1 mark for comparing emission values from the resource
- 1 mark for explaining significance of lifecycle emissions
- 1 mark for discussing scalability or economic viability
Question 14 [4 marks]
Answer: Challenges associated with implementing international climate agreements include:
-
Free-rider problem: Climate change is a global commons problem. Countries can benefit from others' mitigation efforts without contributing themselves, creating a disincentive for individual action. The Paris Agreement relies on voluntary nationally determined contributions (NDCs), which may not be ambitious enough.
-
Economic competitiveness concerns: Countries may be reluctant to implement strong climate policies if they fear economic disadvantage relative to countries with weaker policies. This "carbon leakage" concern has historically hindered agreement on binding emissions targets.
-
Differentiated responsibility: There is disagreement about how to allocate responsibility for emissions reductions. Developed countries have historically contributed most to cumulative emissions, but developing countries argue they need room to grow economically. The principle of "common but differentiated responsibilities" is difficult to operationalise.
-
Enforcement and compliance: International agreements lack strong enforcement mechanisms. The Kyoto Protocol had binding targets but the US did not ratify it and Canada withdrew. The Paris Agreement relies on transparency and peer pressure rather than penalties for non-compliance.
Explanation: International climate agreements face fundamental challenges because climate change is a collective action problem requiring cooperation among nearly 200 countries with different interests, capabilities, and historical responsibilities. The tension between national sovereignty and global cooperation is a persistent challenge.
Marking notes:
- 1 mark for each valid challenge with explanation (max 4)
- Must explain why it is a challenge, not just name it
Question 15 [5 marks]
Answer:
Effectiveness of adaptation strategies for coastal communities:
Effective strategies:
-
Hard engineering (sea walls, barriers): These provide immediate protection against sea-level rise and storm surges. Examples include the Thames Barrier (London) and the Delta Works (Netherlands). However, they are extremely expensive, can have negative environmental impacts, and may not be sustainable long-term as sea levels continue to rise.
-
Ecosystem-based adaptation (mangrove restoration, coral reef protection): Mangroves and coral reefs provide natural coastal protection, absorbing wave energy and reducing erosion. They are cost-effective, provide biodiversity benefits, and can adapt to changing conditions. However, they may be overwhelmed by extreme events and take time to establish.
-
Managed retreat and land-use planning: Relocating development away from vulnerable coastlines is the most sustainable long-term solution. It avoids the costs of ongoing protection and reduces future risk. However, it is politically difficult, socially disruptive, and expensive in the short term.
Limitations:
-
Cost and affordability: Many adaptation strategies are expensive, and developing countries may lack the financial resources to implement them effectively. The cost of coastal adaptation is estimated at $25-90 billion per year by 2050.
-
Uncertainty: Future sea-level rise projections have significant uncertainty, making it difficult to plan appropriate adaptation measures. Over-investment in protection may be wasteful, while under-investment leaves communities vulnerable.
-
Limits to adaptation: There are physical limits to adaptation. For small island states, sea-level rise may eventually make some islands uninhabitable regardless of adaptation efforts.
Overall evaluation: Adaptation strategies can be effective in reducing vulnerability, particularly when combining hard engineering, ecosystem-based approaches, and land-use planning. However, adaptation alone cannot address the root cause of climate change, and there are limits to what adaptation can achieve. The most effective approach combines mitigation (to limit the extent of climate change) with adaptation (to manage unavoidable impacts).
Explanation: This question requires evaluation of effectiveness, considering both strengths and limitations. The best answers discuss multiple strategies, provide specific examples, and reach a balanced conclusion.
Marking notes (Level-based):
- Level 3 (4-5 marks): Well-developed evaluation with multiple strategies, specific examples, and clear judgment
- Level 2 (2-3 marks): Some evaluation with relevant points but may lack specific examples or balanced assessment
- Level 1 (1 mark): Descriptive answer listing strategies without evaluation
- 0 marks: No relevant content
Section D: Physical Geography Processes and Interactions (Questions 16–20)
Question 16 [4 marks]
Answer: Climate change can affect the hydrological cycle and increase river flood risk through:
-
Increased precipitation intensity: A warmer atmosphere can hold more moisture (approximately 7% more per 1°C warming, following the Clausius-Clapeyron relationship). This leads to more intense rainfall events, with more precipitation falling in shorter periods, overwhelming drainage systems and causing flash flooding.
-
Changes in precipitation patterns: Climate change alters the timing and distribution of precipitation. Some regions experience more concentrated wet seasons, with longer dry periods followed by intense rainfall. This increases the risk of flooding when heavy rain falls on dry, hardened soil with reduced infiltration capacity.
-
Reduced snow storage and accelerated snowmelt: In regions with seasonal snow cover, warmer temperatures cause more precipitation to fall as rain rather than snow, and cause earlier and more rapid snowmelt. This reduces the natural water storage capacity of snowpack and increases winter/spring flood risk.
-
Changes in evapotranspiration: Higher temperatures increase evaporation and plant transpiration rates. While this can dry soils and reduce baseflow in rivers, it also means that when heavy rain occurs, the intense rainfall exceeds the soil's infiltration capacity, generating more surface runoff and increasing flood peaks.
Explanation: The hydrological cycle describes the movement of water between the atmosphere, land, and oceans. Climate change intensifies this cycle—more energy in the system means more evaporation and more precipitation, but the distribution becomes more uneven. This leads to both more frequent and more severe floods in many regions.
Marking notes:
- 1 mark for each valid mechanism with explanation (max 4)
- Must explain the link to increased flood risk, not just describe changes
Question 17 [3 marks]
Answer:
Spatial distribution:
- Tropical cyclones form over warm ocean waters (sea surface temperature >26.5°C) between approximately 5° and 30° latitude north and south of the equator.
- They do not form within 5° of the equator due to the weak Coriolis effect.
- Major basins include: Northwest Pacific (most active), North Atlantic, Indian Ocean, and South Pacific.
Temporal distribution:
- Tropical cyclones have distinct seasonal patterns that vary by basin. In the North Atlantic, the season runs from June to November, with peak activity in September. In the Northwest Pacific, typhoons can occur year-round but peak from July to October.
- Activity varies interannually due to phenomena like El Niño-Southern Oscillation (ENSO), which affects sea surface temperatures and wind shear in different basins.
Explanation: Tropical cyclones are heat engines that require warm ocean water, high humidity, and low wind shear to form and intensify. Their spatial distribution is therefore constrained to tropical and subtropical regions with sufficiently warm water. Their temporal distribution follows the seasonal warming of ocean waters.
Marking notes:
- 1 mark for describing latitudinal range and conditions
- 1 mark for describing ocean basins
- 1 mark for describing seasonal patterns or interannual variability
Question 18 [3 marks]
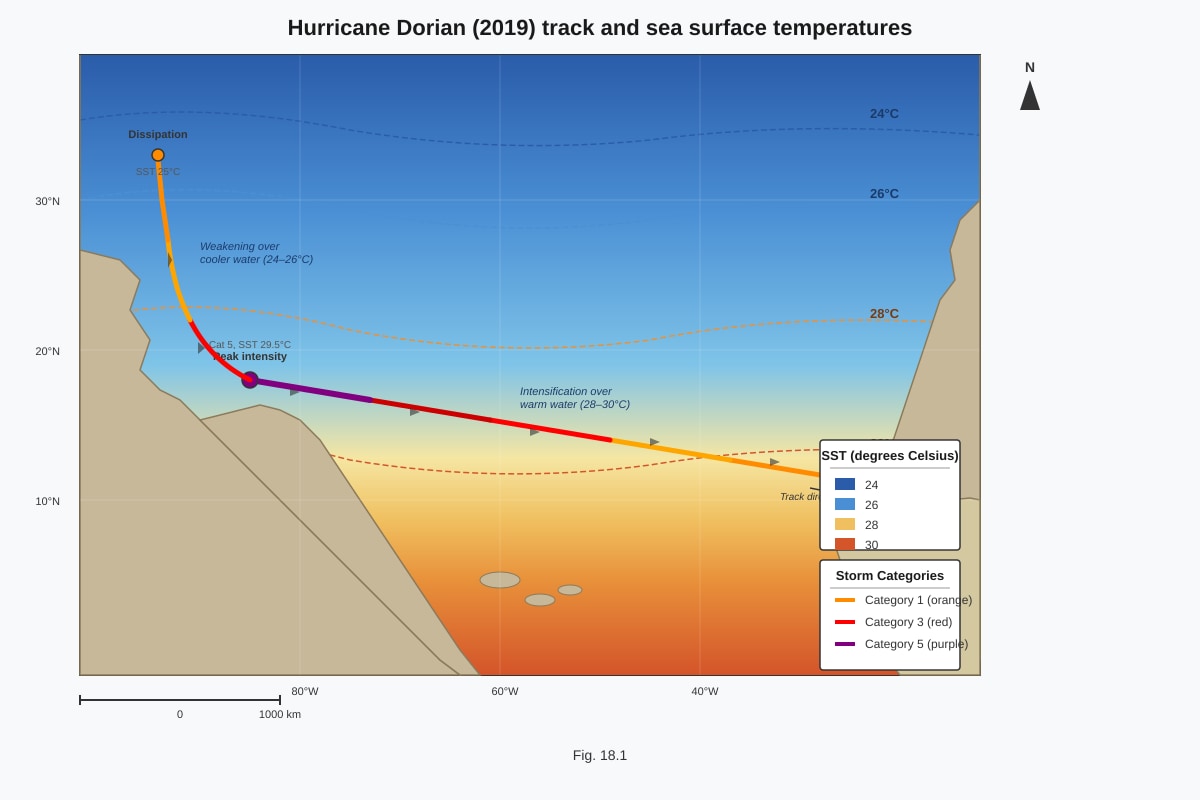
Answer: The resource shows a clear relationship between sea surface temperature (SST) and tropical cyclone intensity:
-
Formation threshold: The tropical cyclone formed over waters with SST of 28°C, which is above the minimum threshold of 26.5°C required for tropical cyclone formation. The warm water provides the heat energy that drives the storm.
-
Intensification with warmer SST: As the storm moved over warmer waters (29.5°C), it intensified to Category 5 (the highest category). Higher SST provides more energy for evaporation, which fuels stronger convection and more intense winds.
-
Weakening over cooler waters: When the storm moved over cooler waters (25°C), it weakened and dissipated. The reduced energy supply from the cooler water decreased evaporation and convection, reducing the storm's intensity.
Explanation: Tropical cyclones are powered by the release of latent heat when water vapour condenses. Warmer SST increases evaporation, providing more water vapour to fuel the storm. This is why climate change, by warming ocean surface temperatures, is expected to increase the intensity (though not necessarily the frequency) of tropical cyclones.
Marking notes:
- 1 mark for identifying formation threshold
- 1 mark for explaining intensification with warmer SST
- 1 mark for explaining weakening over cooler SST
- Must reference specific values from the resource
Question 19 [4 marks]
Answer: Changes in ice sheets influence global climate through several feedback mechanisms:
-
Albedo feedback (positive feedback): Ice sheets have high albedo (reflectivity), reflecting up to 80% of incoming solar radiation back to space. As ice sheets melt due to warming, darker land or ocean surfaces are exposed, which absorb more solar radiation. This causes further warming, which melts more ice, creating a self-reinforcing cycle.
-
Sea-level rise feedback: Melting of ice sheets (particularly Greenland and Antarctica) contributes to sea-level rise. Higher sea levels can destabilise marine-terminating glaciers, causing them to flow faster and discharge more ice into the ocean, accelerating sea-level rise further.
-
Freshwater input and ocean circulation: Meltwater from ice sheets adds freshwater to the ocean, particularly in the North Atlantic. This can disrupt thermohaline circulation by reducing surface water density (freshwater is less dense than saltwater), potentially slowing or altering ocean currents that transport heat around the planet.
-
Carbon cycle feedback: Ice sheets store large amounts of organic carbon. As ice melts, this carbon can be released as CO2 and methane (from thawing permafrost beneath ice sheets), creating a positive feedback that accelerates warming.
Explanation: Ice sheets are not passive responders to climate change—they actively influence the climate system through feedback mechanisms. The Greenland and Antarctic ice sheets contain enough water to raise sea levels by approximately 65 metres if completely melted. Even partial melting has significant implications for global climate.
Marking notes:
- 1 mark for explaining albedo feedback
- 1 mark for explaining sea-level rise feedback
- 1 mark for explaining ocean circulation impacts
- 1 mark for explaining carbon cycle feedback or another valid mechanism
- Must explain the feedback loop, not just describe the change
Question 20 [6 marks]
Answer:
Arguments that natural factors can account for some climate variability:
-
Past climate variability: Earth's climate has always changed naturally. The Quaternary period has experienced multiple glacial-interglacial cycles driven by Milankovitch cycles (changes in Earth's orbit and axial tilt). These natural cycles caused temperature changes of 5-10°C.
-
Solar variability: Changes in solar output have influenced past climate, such as the Maunder Minimum coinciding with the Little Ice Age. Solar variations continue to have some influence on climate.
-
Volcanic activity: Large volcanic eruptions inject aerosols into the stratosphere, reflecting solar radiation and causing temporary cooling (e.g., Mount Pinatubo, 1991, caused ~0.5°C cooling).
Arguments that natural factors cannot fully account for contemporary climate change:
-
Rate of change: The current rate of warming is unprecedented in at least the last 2,000 years. Natural factors (Milankovitch cycles, solar variability) operate over thousands to tens of thousands of years, not decades.
-
Attribution studies: Climate models show that natural factors alone cannot reproduce the observed warming since 1950. Only when human factors (greenhouse gas emissions, land-use change) are included do models match observations.
-
IPCC consensus: The IPCC has concluded with 95% confidence that human activities are the dominant cause of observed warming since the mid-20th century. The warming pattern (troposphere warming, stratosphere cooling) is consistent with greenhouse gas forcing, not solar or volcanic forcing.
-
Carbon cycle evidence: The isotopic signature of atmospheric CO2 (declining δ13C) indicates the additional carbon comes from fossil fuel burning, not natural sources. The observed increase in CO2 (from 280 ppm to 410 ppm) far exceeds natural variability.
Overall assessment: While natural factors have caused significant climate variability in the past, they cannot account for the rapid warming observed since the Industrial Revolution. The evidence overwhelmingly points to human activities as the dominant cause of contemporary climate change. Natural factors continue to influence climate on longer timescales, but their influence is currently overwhelmed by anthropogenic forcing.
Explanation: This question requires evaluation of the relative importance of natural versus human factors. The best answers acknowledge that natural factors have caused past climate change but demonstrate why they cannot explain current warming, using specific evidence from attribution studies, the carbon cycle, and the rate of change.
Marking notes (Level-based):
- Level 3 (5-6 marks): Well-developed evaluation with balanced consideration of natural and human factors, specific evidence, and clear conclusion
- Level 2 (3-4 marks): Some evaluation with relevant points but may lack specific evidence or balanced treatment
- Level 1 (1-2 marks): Descriptive answer listing factors without evaluation
- 0 marks: No relevant content
END OF ANSWER KEY