AI Generated Quiz
A Level H1 Geography Fieldwork Quiz
Free A Level H1 Geography Fieldwork quiz, LongCat AI version, with questions, answers, and A Level-style practice for Singapore students.
These static practice materials are generated from the site's syllabus and paper-generation workflow, with source and model context shown so students and parents can evaluate the material before use.
Questions
A-Level Geography H1 Quiz - Fieldwork
Name: ___________________________
Class: ___________________________
Date: ___________________________
Score: ________ / 60
Duration: 60 minutes
Total Marks: 60
Instructions:
- Answer ALL questions in the spaces provided.
- Read each question carefully before writing your answer.
- Support your answers with specific examples and geographical terminology where appropriate.
- For data-based questions, refer to the resources provided.
- Quality of written communication will be assessed in extended response questions.
Section A: Research Design and Planning (Questions 1–5)
Answer ALL questions. This section carries 15 marks.
1. Define the term fieldwork in the context of geographical inquiry.
[2 marks]
2. Distinguish between primary data and secondary data, giving one example of each that a geography student might collect during a fieldwork investigation.
[3 marks]
3. A student is planning a fieldwork investigation into the impact of tourism on coastal erosion at a beach resort. State TWO factors the student should consider when selecting a suitable fieldwork site.
[2 marks]
4. Explain why a pilot study is an important stage in the fieldwork process.
[4 marks]
5. Describe TWO ethical considerations a researcher must address before conducting fieldwork involving human participants.
[4 marks]
Section B: Data Collection Methods (Questions 6–10)
Answer ALL questions. This section carries 15 marks.
6.
Generated diagram for Q6.
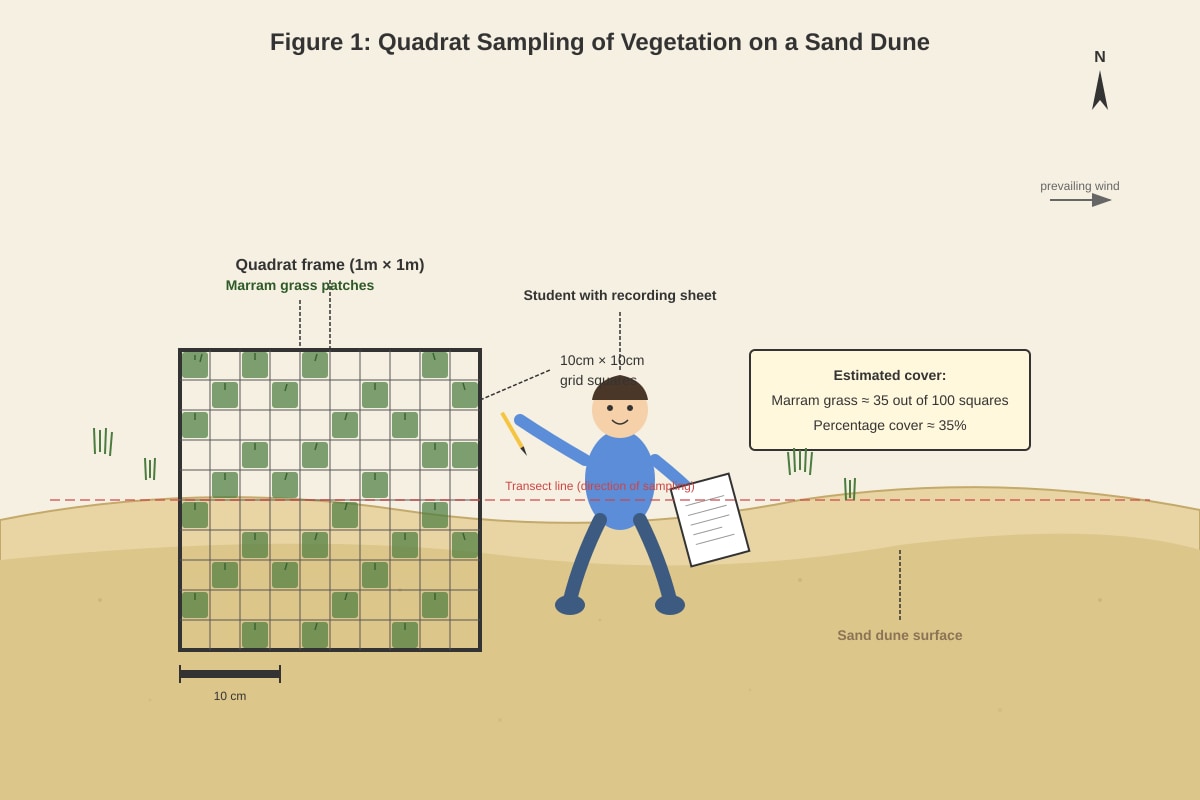
Figure 1 shows a student collecting data on vegetation cover using a quadrat.
(a) State the type of sampling method being used if the student places the quadrat at predetermined intervals along a transect line.
[1 mark]
(b) Calculate the estimated percentage cover of marram grass within the quadrat shown in Figure 1.
[2 marks]
(c) Suggest ONE advantage of using a quadrat to measure vegetation cover compared to a visual estimate alone.
[1 mark]
7. A student is investigating changes in sediment size along a river channel. Describe how the student could systematically collect sediment samples at different points across the river cross-section.
[4 marks]
8. Explain TWO advantages of using a structured questionnaire over an unstructured interview for collecting data on residents' perceptions of urban heat in a neighbourhood.
[4 marks]
9. State TWO ways in which the reliability of fieldwork data can be improved during the data collection stage.
[2 marks]
10. A student uses a digital anemometer to measure wind speed at a coastal fieldwork site. The readings (in m/s) taken at 10-minute intervals are: 4.2, 5.8, 3.6, 6.1, 4.9, 5.3, 4.7, 5.0, 4.4, 5.6.
Calculate the mean wind speed from these readings.
[1 mark]
Section C: Data Presentation and Analysis (Questions 11–15)
Answer ALL questions. This section carries 15 marks.
11.
Generated graph for Q11.
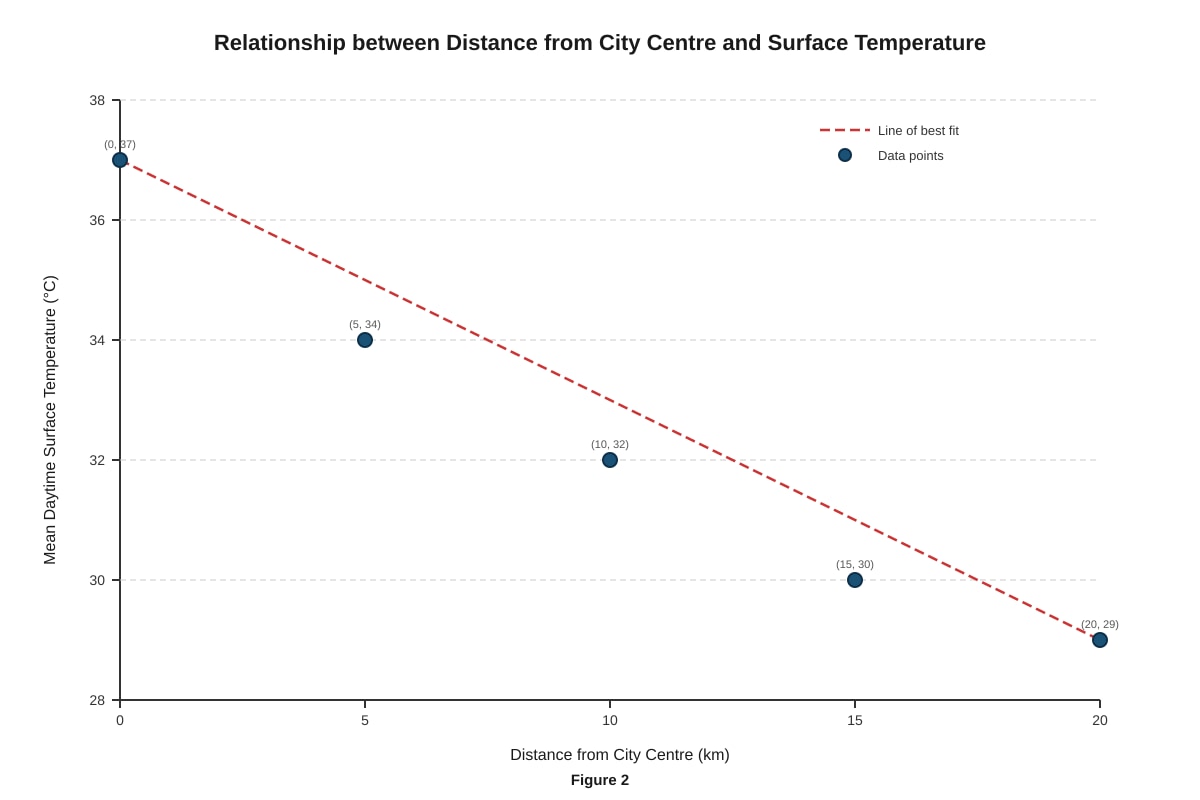
Figure 2 shows the relationship between distance from the city centre and mean daytime surface temperature for a tropical city.
(a) Describe the relationship shown in Figure 2.
[2 marks]
(b) Suggest ONE geographical reason for this relationship.
[2 marks]
12. A student presents fieldwork data on land use in a town using a pie chart. State ONE advantage and ONE disadvantage of using a pie chart to present this type of data.
[2 marks]
13.
Generated chart for Q13.
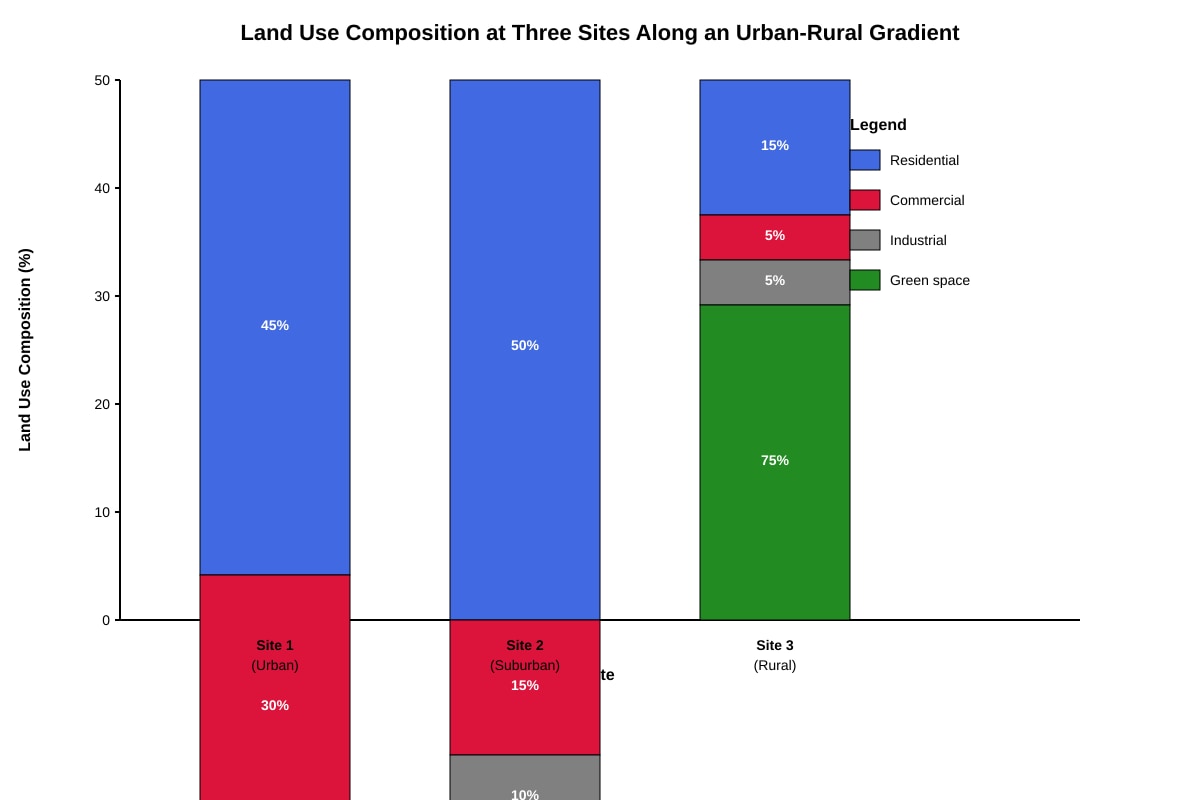
Figure 3 shows land use composition at three sites along an urban-rural gradient.
Identify the most significant change in land use between Site 1 (Urban) and Site 3 (Rural), and suggest a reason for this change.
[3 marks]
14. Explain why it is important to use appropriate statistical techniques when analysing fieldwork data.
[3 marks]
15. A student calculates Spearman's rank correlation coefficient for two variables and obtains a value of −0.82. Interpret this result.
[3 marks]
Section D: Evaluation and Conclusions (Questions 16–20)
Answer ALL questions. This section carries 15 marks.
16. Define the term validity in the context of fieldwork investigations.
[2 marks]
17. A student investigates the effect of vegetation density on soil infiltration rates. The results show that sites with higher vegetation density have higher infiltration rates. However, the student only collected data on three occasions over two weeks.
Evaluate the extent to which the student's conclusion is reliable.
[5 marks]
18. Suggest TWO ways a student could improve the accuracy of measurements taken during a fieldwork investigation into river discharge.
[2 marks]
19. Explain why it is important to acknowledge limitations when writing up a fieldwork investigation.
[3 marks]
20. A group of students conducted fieldwork to investigate whether building height affects wind speed at street level in a central business district. They measured wind speed at 20 locations using handheld anemometers and recorded building heights from architectural plans.
Evaluate the strengths and limitations of the data collection methods used in this investigation.
[3 marks]
END OF QUIZ
Answers
A-Level Geography H1 Quiz - Fieldwork
Answer Key and Marking Scheme
Total Marks: 60
Section A: Research Design and Planning (Questions 1–5)
1. Define the term fieldwork in the context of geographical inquiry.
[2 marks]
Answer: Fieldwork refers to the collection of primary data and information through direct observation, measurement, and investigation in a real-world, outdoor environment (1 mark) as part of a geographical inquiry or research process (1 mark).
Teaching Note: Fieldwork is a core component of geographical study. It is distinct from desk-based research because it involves first-hand data collection in the field. Students should understand that fieldwork enables geographers to test hypotheses, observe processes, and gather evidence that cannot be obtained from secondary sources alone.
2. Distinguish between primary data and secondary data, giving one example of each that a geography student might collect during a fieldwork investigation.
[3 marks]
Answer:
- Primary data is original data collected first-hand by the researcher for a specific investigation (1 mark). Example: measuring river velocity using a flow meter (or any valid primary data example) (0.5 mark).
- Secondary data is pre-existing data that was collected by someone else for a different purpose (1 mark). Example: using census population data from the Department of Statistics (or any valid secondary data example) (0.5 mark).
Teaching Note: The key distinction is who collected the data and for what purpose. Primary data is tailored to the student's specific research question, while secondary data provides context or supplementary information. Common mistake: students sometimes confuse the two — remind them that if they collected it themselves during fieldwork, it is primary.
3. A student is planning a fieldwork investigation into the impact of tourism on coastal erosion at a beach resort. State TWO factors the student should consider when selecting a suitable fieldwork site.
[2 marks]
Answer: Any TWO of the following (1 mark each):
- Accessibility — the site must be reachable and safe to visit for data collection.
- Representativeness — the site should be typical of the coastal environment being studied and not an anomalous location.
- Safety — the site should not pose undue risks (e.g., unstable cliffs, dangerous currents).
- Permission/land access — the student may need permission from landowners or authorities to access the site.
- Relevance to research question — the site should exhibit characteristics relevant to tourism and coastal erosion.
Teaching Note: Site selection is a critical planning decision. Students should think practically: even the best research question is useless if the site cannot be safely or legally accessed. Examiners reward specific, well-reasoned factors over vague answers like "a good location."
4. Explain why a pilot study is an important stage in the fieldwork process.
[4 marks]
Answer: A pilot study is a small-scale trial run of the fieldwork investigation conducted before the main data collection (1 mark). It is important because:
- It allows the researcher to test and refine data collection methods (e.g., questionnaire wording, equipment use) to identify problems before the main study (1 mark).
- It helps estimate the time required for each data collection activity, ensuring the main study is feasible within the available time (1 mark).
- It enables the researcher to assess whether the chosen sampling strategy is practical and likely to yield useful data (1 mark).
- It can identify safety hazards or logistical issues that might not have been apparent during the planning stage (bonus point, not required for full marks).
Teaching Note: A pilot study is not optional "nice-to-have" work — it is a fundamental part of good research design. Students should understand that it reduces the risk of collecting flawed or unusable data during the main investigation. Common mistake: students describe what a pilot study is but fail to explain why it is important.
5. Describe TWO ethical considerations a researcher must address before conducting fieldwork involving human participants.
[4 marks]
Answer: Any TWO of the following, described with sufficient depth (2 marks each):
- Informed consent — participants must be fully informed about the purpose of the research, what their involvement entails, and their right to withdraw at any time without penalty.
- Confidentiality and anonymity — the identity of participants must be protected, and their responses should not be traceable back to them in any published findings.
- Do no harm — the researcher must ensure that participation does not cause physical, psychological, or social harm to participants.
- Right to withdraw — participants must be informed that they can stop participating at any stage without needing to give a reason.
Teaching Note: Ethical considerations are increasingly emphasised in A-Level Geography. Students should be able to name specific ethical principles and explain what they mean in practice. For example, "informed consent" is not just asking permission — it means the participant truly understands what they are agreeing to.
Section B: Data Collection Methods (Questions 6–10)
6. Refer to Figure 1 (quadrat sampling diagram).
(a) State the type of sampling method being used if the student places the quadrat at predetermined intervals along a transect line.
[1 mark]
Answer: Systematic sampling (1 mark).
Teaching Note: Systematic sampling involves selecting samples at regular intervals (e.g., every 5 metres along a transect). This is different from random sampling (where locations are chosen randomly) and stratified sampling (where the population is divided into subgroups). The key identifier is the use of fixed, predetermined intervals.
(b) Calculate the estimated percentage cover of marram grass within the quadrat shown in Figure 1.
[2 marks]
Answer:
- The quadrat has 100 squares (10 × 10 grid).
- Marram grass covers approximately 35 squares.
- Percentage cover = (35 ÷ 100) × 100 = 35% (2 marks: 1 for method, 1 for correct answer).
Teaching Note: Quadrat percentage cover is calculated by counting the number of grid squares in which the species appears (even partially) and dividing by the total number of squares. Students should show their working to secure both marks.
(c) Suggest ONE advantage of using a quadrat to measure vegetation cover compared to a visual estimate alone.
[1 mark]
Answer: Any ONE of the following (1 mark):
- It provides a standardised and repeatable method, reducing subjectivity.
- It gives a quantitative and more accurate measurement of cover.
- It allows for comparison between different sites or time periods because the same method is used.
7. A student is investigating changes in sediment size along a river channel. Describe how the student could systematically collect sediment samples at different points across the river cross-section.
[4 marks]
Answer:
- The student should first establish a transect line across the river channel from one bank to the other, perpendicular to the flow direction (1 mark).
- At regular intervals along the transect (e.g., every 1 metre), the student should collect a sediment sample using a trowel or sediment grab (1 mark).
- Each sample should be labelled with its position along the transect (e.g., distance from the left bank) to ensure it can be identified later (1 mark).
- The student should collect samples of consistent mass (e.g., 100g each) to allow fair comparison, and record the location, water depth, and flow conditions at each point (1 mark).
Teaching Note: Systematic data collection requires a clear, repeatable procedure. Students should demonstrate understanding of transect use, consistent sampling technique, and good record-keeping. Common mistake: describing the method without mentioning the transect or systematic intervals.
8. Explain TWO advantages of using a structured questionnaire over an unstructured interview for collecting data on residents' perceptions of urban heat in a neighbourhood.
[4 marks]
Answer: Any TWO of the following, explained (2 marks each):
- Standardisation — all respondents answer the same questions in the same order, making responses directly comparable and easier to analyse statistically (2 marks).
- Efficiency — questionnaires can be distributed to many respondents simultaneously (or completed quickly), allowing a larger sample size than time-consuming individual interviews (2 marks).
- Reduced interviewer bias — since the questions are fixed and self-administered, the researcher's tone, body language, or probing cannot influence responses (2 marks).
- Anonymity — respondents may feel more comfortable answering sensitive questions honestly when their identity is not directly linked to their responses (2 marks).
Teaching Note: Students should be able to compare data collection methods critically. The key is to explain why the advantage matters for the specific investigation, not just list generic benefits.
9. State TWO ways in which the reliability of fieldwork data can be improved during the data collection stage.
[2 marks]
Answer: Any TWO of the following (1 mark each):
- Taking repeated measurements and calculating an average to reduce random errors.
- Using calibrated and standardised equipment to ensure consistency.
- Training all data collectors to use the same technique (inter-rater reliability).
- Collecting data under similar conditions (e.g., same time of day, same weather) to reduce variability.
- Using a larger sample size to reduce the impact of anomalous results.
10. A student uses a digital anemometer to measure wind speed at a coastal fieldwork site. The readings (in m/s) taken at 10-minute intervals are: 4.2, 5.8, 3.6, 6.1, 4.9, 5.3, 4.7, 5.0, 4.4, 5.6. Calculate the mean wind speed from these readings.
[1 mark]
Answer:
- Sum = 4.2 + 5.8 + 3.6 + 6.1 + 4.9 + 5.3 + 4.7 + 5.0 + 4.4 + 5.6 = 49.6
- Number of readings = 10
- Mean = 49.6 ÷ 10 = 4.96 m/s (1 mark)
Teaching Note: The mean is calculated by summing all values and dividing by the number of values. Students should show the sum and the division to demonstrate their method. The answer should include the unit (m/s).
Section C: Data Presentation and Analysis (Questions 11–15)
11. Refer to Figure 2 (scatter graph of distance from city centre vs. surface temperature).
(a) Describe the relationship shown in Figure 2.
[2 marks]
Answer: There is a negative correlation (or inverse relationship) between distance from the city centre and mean daytime surface temperature (1 mark). As distance from the city centre increases, the mean daytime surface temperature decreases (1 mark).
Teaching Note: Students must identify the direction of the relationship (negative) and describe what it means in context. Simply saying "as one increases, the other decreases" without referencing the specific variables is insufficient for full marks.
(b) Suggest ONE geographical reason for this relationship.
[2 marks]
Answer: Any ONE of the following, explained (2 marks):
- The urban heat island effect — city centres have more buildings, roads, and artificial surfaces that absorb and store solar radiation, releasing heat and raising temperatures. Areas further from the centre have more vegetation and natural surfaces that cool the air through evapotranspiration (2 marks).
- Reduced vegetation cover in the city centre means less shading and less evapotranspiration, leading to higher temperatures compared to greener suburban and rural areas (2 marks).
- Anthropogenic heat sources (vehicles, air conditioning, industry) are concentrated in the city centre, adding to the heat load (2 marks).
12. A student presents fieldwork data on land use in a town using a pie chart. State ONE advantage and ONE disadvantage of using a pie chart to present this type of data.
[2 marks]
Answer:
- Advantage (1 mark): A pie chart clearly shows the proportional composition of different land use categories as parts of a whole, making it easy to compare the relative size of each category at a glance.
- Disadvantage (1 mark): A pie chart does not show actual quantities or absolute values — it only shows percentages, so the viewer cannot determine the total area or actual measurements. (Alternatively: it becomes difficult to read when there are many categories with similar proportions.)
13. Refer to Figure 3 (divided bar chart of land use composition at three sites).
Identify the most significant change in land use between Site 1 (Urban) and Site 3 (Rural), and suggest a reason for this change.
[3 marks]
Answer:
- Identification (1 mark): The most significant change is the dramatic increase in green space from 10% at Site 1 (Urban) to 75% at Site 3 (Rural) — a 65 percentage point increase. (Alternatively: the decrease in residential land use from 45% to 15%.)
- Reason (2 marks): In rural areas, there is less demand for built development and more land is available for natural vegetation, agriculture, or open space (1 mark). Urban areas have higher population density and economic activity, leading to greater demand for residential, commercial, and industrial land, which reduces green space (1 mark).
Teaching Note: Students should identify the largest proportional change and link it to the urban-rural gradient concept. The reason should demonstrate understanding of how land use is driven by population density, economic activity, and land availability.
14. Explain why it is important to use appropriate statistical techniques when analysing fieldwork data.
[3 marks]
Answer:
- Appropriate statistical techniques allow the researcher to identify patterns, trends, and relationships in the data that may not be apparent from raw figures alone (1 mark).
- They provide objective and quantifiable evidence to support or reject hypotheses, making the analysis more rigorous and less subjective (1 mark).
- They enable the researcher to assess the strength and significance of relationships (e.g., using correlation coefficients), helping to distinguish between meaningful patterns and random variation (1 mark).
Teaching Note: Students should understand that statistical analysis is not just a mathematical exercise — it is a tool for making sense of data and drawing valid conclusions. Common mistake: students state that statistics "make results more accurate" without explaining how.
15. A student calculates Spearman's rank correlation coefficient for two variables and obtains a value of −0.82. Interpret this result.
[3 marks]
Answer:
- The value of −0.82 indicates a strong negative (inverse) correlation between the two variables (1 mark).
- This means that as one variable increases, the other variable tends to decrease (1 mark).
- The strength of −0.82 (close to −1) suggests that this relationship is statistically strong and unlikely to be due to chance, though it does not prove causation (1 mark).
Teaching Note: Spearman's rank correlation coefficient ranges from −1 (perfect negative correlation) to +1 (perfect positive correlation). Values close to 0 indicate weak or no correlation. Students should interpret both the direction (negative/positive) and the strength (magnitude) of the coefficient. Common mistake: students interpret the negative sign as "bad" or "no relationship" — it simply means the variables move in opposite directions.
Section D: Evaluation and Conclusions (Questions 16–20)
16. Define the term validity in the context of fieldwork investigations.
[2 marks]
Answer: Validity refers to the extent to which the fieldwork investigation accurately measures what it claims to measure (1 mark) and whether the conclusions drawn are well-supported by the data collected (1 mark).
Teaching Note: Validity is about truthfulness and accuracy. A study has high validity if its methods, data, and conclusions genuinely address the research question. It is distinct from reliability (which is about consistency). Common mistake: students confuse validity with reliability — validity asks "are we measuring the right thing?" while reliability asks "would we get the same result if we repeated it?"
17. A student investigates the effect of vegetation density on soil infiltration rates. The results show that sites with higher vegetation density have higher infiltration rates. However, the student only collected data on three occasions over two weeks.
Evaluate the extent to which the student's conclusion is reliable.
[5 marks]
Marking Descriptors:
| Marks | Descriptor |
|---|---|
| 1–2 | Basic recognition that the conclusion may be unreliable; limited or no explanation. |
| 3–4 | Clear evaluation with reference to specific limitations (sample size, time frame, conditions); some attempt to balance strengths and weaknesses. |
| 5 | Well-structured evaluation that considers both supporting evidence and limitations; reaches a substantiated judgement about reliability. |
Answer:
- The student's conclusion that higher vegetation density leads to higher infiltration rates is partially supported by the data collected, as the pattern is consistent with established geographical theory (vegetation improves soil structure and increases porosity) (1 mark).
- However, the small number of data collection occasions (only three over two weeks) is a significant limitation. Infiltration rates can vary considerably depending on antecedent soil moisture, recent rainfall, and seasonal changes — three occasions may not capture this variability (1 mark).
- The sample size (number of sites) is not stated, but if it was small, the conclusion may not be representative of the broader relationship (1 mark).
- Additionally, other confounding variables (e.g., soil type, slope gradient, compaction from foot traffic) may have influenced infiltration rates but were not controlled for (1 mark).
- Overall judgement: The conclusion may be valid in principle, but the limited data collection means it should be treated as tentative rather than definitive. More data collection occasions over a longer period, and control of additional variables, would strengthen the reliability of the conclusion (1 mark).
Teaching Note: Evaluation questions require students to weigh evidence and limitations, not just list problems. The best answers acknowledge what the study does well while identifying specific weaknesses and suggesting improvements. Students should avoid absolute statements ("the conclusion is completely wrong") in favour of nuanced judgements ("the conclusion is partially supported but limited by...").
18. Suggest TWO ways a student could improve the accuracy of measurements taken during a fieldwork investigation into river discharge.
[2 marks]
Answer: Any TWO of the following (1 mark each):
- Take multiple measurements at each sampling point and calculate the mean to reduce random errors.
- Use calibrated equipment (e.g., a flow meter that has been checked against known standards) to ensure readings are precise.
- Measure at consistent depths and positions within the river cross-section to ensure comparability between sites.
- Repeat measurements at different times (e.g., different tidal states or flow conditions) to account for temporal variability.
- Ensure the cross-sectional area is measured accurately using a tape measure and depth sounder at regular intervals.
19. Explain why it is important to acknowledge limitations when writing up a fieldwork investigation.
[3 marks]
Answer:
- Acknowledging limitations demonstrates academic honesty and critical self-reflection, showing that the researcher understands the boundaries of their investigation and is not overclaiming (1 mark).
- It allows the reader or examiner to assess the validity and reliability of the conclusions by understanding what factors may have influenced the results (1 mark).
- It provides a basis for recommending improvements in future investigations, contributing to the development of better research design and methodology (1 mark).
Teaching Note: Students sometimes view limitations as a sign of failure. In fact, acknowledging limitations is a hallmark of good geographical practice. Examiners reward students who can critically evaluate their own work and suggest realistic improvements.
20. A group of students conducted fieldwork to investigate whether building height affects wind speed at street level in a central business district. They measured wind speed at 20 locations using handheld anemometers and recorded building heights from architectural plans.
Evaluate the strengths and limitations of the data collection methods used in this investigation.
[3 marks]
Answer:
- Strength (1 mark): Using a handheld anemometer provides direct, quantitative measurements of wind speed at street level, which is appropriate for the research question. Measuring at 20 locations provides a reasonable sample size for identifying patterns across the CBD.
- Limitation 1 (1 mark): Handheld anemometers can be affected by the user's position, body blocking wind, and inconsistent holding height, which may introduce measurement error.
- Limitation 2 (1 mark): Architectural plans may not reflect actual building heights accurately (e.g., recent modifications, rooftop structures) and do not account for other factors that influence wind speed at street level, such as street width, building orientation, and nearby open spaces.
- Additional point: The study does not control for temporal variation — wind speed varies with weather conditions, so measurements taken at different times may not be directly comparable.
Teaching Note: Evaluation of methods requires students to think critically about both what works well and what could be improved. The best answers identify specific, relevant strengths and limitations rather than generic statements. Students should also consider whether the methods are appropriate for the specific research question being investigated.
END OF ANSWER KEY
Free quiz and exam paper access
Enter your details to view this paper
Your access is remembered on this device.