AI Generated Quiz
A Level H1 Geography Fieldwork Quiz
Free A Level H1 Geography Fieldwork quiz, HY3 AI version, with questions, answers, and A Level-style practice for Singapore students.
These static practice materials are generated from the site's syllabus and paper-generation workflow, with source and model context shown so students and parents can evaluate the material before use.
Questions

Free quiz and exam paper access
Enter your details to view this paper
Your access is remembered on this device.
Answers
A-Level Geography H1 Quiz - Fieldwork: Answer Key
Topic: Fieldwork
Total Marks: 40
Level: A-Level H1
Section A Answers (Q1–8)
Q1 [2 marks]
Answer: One defining feature is that Cluster 2 fieldwork focuses on either community response to climate change OR needs analysis of the elderly living in an urban neighbourhood (syllabus-prescribed focus).
Teaching note: The 2023 H1 syllabus specifies only these two foci for Fieldwork; unlike open topics in Cluster 1, students must study one of these. Mark awarded for naming the specific focus.
Q2 [2 marks]
Answer: Face-to-face allows clarification for elderly who may have low literacy or hearing issues; builds rapport and improves response quality.
Teaching note: Elderly respondents may struggle with written/online forms; personal contact increases completion and accuracy.
Q3 [2 marks]
Answer: Informed consent must be obtained before interview/survey.
(Other acceptable: anonymity, confidentiality, right to withdraw.)
Teaching note: Ethical fieldwork protects vulnerable groups; consent is foundational.
Q4 [2 marks]
Answer: Schedule visits at non-rest hours (avoid meal/Medical times); or use quiet public spaces for interviews.
Teaching note: Minimising social impact is part of AO1 fieldwork skills.
Q5 [2 marks]
Answer: Survey responses / interview transcripts / observational field notes.
Teaching note: Primary data collected directly by students; not from books.
Q6 [2 marks]
Answer: Semi-structured interviews allow follow-up probes, revealing deeper context than fixed closed questions.
Teaching note: Flexibility yields qualitative depth.
Q7 [2 marks]
Answer: Trip/fall hazard on home visits; or fatigue of respondent.
Teaching note: Risk assessment is required before fieldwork.
Q8 [2 marks]
Answer: Use stratified sampling by age band or block to reflect neighbourhood profile.
Teaching note: Representativeness reduces bias.
Section B Answers (Q9–14)
Q9 [4 marks]
Strength [2]: Interviews give rich qualitative detail on why residents respond to climate change as they do (e.g., personal coping).
Limitation [2]: Small number (10) limits generalisability; interviewer bias possible.
Marking: 2+2; accept any valid pair.
Q10 [4 marks]
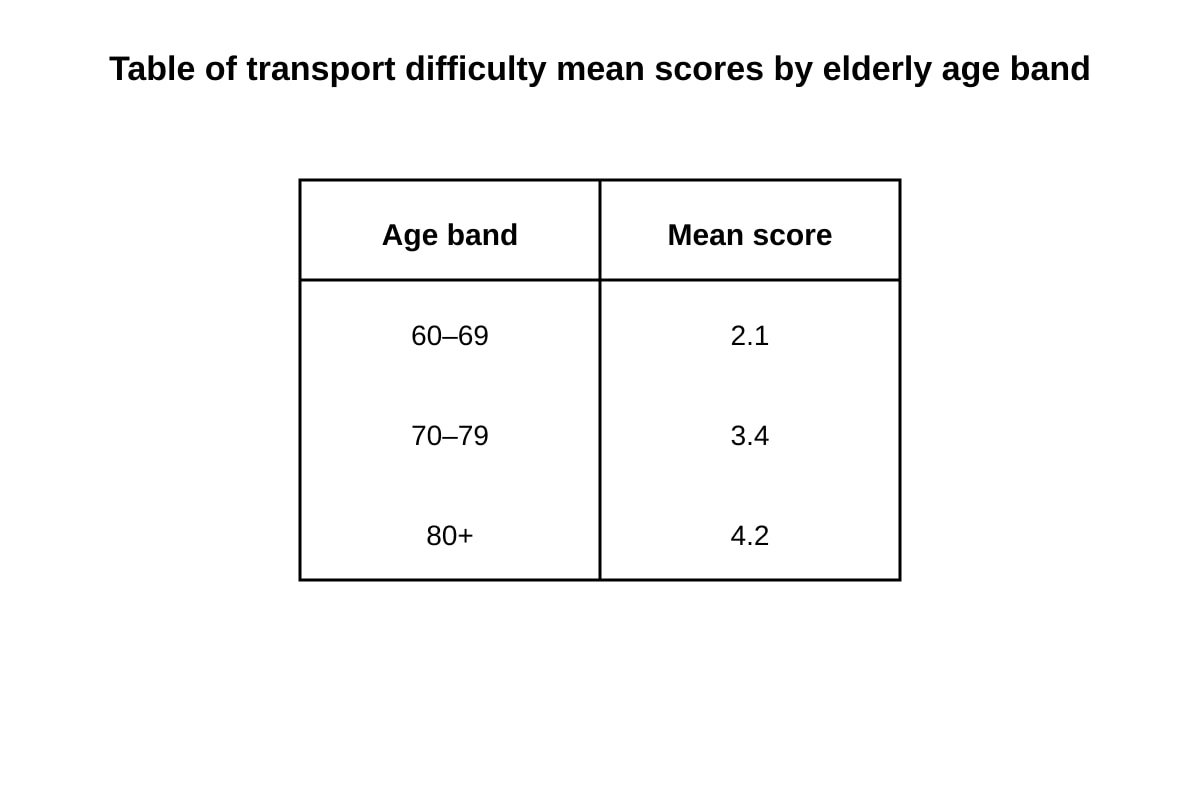
Pattern [2]: Scores rise with age (2.1 → 3.4 → 4.2), showing transport difficulty increases for older elderly.
Reason [2]: Physical mobility declines with age; fewer can walk to MRT/bus.
Teaching note: Table in Q10-fig1 must show exact values; pattern description must reference numbers.
Q11 [4 marks]
(i) [2] Randomise question order for sensitive items.
(ii) [2] Use neutral wording; avoid leading phrases like "climate change is scary".
Teaching note: Bias reduction is AO2.
Q12 [4 marks]
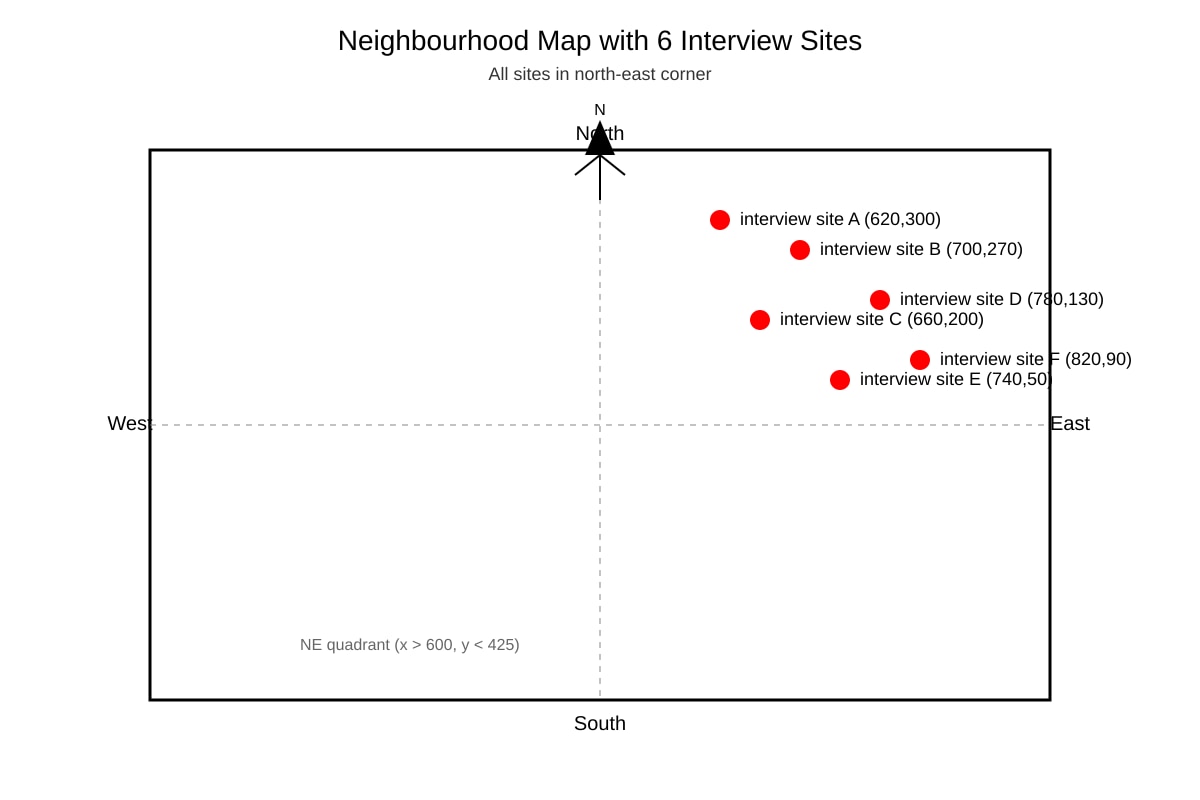
Limitation [4]: Spatial bias – results unrepresentative of whole neighbourhood; north-east only may miss flood/heat issues elsewhere. Map Q12-fig1 shows all sites in NE quadrant, confirming cluster.
Marking: 4 for clear spatial bias explanation linked to map.
Q13 [3 marks]
Method [1]: Bar chart (or histogram).
Reason [2]: Shows count per age group clearly for categorical age data.
Teaching note: Correct graph type for age bands.
Q14 [3 marks]
Answer [3]: Pilot test reveals confusing questions, estimates time, and improves validity before full rollout.
Teaching note: Piloting is standard AO1 method improvement.
Section C Answers (Q15–20)
Q15 [3 marks]
Frame [1]: Residents Committee elderly roster.
Reason [2]: Official list covers local elderly, enabling systematic sample.
Marking: 1+2.
Q16 [4 marks]
% = (40/100)×100 = 40% [2].
Explanation [2]: Shows behavioural adaptation to heat; relevant as climate-change response indicator.
Teaching note: Calculation must show division and ×100.
Q17 [4 marks]
Usefulness [4]: Photo shows real impact (void deck flood) → concrete evidence of local climate effect [2]; but single image lacks frequency, cause, resident perception → limited for community response [2]. Image Q17-fig1 must show flood depth mark.
Marking descriptors: 4 = notes both strength and limit with photo link.
Q18 [4 marks]
(i) [2] Use large-print or read-aloud format.
(ii) [2] Replace written scale with verbal showcard (happy/sad face).
Teaching note: Accessibility modification.
Q19 [4 marks]
Test [2]: Compare survey need scores across estate types (t-test or mean diff).
Limitation [2]: Self-report may miss hidden poverty in private estates; small n.
Teaching note: Method must be concrete.
Q20 [5 marks]
Strengths [3, 1.5 each]: (1) Mixed method triangulates perception with rainfall data; (2) Spatial link to low-lying blocks shows environment effect.
Weakness [2]: Survey n=120 may miss non-respondents; rainfall alone not full climate response.
Marking: 5 total; level-style concise.