A-Level Geography H1 Quiz - Resources Sustainability
Name: ___________________________
Class: ___________________________
Date: ___________________________
Score: ______ / 40
Duration: 60 minutes
Total Marks: 40
Topic: Resources Sustainability (Cluster 1.1 – Cities in a Sustainable Future)
Instructions:
- This quiz contains 20 questions across three sections.
- Section A (Q1–5): Short data/recall items (1 mark each).
- Section B (Q6–15): Source-based structured responses (2–5 marks each).
- Section C (Q16–20): Extended evaluative responses (3–5 marks each).
- Use the provided resources and your geographical knowledge.
- Write clearly in the spaces provided.
Section A: Short Response (5 marks)
1. Define "sustainable development" in the context of urban resource use. [1]
2. Name one non-hazardous solid waste problem common in cities of less developed countries. [1]
3. State one reason why slums develop in rapidly urbanising cities. [1]
4. Give one economic reason for urban reimaging. [1]
5. Identify one group whose liveability experience is shaped by the identity marker "age". [1]
Section B: Source-Based Structured Response (25 marks)
Resource 1 – Waste generation in two cities (tonnes per day, 2022)
| City | High-income (City A) | Low-income (City B) |
|---|
| Total solid waste | 3200 | 1800 |
| Recycled | 2100 (65.6%) | 180 (10%) |
| Landfilled | 1100 | 1620 |
6. Using Resource 1, describe the difference in waste recycling performance between City A and City B. [2]
7. Account for the lower recycling rate in City B using geographical reasoning. [3]
Resource 2 – Service provision in informal settlement X (2015 vs 2023)
| Service | 2015 (% with access) | 2023 (% with access) |
|---|
| Piped water | 20 | 75 |
| Electricity | 35 | 88 |
| Formal waste collection | 10 | 60 |
8. Account for the changes in service provision in settlement X as shown in Resource 2. [5]
Resource 3 – Characteristics of settlement Y (field photo notes)
- Dwellings built from corrugated metal and wood scraps
- Structures within 1 m of each other
- No paved roads; open drainage channels
- Small informal shops at ground level
9. Explain the characteristics of settlement Y as described in Resource 3. [5]
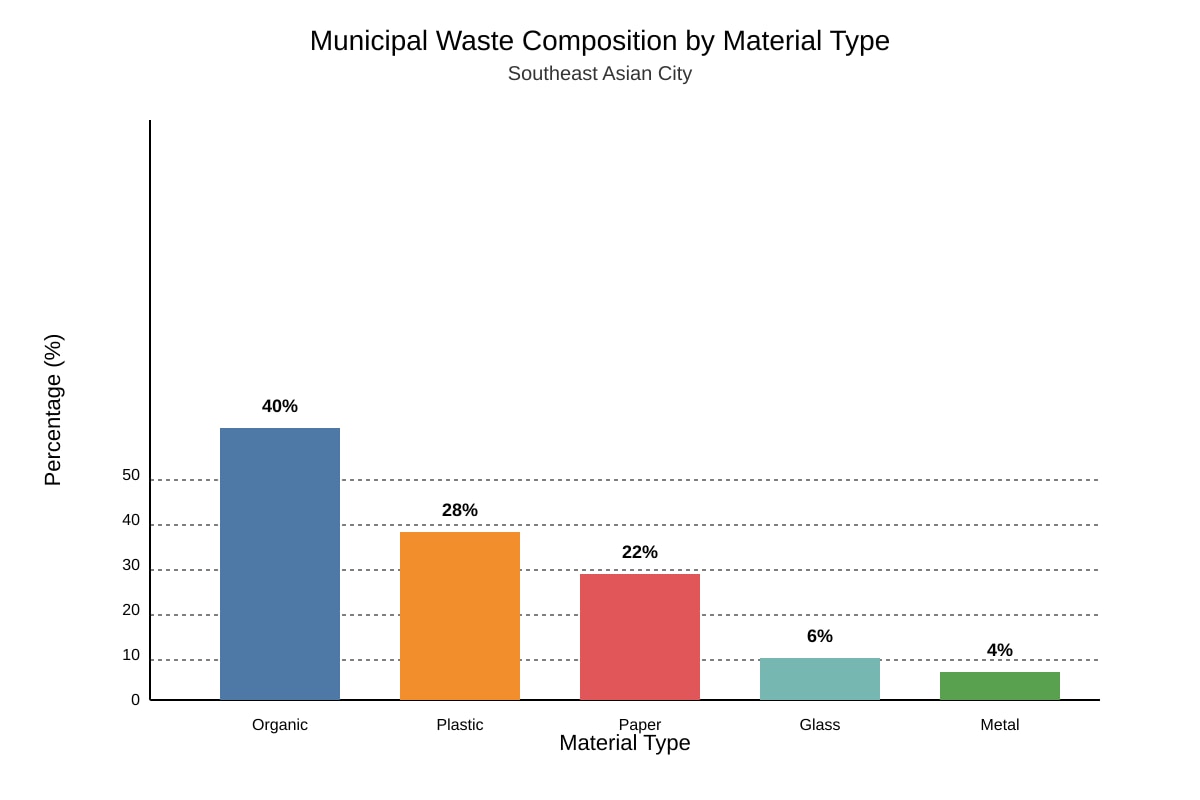
Generated graph for Q10.
10. Using the chart in Q10-fig1, identify the two largest waste streams and suggest one management strategy for each. [4]
Resource 4 – Urban reimaging project Z
A riverfront in a post-industrial city was converted to parks and cafes; tourist arrivals rose from 0.5m to 2.1m yearly.
11. Explain one economic impact of urban reimaging in project Z. [2]
12. Evaluate whether reimaging in Z supports environmental sustainability. [3]
Resource 5 – Elderly access to services (city survey)
| Service | Elderly satisfied (%) | General pop. satisfied (%) |
|---|
| Transport | 42 | 70 |
| Healthcare | 55 | 68 |
| Public spaces | 38 | 65 |
13. Describe the liveability gap for elderly from Resource 5. [2]
14. Suggest one strategy to improve elderly liveability in transport. [2]
Resource 6 – Gender and waste work
In City C, 80% of informal waste pickers are women; they lack protective gear and formal contracts.
15. Explain how gender shapes liveability for waste workers in City C. [3]
Section C: Extended Response (10 marks)
16. Evaluate the usefulness of Resource 2 and Resource 3 in understanding slum conditions in developing cities. [5]
17. "Waste management success depends more on income level than policy." Discuss with examples. [3]
18. Explain the tension between urban liveability and sustainable resource use for women. [3]
19. Assess the role of urban reimaging in achieving sustainable cities. [3]
20. To what extent can slum upgrading reconcile sustainability and liveability? [3]
</stage3_quiz_answers_md>
A-Level Geography H1 Quiz Answers - Resources Sustainability
Total Marks: 40
Section A (5 marks)
1. [1 mark] Sustainable development = meeting present needs without compromising future generations' ability to meet theirs, applied to urban resource use (e.g., using resources within regenerative limits).
Teaching note: Core UN definition; in urban context it means balancing consumption and waste with ecological capacity.
2. [1 mark] Any one: open dumping, low collection coverage, high organic decomposition odour, plastic accumulation.
Accept: "inadequate landfill sites" or "uncollected waste in streets".
3. [1 mark] Rural–urban migration exceeding formal housing supply / poverty / lack of affordable housing.
Common mistake: stating "population growth" without linking to housing gap.
4. [1 mark] To attract investment, tourism, or regenerate declining economic base.
Mark: economic reason only (not social).
5. [1 mark] Elderly (or women, as age and gender are the two identity markers in syllabus).
Note: Question asks "age" marker → elderly.
Section B (25 marks)
6. [2 marks] City A recycled 65.6% vs City B 10%; City B landfilled 90% of waste.
Mark scheme: 1 mark for correct figures, 1 mark for contrast statement.
7. [3 marks]
- Lack of capital for sorting facilities (1)
- Weak formal collection systems → informal dumping (1)
- Low public awareness / no policy incentive (1)
Teaching: Link to development stage; City B's low income limits infrastructure.
8. [5 marks]
- Piped water +55%: government pipeline extension / NGO aid (1+1 explain)
- Electricity +53%: grid connection programme (1+1)
- Waste collection +50%: municipal service rollout (1+1)
Max 5: need 2–3 services with causal account each.
Common trap: describing change without "why".
9. [5 marks]
- Makeshift materials → poverty, no formal housing (1+1)
- High density → land scarcity, influx (1+1)
- Open drainage → no planning, health risk (1+1)
- Informal shops → survival economy (1)
Mark: 4 characteristics × 1 explain + 1 overall.
10. [4 marks] Largest: Organic 40% (compost strategy), Plastic 28% (recycling/segregation).
2 marks ID, 2 marks strategies.
11. [2 marks] Tourism revenue increased (0.5m→2.1m) supporting local businesses.
Mark: economic impact with evidence.
12. [3 marks]
- Green space improves environment (1)
– Construction may increase embodied carbon (1)
= Partial: depends on materials/energy (1)
Descriptors: balanced judgment.
13. [2 marks] Elderly satisfaction lower in all three; transport gap 28 pts, public spaces 27 pts.
1 mark data, 1 mark gap statement.
14. [2 marks] Priority bus stops, sheltered walkways, free elderly travel pass.
1 mark idea, 1 mark relevance.
15. [3 marks] Women dominate insecure work (1), lack protection → health risk (1), excluded from planning → lower liveability (1).
Section C (10 marks)
16. [5 marks]
Resource 2 useful: quantitative service gap shows deprivation (1+1).
Resource 3 useful: visual form of informality (1+1).
Limitation: R2 no cause, R3 no scale (1).
Level: evaluates both, balanced.
17. [3 marks]
For: high income enables tech (1).
Against: policy (e.g., Singapore) succeeds at mid-income (1).
Judgment: interaction not single factor (1).
18. [3 marks] Women bear care burden + waste work (1); resource use (water/energy) gendered (1); tension: efficiency vs access (1).
19. [3 marks] Brings investment (1), green space (1), but may displace poor (1).
20. [3 marks] Upgrading gives services (sustainability+liveability) (1); if forced relocation → liveability falls (1); extent depends on participation (1).
</stage3_quiz_answers_md>
<stage3_quiz_md>
A-Level Geography H1 Quiz - Resources Sustainability
Name: ___________________________
Class: ___________________________
Date: ___________________________
Score: ______ / 40
Duration: 60 minutes
Total Marks: 40
Topic: Resources Sustainability (Cluster 1.1 – Cities in a Sustainable Future)
Instructions:
- This quiz contains 20 questions across three sections.
- Section A (Q1–5): Short data/recall items (1 mark each).
- Section B (Q6–15): Source-based structured responses (2–5 marks each).
- Section C (Q16–20): Extended evaluative responses (3–5 marks each).
- Use the provided resources and your geographical knowledge.
- Write clearly in the spaces provided.
Section A: Short Response (5 marks)
1. Define "sustainable development" in the context of urban resource use. [1]
2. Name one non-hazardous solid waste problem common in cities of less developed countries. [1]
3. State one reason why slums develop in rapidly urbanising cities. [1]
4. Give one economic reason for urban reimaging. [1]
5. Identify one group whose liveability experience is shaped by the identity marker "age". [1]
Section B: Source-Based Structured Response (25 marks)
Resource 1 – Waste generation in two cities (tonnes per day, 2022)
| City | High-income (City A) | Low-income (City B) |
|---|
| Total solid waste | 3200 | 1800 |
| Recycled | 2100 (65.6%) | 180 (10%) |
| Landfilled | 1100 | 1620 |
6. Using Resource 1, describe the difference in waste recycling performance between City A and City B. [2]
7. Account for the lower recycling rate in City B using geographical reasoning. [3]
Resource 2 – Service provision in informal settlement X (2015 vs 2023)
| Service | 2015 (% with access) | 2023 (% with access) |
|---|
| Piped water | 20 | 75 |
| Electricity | 35 | 88 |
| Formal waste collection | 10 | 60 |
8. Account for the changes in service provision in settlement X as shown in Resource 2. [5]
Resource 3 – Characteristics of settlement Y (field photo notes)
- Dwellings built from corrugated metal and wood scraps
- Structures within 1 m of each other
- No paved roads; open drainage channels
- Small informal shops at ground level
9. Explain the characteristics of settlement Y as described in Resource 3. [5]
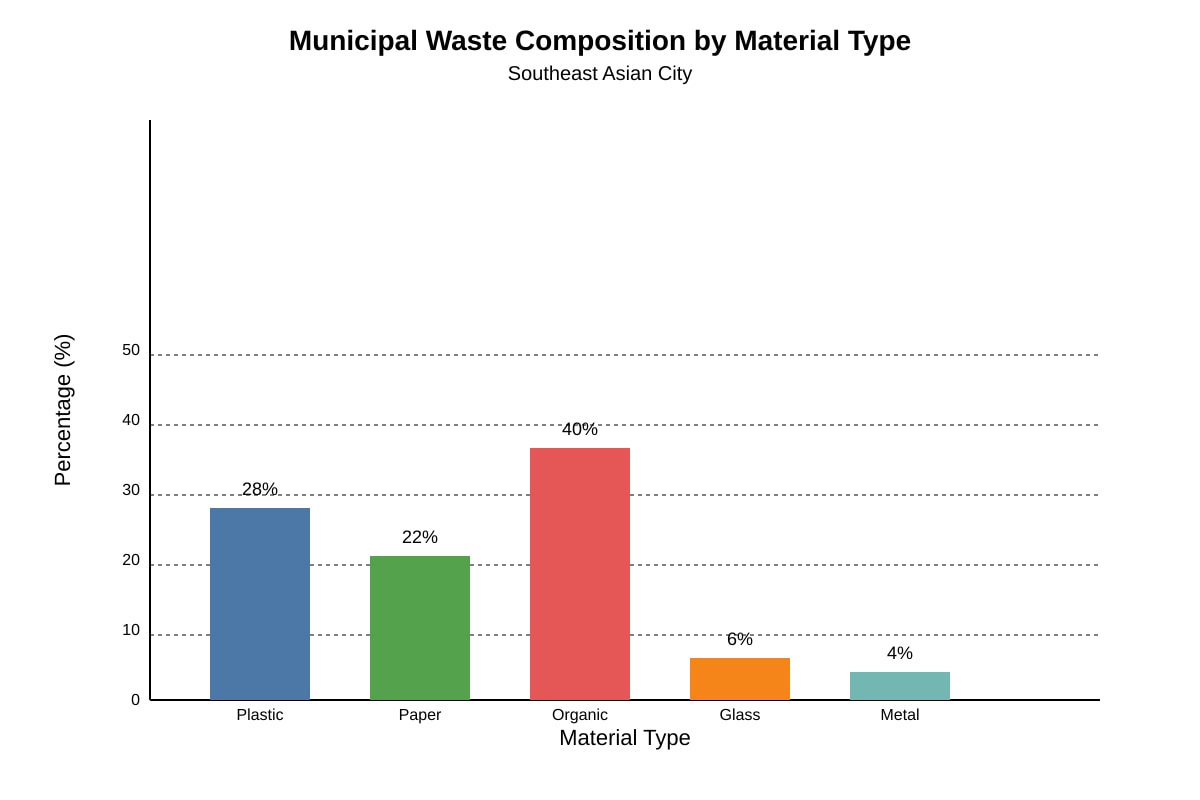
Generated graph for Q10.
10. Using the chart in Q10-fig1, identify the two largest waste streams and suggest one management strategy for each. [4]
Resource 4 – Urban reimaging project Z
A riverfront in a post-industrial city was converted to parks and cafes; tourist arrivals rose from 0.5m to 2.1m yearly.
11. Explain one economic impact of urban reimaging in project Z. [2]
12. Evaluate whether reimaging in Z supports environmental sustainability. [3]
Resource 5 – Elderly access to services (city survey)
| Service | Elderly satisfied (%) | General pop. satisfied (%) |
|---|
| Transport | 42 | 70 |
| Healthcare | 55 | 68 |
| Public spaces | 38 | 65 |
13. Describe the liveability gap for elderly from Resource 5. [2]
14. Suggest one strategy to improve elderly liveability in transport. [2]
Resource 6 – Gender and waste work
In City C, 80% of informal waste pickers are women; they lack protective gear and formal contracts.
15. Explain how gender shapes liveability for waste workers in City C. [3]
Section C: Extended Response (10 marks)
16. Evaluate the usefulness of Resource 2 and Resource 3 in understanding slum conditions in developing cities. [5]
17. "Waste management success depends more on income level than policy." Discuss with examples. [3]
18. Explain the tension between urban liveability and sustainable resource use for women. [3]
19. Assess the role of urban reimaging in achieving sustainable cities. [3]
20. To what extent can slum upgrading reconcile sustainability and liveability? [3]