From Real Exams Quiz
A Level H1 Geography Physical Geography Quiz
Free A Level H1 Geography Physical Geography quiz, HY3 Exam version, with questions, answers, and A Level-style practice for Singapore students.
These static practice materials are generated from the site's syllabus and paper-generation workflow, with source and model context shown so students and parents can evaluate the material before use.
Questions


Free quiz and exam paper access
Enter your details to view this paper
Your access is remembered on this device.
Answers
A-Level Geography H1 Quiz - Physical Geography (Answer Key)
Total Marks: 40
Topic: Physical Geography
Section A: Fundamentals
1. [1 mark]
Answer: Ice cores (or ocean cores).
Teaching note: Proxy indicators are indirect measures of past climate. Ice cores trap air bubbles and isotopes revealing CO₂ and temperature. Other acceptable: ocean sediment cores, tree rings.
Common mistake: Naming direct instruments like thermometers (not available for Quaternary past).
2. [2 marks]
Answer: The enhanced greenhouse effect is the additional warming caused by increased concentrations of greenhouse gases (e.g., CO₂, CH₄) from human activities, which trap more outgoing longwave radiation than in pre-industrial times.
Mark breakdown: 1 mark for human-induced increase in GHGs; 1 mark for mechanism of extra heat retention.
Teaching note: Distinguish from natural greenhouse effect which is necessary for life.
3. [1 mark]
Answer: 0.85 – 0.05 = 0.80 °C.
Teaching note: Subtract 1950 value from 2020 value. Show working: 0.85 − 0.05 = 0.80.
4. [1 mark]
Answer: Changes in thermohaline circulation (or changes in ice sheets).
Teaching note: Natural factors from syllabus: solar output, thermohaline circulation, ice sheets.
5. [2 marks]
Answer: Melting permafrost releases methane (CH₄), a potent greenhouse gas, which increases atmospheric warming, causing more permafrost to melt.
Mark breakdown: 1 mark for identifying mechanism (e.g., permafrost/methane); 1 mark for explaining acceleration loop.
Teaching note: Positive feedback amplifies initial warming.
Section B: Source & Data-Based
6. [3 marks]
Answer:
- Ice core shows CO₂ stayed within 180–300 ppm for 800k yrs (natural range). [1]
- Post-1850 rise to 410 ppm is outside this range. [1]
- Sharp rise coincides with industrial era → human cause, not natural variability. [1]
Teaching note: Use data values as evidence. Mark for each clear point with reference.
7. [3 marks]
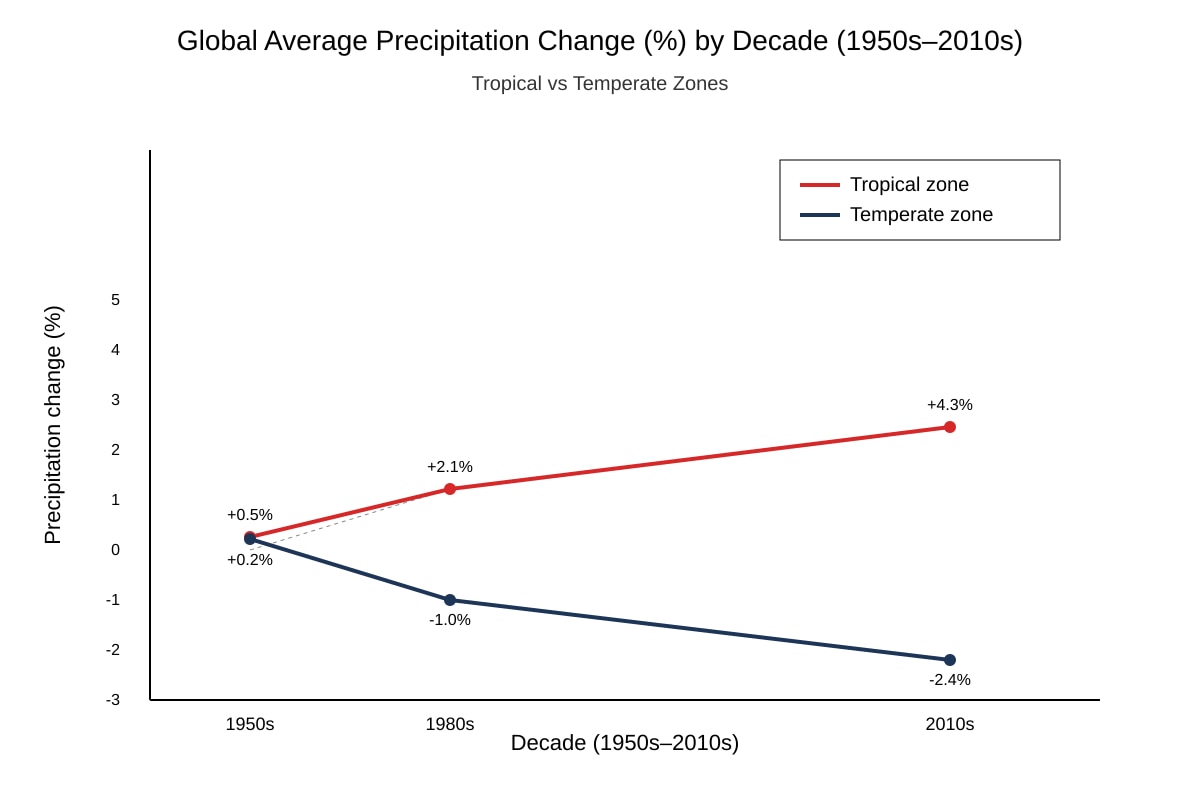
Expected visual: tropical line rising from +0.5% to +4.3%; temperate line falling from +0.2% to −2.4%.
Answer:
- Tropical zone precipitation increased steadily (0.5% → 4.3%). [1]
- Temperate zone decreased after 1980s (0.2% → −2.4%). [1]
- Trends diverge: wetting tropics, drying temperate. [1]
Teaching note: Describe both directions using figures.
8. [4 marks]
Answer:
- Cyclone brings intense rainfall (orthonormal inflow). [1]
- High precipitation exceeds infiltration → surface runoff increases. [1]
- River discharge rises beyond bankfull capacity. [1]
- Low pressure + storm surge in coastal reach worsens flooding. [1]
Teaching note: Link hydrological processes: precipitation → runoff → channel flow.
9. [3 marks]
Answer:
- Thermohaline circulation carries warm equatorial water to N. Atlantic. [1]
- Slowdown reduces heat transport to Europe. [1]
- Local cooling can offset global warming regionally. [1]
Teaching note: Distinguish global mean vs regional effect.
10. [3 marks]
Answer:
- Larger ice sheets increase albedo → reflect more solar radiation → cooling. [1]
- Retreat reduces albedo → more absorption → warming. [1]
- This self-reinforcing loop is feedback (ice-albedo feedback). [1]
Teaching note: Connect to Quaternary glacial-interglacial cycles.
11. [3 marks]
Expected map: formation 5–20° N/S, none at equator.
Answer:
- Most form between 5° and 20° latitude N and S. [1]
- Absent within 5° of equator (Coriolis too weak). [1]
- Tracks curve poleward in basins. [1]
Teaching note: Coriolis force requirement.
12. [4 marks]
Answer:
Useful: direct proxy for CO₂/temp over long timescales [1]; high resolution [1].
Limited: spatial coverage (poles/oceans only) [1]; dating uncertainty [1].
Teaching note: Evaluate = judge strengths + weaknesses.
Section C: Extended Response
13. [3 marks]
Answer: IPCC states warming since mid-20th century is unequivocal [1]; very likely (>90%) due to anthropogenic GHG emissions [1]; not explained by natural forcings alone [1].
14. [4 marks]
Answer: Deforestation reduces CO₂ uptake [1]; land-use change removes wetlands [1]; ocean acidification weakens plankton sinks [1]; urbanization cuts vegetation [1].
15. [5 marks]
Mark descriptors:
- L1 (1–2): asserts natural insufficient, little evidence.
- L2 (3–4): uses some evidence (ice cores, solar output stable).
- L3 (5): synthesises: natural factors explain past variability but rate/post-1850 rise matches emissions.
Answer points: natural factors (solar, thermohaline) changed slowly; observed warming rate exceeds natural; CO₂ rise from fossils.
Teaching note: Assessment requires balanced judgement.
16. [3 marks]
Answer: Shift in species ranges [1]; phenological changes (flowering) [1]; desertification stress [1].
17. [4 marks]
Answer: Sea-level rise floods settlements [1]; higher temp → more heat stress [1]; precipitation change alters water supply [1]; storm intensity displaces pop [1].
18. [4 marks]
Expected chart: Jakarta highest loss, New Orleans lowest.
Answer: Jakarta loses most at 3°C (9.8 bn) due subsidence+sea [2]; all cities worse at 3°C than 1.5°C [1]; uneven because exposure differs [1].
19. [4 marks]
Answer: Negative feedback e.g., increased plant growth from CO₂ absorbs C [1]; aerosol cooling [1]; cloud albedo [1]; limits but not stops warming [1].
20. [5 marks]
Mark descriptors L3 (5): evaluates extent with examples (sea walls, CCS) and notes limits (physical onset unavoidable).
Answer: Tech (GIS, desalination) helps adapt [2]; but cannot reverse locked-in warming [2]; thus partial mitigation [1].