From Real Exams Quiz
A Level H1 Geography Physical Geography Quiz
Free A Level H1 Geography Physical Geography quiz, Exam version, with questions, answers, and A Level-style practice for Singapore students.
These static practice materials are generated from the site's syllabus and paper-generation workflow, with source and model context shown so students and parents can evaluate the material before use.
Questions

Free quiz and exam paper access
Enter your details to view this paper
Your access is remembered on this device.
Answers
A-Level Geography H1 Quiz - Physical Geography: Answer Key
Total Marks: 50
Section A: Short Answer Questions (15 marks)
1. Define the term thermohaline circulation. [1]
Answer: Thermohaline circulation is a global ocean circulation system driven by differences in water density, which is controlled by temperature (thermo) and salinity (haline). It involves the movement of deep and surface ocean currents.
Marking Notes: 1 mark for a correct definition that mentions both temperature and salinity as driving factors.
Common Mistake: Students may confuse thermohaline circulation with surface wind-driven currents. Thermohaline circulation is specifically density-driven.
2. State two proxy indicators used to reconstruct past climate variability. [2]
Answer: Any two of the following:
- Ice cores (from ice sheets/glaciers)
- Ocean cores (sediment cores from the ocean floor)
- Tree rings (dendrochronology)
- Coral reefs (coral cores)
- Pollen records (palynology)
Marking Notes: 1 mark for each correct proxy indicator. Accept any two from the list above or other valid proxy indicators.
Common Mistake: Students may list direct measurements (e.g., thermometer records) which are not proxy indicators. Proxy indicators are indirect evidence from natural archives.
3. Explain how changes in solar output can influence Earth's temperature. [2]
Answer: Changes in solar output (the amount of energy emitted by the Sun) directly affect the amount of incoming solar radiation reaching Earth. When solar output increases, more energy reaches Earth's surface, leading to warming. When solar output decreases, less energy reaches Earth, leading to cooling. This is a natural factor that has contributed to past climate variability, particularly over longer timescales.
Marking Notes: 1 mark for identifying the link between solar output and incoming radiation; 1 mark for explaining the warming/cooling effect. Accept reference to the 11-year solar cycle or longer-term variations.
Common Mistake: Students may overstate the role of solar output in contemporary climate change. The evidence shows that solar variations alone cannot account for the rapid warming observed since the Industrial Revolution.
4. Identify one positive feedback mechanism that accelerates warming in the climate system. [1]
Answer: Any one of the following:
- Ice-albedo feedback: As ice melts, darker surfaces (land/ocean) are exposed, absorbing more solar radiation and causing further warming.
- Water vapour feedback: Warmer air holds more water vapour (a greenhouse gas), which traps more heat and causes further warming.
- Permafrost thaw feedback: Thawing permafrost releases methane and CO₂, which enhance the greenhouse effect and cause further warming.
Marking Notes: 1 mark for correctly identifying a positive feedback mechanism. The mechanism must be clearly described as self-reinforcing (amplifying the initial change).
Common Mistake: Students may confuse positive feedback (amplifying change) with negative feedback (dampening change). Ensure the answer describes a process that accelerates warming.
5. State the difference between an enhanced greenhouse effect and the natural greenhouse effect. [2]
Answer: The natural greenhouse effect is the process by which greenhouse gases (e.g., CO₂, water vapour, methane) in the atmosphere trap some of the outgoing longwave radiation from Earth's surface, keeping the planet warm enough to support life (approximately 33°C warmer than it would be otherwise). The enhanced greenhouse effect refers to the additional warming caused by human activities that have increased the concentration of greenhouse gases in the atmosphere since the Industrial Revolution, trapping more heat and leading to global warming.
Marking Notes: 1 mark for correctly describing the natural greenhouse effect; 1 mark for explaining how the enhanced greenhouse effect is an intensification of this process due to human activities.
Common Mistake: Students may describe the enhanced greenhouse effect as a completely different process rather than an intensification of the natural greenhouse effect.
6. Give two examples of human activities that reduce carbon sinks. [2]
Answer: Any two of the following:
- Deforestation (clearing forests reduces the amount of CO₂ absorbed by trees)
- Land-use change (converting forests to agriculture or urban areas reduces carbon storage)
- Degradation of peatlands (draining or burning peatlands releases stored carbon)
- Ocean acidification (reduces the ocean's ability to absorb CO₂)
- Soil degradation (reduces soil's capacity to store organic carbon)
Marking Notes: 1 mark for each correct example. The activity must clearly reduce the capacity of a carbon sink (something that absorbs more carbon than it releases).
Common Mistake: Students may list activities that increase emissions (e.g., burning fossil fuels) rather than activities that reduce sinks. The question specifically asks for activities that reduce carbon sinks.
7. Explain why the impacts of climate change are described as uneven across different regions. [2]
Answer: The impacts of climate change are uneven because different regions experience different types and magnitudes of change. For example, low-latitude regions (e.g., Sub-Saharan Africa, South Asia) are projected to experience more severe impacts such as reduced crop yields, increased water stress, and more extreme heat events, while high-latitude regions (e.g., Canada, Northern Europe) may experience milder impacts or even some benefits (e.g., longer growing seasons). Additionally, developing countries often have lower adaptive capacity, making them more vulnerable to the impacts they face.
Marking Notes: 1 mark for explaining that different regions experience different types/magnitudes of impacts; 1 mark for explaining that vulnerability varies due to differences in adaptive capacity. Accept specific examples.
Common Mistake: Students may simply state that impacts are uneven without explaining why or how they differ across regions.
8. What is the IPCC consensus regarding the primary cause of climate change over the last two centuries? [1]
Answer: The IPCC consensus is that climate change over the last two centuries is unequivocal and very likely caused by human activities (primarily the burning of fossil fuels and land-use change).
Marking Notes: 1 mark for correctly stating that the IPCC attributes recent climate change primarily to human activities. Accept "very likely caused by human activities" or similar wording.
Common Mistake: Students may say "climate change is happening" without attributing it to human activities. The question specifically asks for the IPCC's consensus on the cause.
9. State one possible impact of climate change on aquatic ecosystems. [1]
Answer: Any one of the following:
- Ocean acidification (reduced pH due to increased CO₂ absorption, harming shell-forming organisms)
- Coral bleaching (warmer water temperatures cause corals to expel symbiotic algae)
- Changes in species distribution (species moving to cooler waters)
- Reduced oxygen levels (warmer water holds less dissolved oxygen)
- Changes in freshwater ecosystems (altered flow regimes, increased water temperature)
Marking Notes: 1 mark for a correct and specific impact on aquatic ecosystems. The impact must be clearly linked to climate change.
Common Mistake: Students may give a general impact (e.g., "animals die") without specifying the mechanism or the type of ecosystem affected.
10. Explain how changes in ice sheets can influence global temperatures through feedback mechanisms. [1]
Answer: As ice sheets melt (due to warming), the exposed darker surfaces (land or ocean) absorb more solar radiation than the reflective ice, leading to further warming. This is the ice-albedo feedback, a positive feedback mechanism that amplifies the initial warming.
Marking Notes: 1 mark for correctly explaining the ice-albedo feedback. Accept a clear description of the feedback loop: warming → ice melt → reduced albedo → more absorption → further warming.
Common Mistake: Students may describe the feedback without explaining the mechanism (albedo change). The key is that melting ice reduces Earth's reflectivity, causing more heat absorption.
Section B: Data-Based Questions (20 marks)
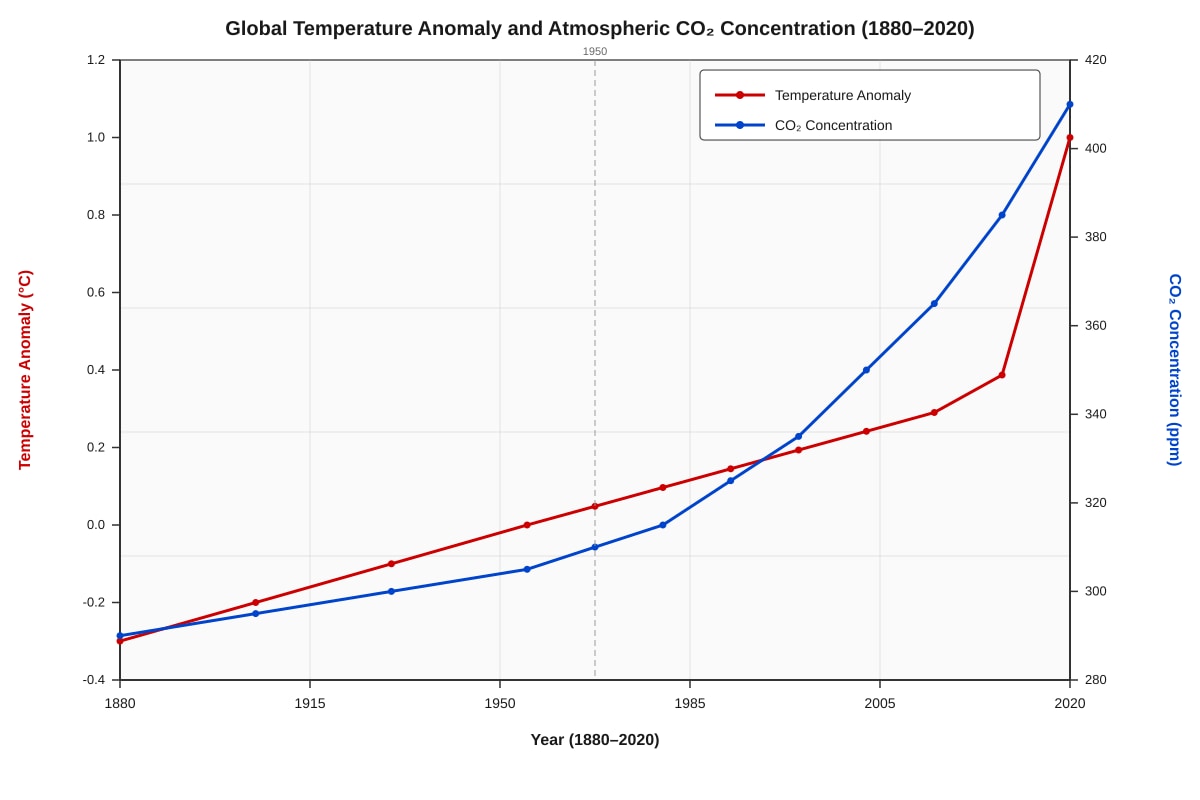
11. Using Resource 1, describe the relationship between global temperature anomaly and atmospheric CO₂ concentration from 1880 to 2020. [2]
Answer: Resource 1 shows a strong positive correlation between global temperature anomaly and atmospheric CO₂ concentration from 1880 to 2020. Both variables show a general upward trend over the period, with a particularly steep increase after 1950. As CO₂ concentration rises, the temperature anomaly also rises.
Marking Notes: 1 mark for identifying a positive correlation/relationship; 1 mark for describing the trend (both increasing, with acceleration after 1950). Accept reference to specific data points.
Common Mistake: Students may describe the relationship as "causation" rather than "correlation". While the two are linked, the question asks for a description of the relationship shown in the graph.
12. With reference to Resource 1, suggest one reason why the rate of increase in both variables accelerated after 1950. [2]
Answer: The acceleration after 1950 is likely due to the rapid increase in human activities, particularly the burning of fossil fuels (coal, oil, and natural gas) for industrialisation, transportation, and energy production. This period, known as the "Great Acceleration," saw a dramatic increase in CO₂ emissions, which led to a faster rise in atmospheric CO₂ concentration and consequently a faster rise in global temperatures.
Marking Notes: 1 mark for identifying the increase in human activities (e.g., fossil fuel burning, industrialisation); 1 mark for explaining the link to CO₂ emissions and temperature. Accept reference to the post-WWII economic boom.
Common Mistake: Students may give a vague answer (e.g., "more pollution") without specifying the mechanism or linking it to the data shown in the resource.
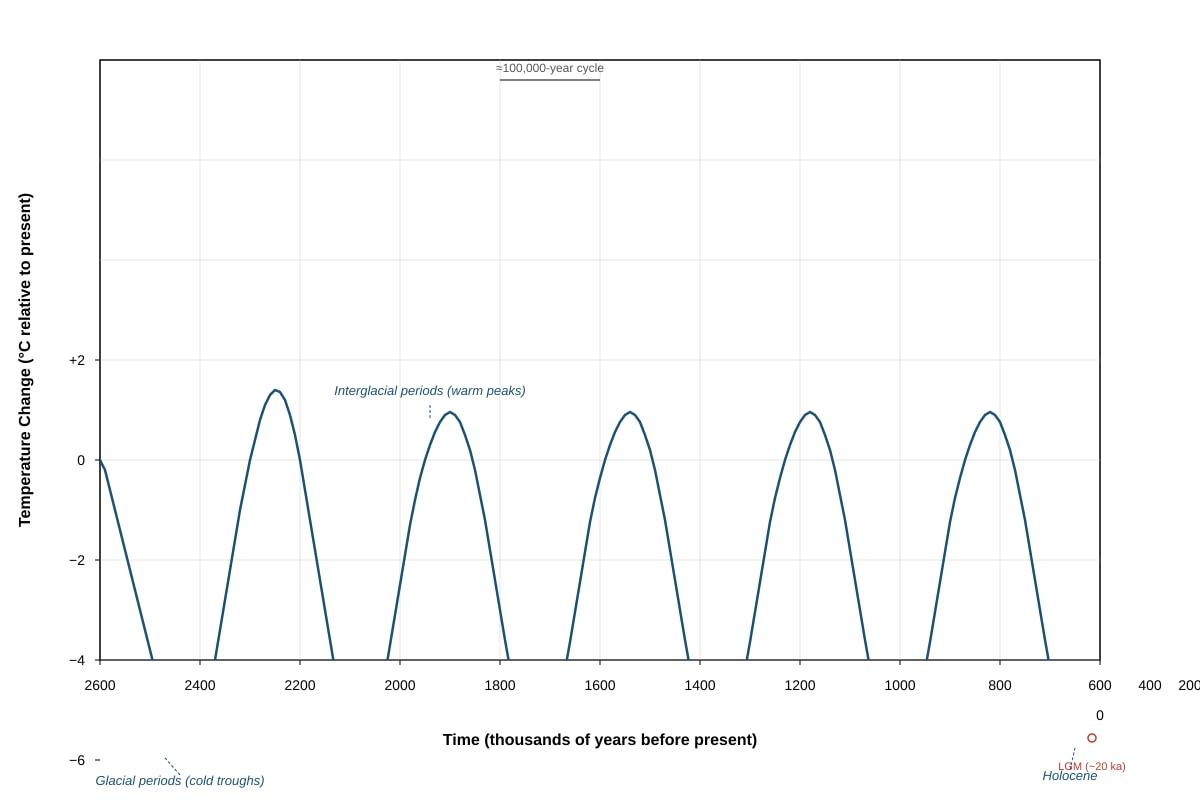
13. Using Resource 2, describe the pattern of temperature variability during the Quaternary period. [2]
Answer: Resource 2 shows that the Quaternary period is characterised by a cyclical pattern of glacial (cold) and interglacial (warm) periods. The temperature varies between approximately -6°C and +2°C relative to present. The cycles have a period of approximately 100,000 years in the last 800,000 years, with a sawtooth pattern (gradual cooling followed by rapid warming). The current warm period (Holocene) is the most recent interglacial.
Marking Notes: 1 mark for identifying the cyclical pattern of glacial-interglacial cycles; 1 mark for describing the sawtooth pattern or the approximate cycle length. Accept reference to specific features (e.g., last glacial maximum).
Common Mistake: Students may describe the pattern as "random" or "irregular" rather than cyclical. The Quaternary period shows a clear cyclical pattern, though the amplitude varies.
14. Explain how ice cores provide evidence of past climate variability. [3]
Answer: Ice cores are extracted from ice sheets (e.g., Antarctica, Greenland) and contain layers of ice that have accumulated over hundreds of thousands of years. Scientists analyse the isotopic composition of the ice (e.g., ratios of oxygen isotopes ¹⁸O/¹⁶O) to reconstruct past temperatures. Additionally, air bubbles trapped in the ice provide samples of the ancient atmosphere, allowing scientists to measure past concentrations of greenhouse gases (CO₂, CH₄). The layers also contain impurities (e.g., dust, volcanic ash) that provide information about past environmental conditions. By analysing these proxies, scientists can reconstruct climate variability over long timescales.
Marking Notes: 1 mark for explaining how ice cores are obtained and contain layered records; 1 mark for mentioning isotopic analysis (e.g., oxygen isotopes) for temperature reconstruction; 1 mark for mentioning air bubbles for greenhouse gas reconstruction or other proxies (dust, ash). Accept any three valid points.
Common Mistake: Students may simply say "ice cores show past climate" without explaining the specific methods (isotopes, air bubbles) used to extract climate information.
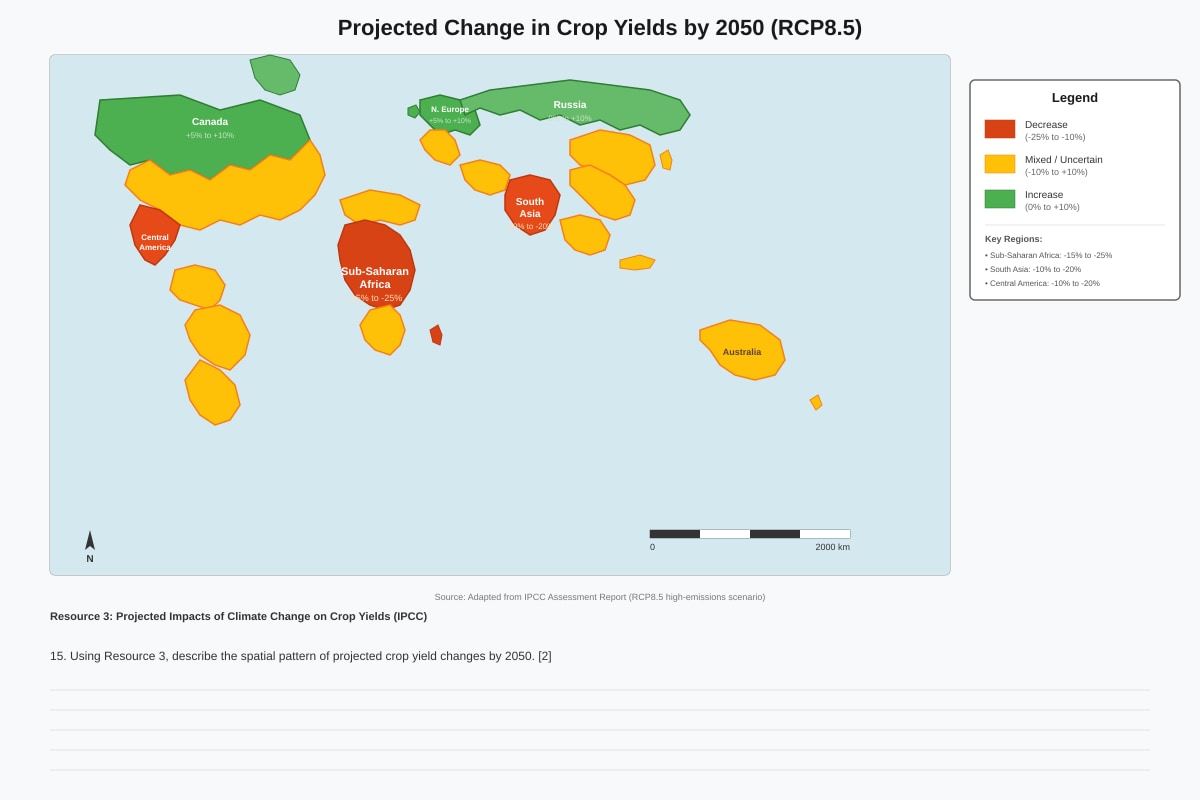
15. Using Resource 3, describe the spatial pattern of projected crop yield changes by 2050. [2]
Answer: Resource 3 shows a clear spatial pattern where tropical and subtropical regions (e.g., Sub-Saharan Africa, South Asia, Central America) are projected to experience significant decreases in crop yields (10–25%), while high-latitude regions (e.g., Canada, Northern Europe, Russia) are projected to experience slight increases (0–10%). Some regions (e.g., Australia, parts of South America) show mixed or uncertain changes.
Marking Notes: 1 mark for identifying the contrast between tropical (decrease) and high-latitude (increase) regions; 1 mark for providing specific examples or data from the resource. Accept reference to the latitudinal pattern.
Common Mistake: Students may describe the pattern without using specific data from the resource. The question asks to use the resource, so specific percentages or regional examples should be included.
16. Suggest one reason why high-latitude regions may experience increased crop yields under climate change. [2]
Answer: High-latitude regions may experience increased crop yields because warmer temperatures can extend the growing season, allowing for a longer period for crop growth and maturation. Additionally, warmer temperatures may allow the cultivation of crops that were previously not viable in these colder regions. CO₂ fertilisation (increased CO₂ levels enhancing photosynthesis) may also contribute to higher yields in some crops.
Marking Notes: 1 mark for identifying a plausible reason (e.g., longer growing season, new crop varieties); 1 mark for explaining the mechanism. Accept reference to CO₂ fertilisation or reduced frost risk.
Common Mistake: Students may suggest that all regions will benefit from warming, ignoring the negative impacts in tropical regions. The question specifically asks about high-latitude regions.
17. Using Resource 4, explain two ways in which flooding can affect human activity in a coastal city. [4]
Answer: Any two of the following, with explanation:
(1) Economic impacts: Flooding can damage buildings, infrastructure (roads, bridges, power lines), and businesses, leading to significant economic losses. Disruption to transport networks can halt the movement of goods and people, affecting supply chains and daily economic activity.
(2) Social impacts: Flooding can displace residents from their homes, leading to temporary or permanent relocation. It can also disrupt access to essential services such as healthcare and education, and in severe cases, lead to loss of life.
(3) Environmental impacts: Flooding can contaminate water supplies with sewage and pollutants, leading to health risks. It can also cause coastal erosion and damage to ecosystems, affecting livelihoods that depend on these resources.
Marking Notes: 2 marks for each well-explained impact (1 mark for identifying the impact, 1 mark for explaining how it affects human activity). Accept any two impacts from the resource or other valid impacts.
Common Mistake: Students may list impacts without explaining how they affect human activity. The question asks for an explanation, so the mechanism should be clear.
18. Explain how tropical cyclones can lead to river flooding. [3]
Answer: Tropical cyclones can lead to river flooding through several mechanisms. First, the intense and prolonged rainfall associated with tropical cyclones can exceed the capacity of the ground to absorb water, leading to surface runoff that quickly enters rivers. Second, the storm surge (a rise in sea level caused by the cyclone's low pressure and strong winds) can block the normal discharge of rivers into the sea, causing water to back up and flood upstream areas. Third, saturated ground from the initial rainfall reduces infiltration capacity, increasing the volume and speed of runoff entering rivers.
Marking Notes: 1 mark for each valid mechanism (up to 3 marks). Accept: heavy rainfall exceeding infiltration capacity, storm surge blocking river discharge, saturated ground reducing infiltration, or other valid mechanisms.
Common Mistake: Students may focus only on coastal flooding from storm surge and ignore the river flooding component. The question specifically asks about river flooding.
Section C: Essay Question (15 marks)
19. 'Human activities are the dominant cause of contemporary climate change.' Discuss this statement with reference to the enhanced greenhouse effect and feedback mechanisms. [15]
Answer:
Marking Scheme (Generic Level Descriptors):
| Level | Marks | Descriptor |
|---|---|---|
| 4 | 13–15 | Excellent: Comprehensive knowledge, analytical evaluation, well-supported with evidence and examples, coherent structure |
| 3 | 9–12 | Good: Sound knowledge, some evaluation, relevant examples, clear structure |
| 2 | 5–8 | Adequate: Basic knowledge, limited evaluation, some examples, structure present |
| 1 | 1–4 | Weak: Limited knowledge, no evaluation, few or no examples, poor structure |
| 0 | 0 | No relevant content |
Expected Content Points:
Introduction:
- Define contemporary climate change (warming since the Industrial Revolution)
- State the IPCC consensus: human activities are "very likely" (>95% probability) the dominant cause
- Outline the structure of the essay
Arguments supporting the statement (human activities as dominant cause):
-
Enhanced greenhouse effect:
- Human activities (burning fossil fuels, deforestation, agriculture) have increased atmospheric concentrations of greenhouse gases (CO₂, CH₄, N₂O)
- CO₂ concentration has risen from ~280 ppm (pre-industrial) to ~410 ppm (2020)
- This enhances the natural greenhouse effect, trapping more outgoing longwave radiation and causing warming
- The rate of warming (0.2°C per decade) is unprecedented in the context of past climate variability
-
Human activities and the global carbon cycle:
- Activities that increase emissions: fossil fuel combustion, industrial processes, agriculture
- Activities that reduce sinks: deforestation, land-use change, soil degradation
- Net effect: significant imbalance in the carbon cycle, with more CO₂ entering the atmosphere than being removed
-
Positive feedback mechanisms amplifying human-induced warming:
- Ice-albedo feedback: warming melts ice → darker surfaces exposed → more absorption → further warming
- Water vapour feedback: warmer air holds more water vapour (a greenhouse gas) → more trapping of heat → further warming
- Permafrost thaw: releases methane and CO₂ → enhanced greenhouse effect → further warming
- These feedbacks amplify the initial human-induced warming, but the initial trigger is human activity
Counter-arguments (natural factors):
-
Natural factors alone cannot account for contemporary warming:
- Solar output: has remained relatively constant or shown slight decline since 1970, cannot explain the rapid warming
- Volcanic eruptions: can cause short-term cooling (e.g., Mount Pinatubo 1991), but not the long-term warming trend
- Orbital forcing (Milankovitch cycles): operates on timescales of tens of thousands of years, cannot explain the rapid warming of the last 150 years
- Thermohaline circulation changes: can cause regional climate shifts but not the global warming trend
-
Attribution studies:
- Climate models that include only natural factors cannot reproduce the observed warming
- Models that include both natural and anthropogenic factors successfully reproduce the observed warming
- This demonstrates that human activities are the dominant cause
Conclusion:
- While natural factors have influenced past climate variability, the overwhelming evidence shows that human activities are the dominant cause of contemporary climate change
- The enhanced greenhouse effect, driven by human emissions, is the primary mechanism
- Positive feedbacks amplify the warming, but the initial trigger is human activity
- The IPCC consensus is clear: human activities are "very likely" the dominant cause
Marking Notes: Award marks based on the level descriptors. Look for: knowledge of the enhanced greenhouse effect and feedback mechanisms, use of evidence (IPCC, CO₂ data, attribution studies), evaluation of natural vs. human factors, and a clear, well-structured argument.
Common Mistakes:
- Describing climate change without addressing the "dominant cause" aspect
- Failing to evaluate the role of natural factors
- Providing no specific evidence or examples
- Ignoring feedback mechanisms (explicitly mentioned in the question)
- Writing a one-sided argument without acknowledging counter-arguments
Section D: Fieldwork Application Question (10 marks)
20. A group of students is investigating the impact of different land uses on infiltration rates in a local urban area. They have selected three sites: a grass park, a car park, and a construction site.
(a) Suggest one appropriate data collection method for measuring infiltration rates at each site. [2]
Answer:
-
Grass park: Use a double-ring infiltrometer. This device consists of two concentric rings inserted into the ground. Water is poured into both rings, and the rate at which water infiltrates the soil in the inner ring is measured over time. The outer ring prevents lateral flow of water, ensuring vertical infiltration.
-
Car park: Infiltration cannot be measured directly on the impermeable surface. Instead, students could measure the volume and rate of surface runoff from a known area during a simulated rainfall event, or they could use a percolation test on any permeable surfaces (e.g., cracks, gravel areas) adjacent to the car park.
-
Construction site: Use a single-ring infiltrometer or a double-ring infiltrometer, similar to the grass park method. The soil at a construction site is often compacted, so the infiltration rate may be lower. Students should take multiple measurements to account for variability.
Marking Notes: 1 mark for suggesting an appropriate method for each site (accept any valid method); 1 mark for providing a brief explanation of how the method works. Accept alternative methods (e.g., using a soil moisture sensor, measuring runoff from a plot).
Common Mistake: Students may suggest the same method for all sites without considering the different surface types. The car park is impermeable, so a different approach is needed.
(b) Explain one risk that students might encounter during this investigation and suggest how it could be mitigated. [2]
Answer:
Risk: Students may encounter uneven or unstable ground at the construction site, which could lead to trips, slips, or falls. Construction sites may also have sharp objects (e.g., nails, broken glass) or heavy machinery operating nearby.
Mitigation: Students should conduct a risk assessment before the investigation, wear appropriate personal protective equipment (e.g., sturdy closed-toe shoes, gloves, hard hat if required), and ensure they have permission to access the site. They should work in pairs or groups and have a first aid kit available. The teacher should supervise the activity.
Alternative risk: Weather-related risks (e.g., heatstroke from working in the sun, lightning during a storm). Mitigation: check weather forecast, bring water and sun protection, postpone if severe weather is forecast.
Marking Notes: 1 mark for identifying a specific risk; 1 mark for suggesting an appropriate mitigation strategy. Accept any valid risk related to the investigation.
Common Mistake: Students may give a vague risk (e.g., "getting hurt") without specifying the hazard or the context. The risk should be specific to the investigation sites.
(c) Evaluate the usefulness of this investigation in understanding the hydrological impacts of urbanisation. [6]
Answer:
Marking Scheme (Generic Level Descriptors):
| Level | Marks | Descriptor |
|---|---|---|
| 3 | 5–6 | Excellent: Comprehensive evaluation, clear judgment, well-supported with evidence, coherent |
| 2 | 3–4 | Good: Sound evaluation, some judgment, relevant points, clear structure |
| 1 | 1–2 | Weak: Limited evaluation, no clear judgment, few relevant points |
| 0 | 0 | No relevant content |
Expected Content Points:
Usefulness of the investigation:
-
Direct relevance: The investigation directly measures infiltration rates, which is a key hydrological process affected by urbanisation. Urbanisation replaces permeable surfaces (e.g., grass, soil) with impermeable surfaces (e.g., concrete, asphalt), reducing infiltration and increasing surface runoff.
-
Comparative approach: By comparing three different land uses (grass park, car park, construction site), the investigation can demonstrate how different types of urban surfaces affect infiltration. This allows students to draw conclusions about the hydrological impacts of urbanisation.
-
Quantitative data: The investigation produces quantitative data (infiltration rates in mm/hour) that can be compared across sites and used to calculate runoff coefficients or other hydrological parameters.
-
Real-world application: The findings can be used to understand urban flooding risks, the effectiveness of green infrastructure (e.g., rain gardens, permeable pavements), and the importance of preserving permeable surfaces in urban areas.
Limitations of the investigation:
-
Limited spatial scale: The investigation only covers three small sites, which may not be representative of the wider urban area. Infiltration rates can vary significantly even within a small area due to soil type, compaction, and vegetation cover.
-
Temporal limitations: The investigation is likely a one-time measurement, which does not capture seasonal variations in infiltration rates (e.g., due to soil moisture, temperature, or vegetation growth).
-
Simplified methodology: The use of a simple infiltrometer may not accurately represent natural infiltration processes, which are influenced by factors such as antecedent soil moisture, macropores, and preferential flow paths.
-
Missing variables: The investigation focuses only on infiltration and does not measure other important hydrological processes such as evapotranspiration, groundwater recharge, or surface runoff volumes.
Overall judgment:
- The investigation is useful for providing a basic understanding of how urbanisation affects infiltration rates, but it has limitations in terms of spatial and temporal representativeness.
- To improve the investigation, students could increase the number of sites, take repeated measurements over time, and measure additional variables (e.g., soil moisture, slope, vegetation cover).
- Overall, the investigation is a valuable learning exercise that demonstrates the hydrological impacts of urbanisation, but the findings should be interpreted with caution due to the limitations.
Marking Notes: Award marks based on the level descriptors. Look for: identification of strengths and limitations, a clear overall judgment, and use of specific examples from the investigation. Accept any valid points.
Common Mistake: Students may describe the investigation without evaluating it. The question asks for an evaluation, which requires a judgment of usefulness with supporting reasons.
END OF ANSWER KEY