From Real Exams Quiz
A Level H1 Geography Fieldwork Quiz
Free A Level H1 Geography Fieldwork quiz, LongCat Exam version, with questions, answers, and A Level-style practice for Singapore students.
These static practice materials are generated from the site's syllabus and paper-generation workflow, with source and model context shown so students and parents can evaluate the material before use.
Questions
A-Level Geography H1 Quiz - Fieldwork
Name: ___________________________
Class: ___________________________
Date: ___________________________
Score: _________ / 40
Duration: 60 minutes
Total Marks: 40
Instructions
- Answer ALL questions in the spaces provided.
- The number of marks for each question is shown in brackets [ ].
- Where data or source references are mentioned, use the information provided to support your answers.
- For questions requiring explanation or analysis, write in complete sentences with appropriate geographical terminology.
- Quality of written communication will be assessed in extended response questions.
Section A: Understanding Fieldwork Design (Questions 1–8)
Answer ALL questions. [24 marks]
1. Define the term sampling strategy in the context of geographical fieldwork. [2]
2. A student is investigating changes in vegetation cover along a transect from a river channel into a woodland. State and briefly explain two reasons why systematic sampling would be more appropriate than random sampling for this investigation. [4]
(a) _________________________________________________________________________
(b) _________________________________________________________________________
3. Identify two risks a student might encounter when carrying out fieldwork at a coastal site, and suggest one precaution for each risk. [4]
| Risk | Precaution |
|---|---|
| (i) | |
| (ii) |
4. Explain why a pilot study is important before conducting a full fieldwork investigation. [3]
5. A group of students collected soil moisture content at 10 points along a 50-metre transect. Their results are shown below:
| Distance from start (m) | 0 | 5 | 10 | 15 | 20 | 25 | 30 | 35 | 40 | 45 | 50 |
|---|---|---|---|---|---|---|---|---|---|---|---|
| Soil moisture (%) | 12 | 14 | 18 | 22 | 28 | 35 | 42 | 38 | 30 | 24 | 20 |
(a) Describe the overall trend in soil moisture content along the transect. [2]
(b) Suggest one geographical reason for the pattern observed between 25 m and 35 m. [2]
6. Distinguish between primary data and secondary data, giving one example of each that could be used in a fieldwork study on urban environmental quality. [3]
7. A student used a Likert scale questionnaire to assess residents' perceptions of flood risk in a housing estate. State one advantage and one disadvantage of using this method. [2]
Advantage: __________________________________________________________________
Disadvantage: ______________________________________________________________
8. Explain why it is important to establish a clear hypothesis or research question before beginning fieldwork. [2]
Section B: Data Collection Methods and Techniques (Questions 9–14)
Answer ALL questions. [16 marks]
9.
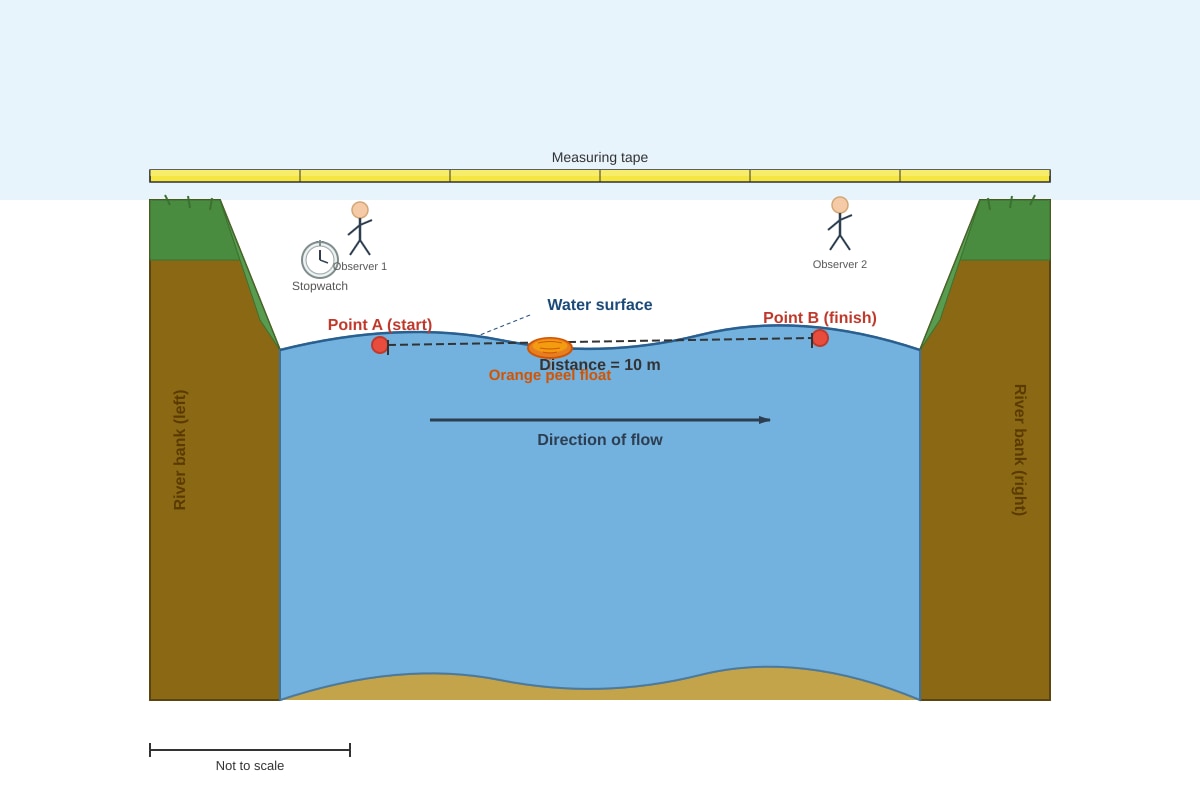
Generated diagram for Q9.
(a) Name the method of measuring river velocity shown in the diagram above. [1]
(b) The student recorded the time for the float to travel from Point A to Point B as 25 seconds. Calculate the surface velocity of the river in metres per second. Show your working. [2]
(c) Explain one limitation of this method for measuring river velocity accurately. [2]
10. A student measured the gradient of a slope using a clinometer at five positions along a hillside. The results were:
| Position | A | B | C | D | E |
|---|---|---|---|---|---|
| Angle of slope (°) | 5 | 12 | 18 | 14 | 8 |
(a) At which position is the slope steepest? [1]
(b) Suggest one reason why the slope angle varies between positions B and D. [2]
11. Describe how you would use a quadrat to measure the percentage ground cover of vegetation in a grassland ecosystem. In your answer, include reference to sample size, placement, and how you would record your results. [4]
12. A student is investigating the impact of footpath erosion on soil depth at different distances from a popular walking trail in a national park. Identify the independent variable and the dependent variable in this investigation. [2]
Independent variable: ________________________________________________________
Dependent variable: __________________________________________________________
13. State two ways in which the reliability of fieldwork data can be improved. [2]
(i) _________________________________________________________________________
(ii) ________________________________________________________________________
14. Explain why a student might choose to use a data logger rather than a manual thermometer when measuring temperature changes in an urban heat island study. [2]
Section C: Data Presentation, Analysis, and Evaluation (Questions 15–20)
Answer ALL questions. [20 marks]
15.
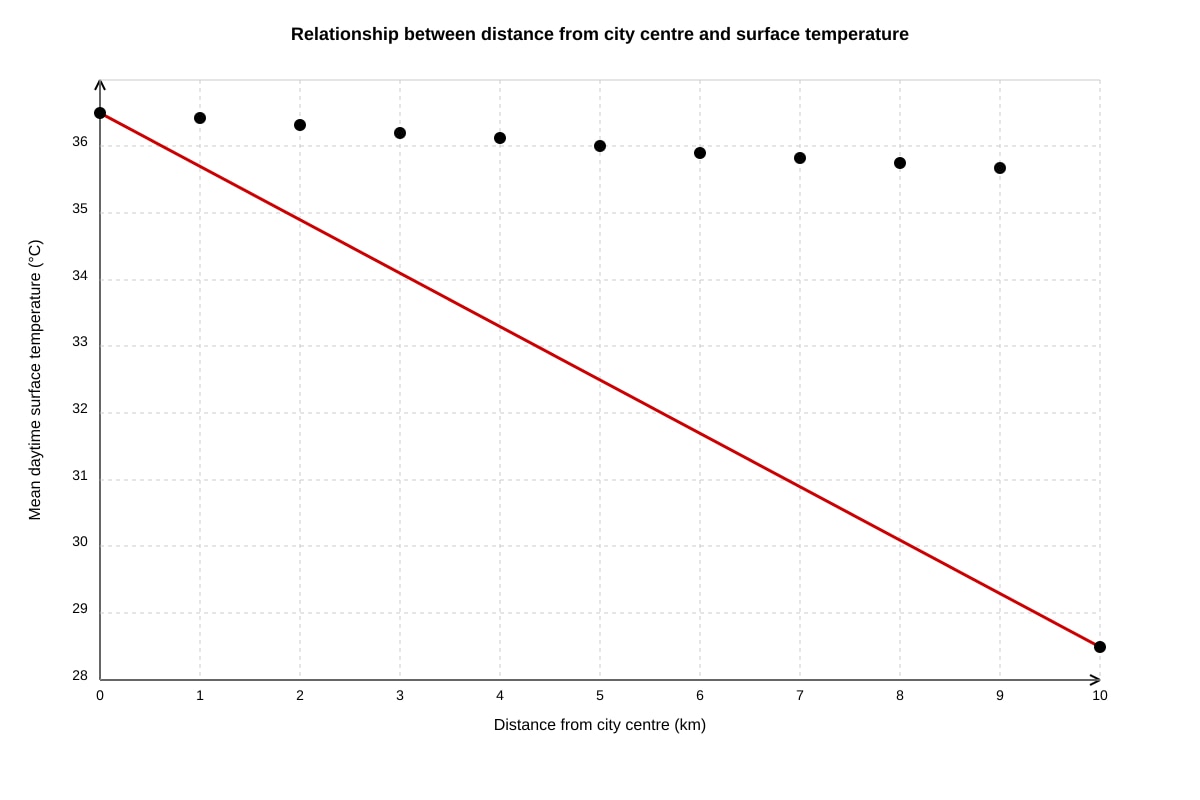
Generated graph for Q15.
(a) Describe the relationship between distance from the city centre and mean daytime surface temperature shown in the graph. [2]
(b) Using your knowledge of urban geography, explain the relationship shown. [3]
16. A student conducted a Spearman's rank correlation test on their fieldwork data comparing pedestrian count and the number of shops in 8 streets. The calculated rs value was +0.89.
(a) Describe the strength and direction of the correlation. [2]
(b) The critical value at the 0.05 significance level for 8 pairs is 0.738. State whether the result is statistically significant and explain what this means in the context of the student's investigation. [2]
17. A student investigated whether there is a difference in vegetation species diversity between a managed park and an unmanaged woodland. They used the Simpson's Diversity Index and obtained the following results:
| Site | Simpson's Diversity Index (D) |
|---|---|
| Managed park | 0.42 |
| Unmanaged woodland | 0.87 |
(a) Which site has greater species diversity? Explain your answer with reference to the Simpson's Diversity Index. [2]
(b) Suggest two geographical reasons for the difference in diversity between the two sites. [2]
(i) _________________________________________________________________________
(ii) ________________________________________________________________________
18. Evaluate the usefulness of using annotated photographs as a method of data collection in a fieldwork study on coastal landforms. In your answer, consider both strengths and limitations. [4]
19. A student's fieldwork conclusion stated: "The hypothesis that sediment size decreases downstream is fully supported by the data collected." However, the student only sampled sediment at three locations along the river. Assess the extent to which the student's conclusion is justified. [3]
20. A student investigated the effect of land use on surface runoff in an urban area. They collected data from three sites: a car park, a playing field, and a wooded area. After analysing their data, the student found that the car park had the highest surface runoff and the wooded area had the lowest.
Explain how two of the following factors account for these differences: infiltration rate, vegetation cover, soil compaction, and impermeable surfaces. [4]
Factor 1: ___________________________________________________________________
Factor 2: ___________________________________________________________________
Answers
A-Level Geography H1 Quiz - Fieldwork: Answer Key
Section A: Understanding Fieldwork Design (Questions 1–8)
1. Define the term sampling strategy in the context of geographical fieldwork. [2]
Answer: A sampling strategy is the planned method or approach used to select a subset of observations, measurements, or respondents from a larger population or area, in order to collect data that is representative of the whole while being practical and manageable within the constraints of time and resources.
Marking: 2 marks for a clear, complete definition that includes the idea of selecting a subset for representativeness. 1 mark for a partial definition (e.g., only mentions "choosing where to collect data" without reference to representativeness or the larger population).
2. A student is investigating changes in vegetation cover along a transect from a river channel into a woodland. State and briefly explain two reasons why systematic sampling would be more appropriate than random sampling for this investigation. [4]
Answer:
(a) Systematic sampling ensures that samples are taken at regular, evenly spaced intervals along the transect, which means the full gradient from the river to the woodland is captured. This is important because the investigation is specifically about how vegetation changes along a spatial gradient, so even coverage is essential. [2]
(b) Systematic sampling is simpler and quicker to implement in the field because the student only needs to decide on a fixed interval (e.g., every 5 metres) and then follow it, rather than using random number generators or tables to select points. This reduces the chance of human bias in choosing "interesting" spots and makes the method more replicable. [2]
Marking: 1 mark for each valid reason stated + 1 mark for each explanation linked to the context of a transect study. Answers must relate to the spatial/gradient nature of the investigation to gain full marks.
3. Identify two risks a student might encounter when carrying out fieldwork at a coastal site, and suggest one precaution for each risk. [4]
Answer:
| Risk | Precaution |
|---|---|
| (i) Slipping on wet rocks or uneven surfaces, leading to injury | Wear sturdy, grippy footwear and avoid climbing on wet or unstable rocks |
| (ii) Being caught by rising tides or sudden wave surges | Check tide timetables before the visit, work on the shore at low tide, and maintain a safe distance from the water's edge |
Other acceptable risks: Sunburn/heatstroke (wear sunscreen, hat, stay hydrated); falling debris from cliffs (stay away from the base of cliffs, wear hard hats); strong winds affecting equipment (secure equipment, use windbreaks).
Marking: 1 mark for each correctly identified risk + 1 mark for each appropriate, practical precaution. Risks must be specific to a coastal environment. Generic risks (e.g., "getting tired") are not acceptable.
4. Explain why a pilot study is important before conducting a full fieldwork investigation. [3]
Answer: A pilot study is a small-scale trial run of the planned fieldwork. It is important because it allows the student to test whether their data collection methods and equipment work effectively in the actual field conditions. For example, the student can check whether a questionnaire is clearly worded and not too time-consuming, or whether a sampling interval is practical. The pilot study also helps identify any unforeseen risks or logistical problems, so that the main investigation can be refined and improved before full data collection begins. This increases the validity and reliability of the final results.
Marking: 1 mark for defining what a pilot study is. 1 mark for explaining that it tests methods/equipment in real conditions. 1 mark for explaining that it allows refinement/improvement of the investigation, thereby improving data quality.
5. (a) Describe the overall trend in soil moisture content along the transect. [2]
Answer: Soil moisture content generally increases from the start of the transect (12% at 0 m) to a peak at 30 m (42%), before decreasing towards the end of the transect (20% at 50 m). The highest soil moisture is recorded at 30 m from the start.
Marking: 1 mark for identifying the general increase then decrease (or describing the pattern). 1 mark for referencing specific data values from the table.
(b) Suggest one geographical reason for the pattern observed between 25 m and 35 m. [2]
Answer: The peak in soil moisture at 30 m may correspond to the point closest to the river channel or a zone of groundwater seepage, where the water table is near the surface, keeping the soil saturated. The subsequent decrease at 35 m could reflect the land rising slightly above the water table, allowing better drainage and reducing soil moisture.
Marking: 1 mark for a plausible geographical reason (e.g., proximity to water table, seepage, topography). 1 mark for linking the explanation to the specific data pattern between 25 m and 35 m.
6. Distinguish between primary data and secondary data, giving one example of each that could be used in a fieldwork study on urban environmental quality. [3]
Answer: Primary data is information collected firsthand by the researcher specifically for their investigation, for example, measuring noise levels at different locations in a city using a decibel meter. Secondary data is information that has already been collected by someone else for a different purpose, for example, using published air quality index data from the National Environment Agency to compare pollution levels across different urban areas.
Marking: 1 mark for a correct definition of primary data. 1 mark for a correct definition of secondary data. 1 mark for a relevant, appropriate example linked to urban environmental quality for either type.
7. A student used a Likert scale questionnaire to assess residents' perceptions of flood risk in a housing estate. State one advantage and one disadvantage of using this method. [2]
Answer:
Advantage: Likert scale questionnaires allow responses to be quantified (e.g., on a scale of 1–5), making it easier to compare and statistically analyse the data from many respondents. [1]
Disadvantage: Respondents may tend to choose middle values (central tendency bias) or may not fully express the complexity of their opinions, as the fixed scale limits the depth of response. [1]
Other acceptable answers: Advantage — quick to administer to many people; standardised format. Disadvantage — social desirability bias; respondents may not understand the questions; low response rate.
8. Explain why it is important to establish a clear hypothesis or research question before beginning fieldwork. [2]
Answer: A clear hypothesis or research question provides focus and direction for the entire investigation. It determines what data needs to be collected, which methods are appropriate, and how the data should be analysed. Without a clear hypothesis, the student may collect irrelevant or insufficient data, making it difficult to draw meaningful conclusions.
Marking: 1 mark for stating that it provides focus/direction. 1 mark for explaining that it determines the data collection methods or analytical approach.
Section B: Data Collection Methods and Techniques (Questions 9–14)
9. (a) Name the method of measuring river velocity shown in the diagram. [1]
Answer: Float method (or surface float method). [1]
(b) Calculate the surface velocity of the river. [2]
Answer:
Velocity=TimeDistance=25 s10 m=0.4 m/s
Marking: 1 mark for correct formula. 1 mark for correct answer with units (0.4 m/s).
(c) Explain one limitation of this method. [2]
Answer: The float method only measures surface velocity, not the average velocity throughout the water column. In a river, water at the surface typically moves faster than water near the bed due to friction, so the calculated velocity will overestimate the mean velocity of the river. [2]
Other acceptable answers: Wind can affect the movement of the float, making the measurement inaccurate; the float may get caught in eddies or obstacles; it is difficult to time accurately over long distances; it does not work well in very shallow or very slow-moving water.
Marking: 1 mark for identifying a valid limitation. 1 mark for explaining why it is a limitation.
10. (a) At which position is the slope steepest? [1]
Answer: Position C (18°). [1]
(b) Suggest one reason why the slope angle varies between positions B and D. [2]
Answer: The variation in slope angle could be due to differences in the underlying geology — for example, if the rock at position B is more resistant to erosion than at position D, the slope at B may be steeper where harder rock outcrops, while at D, softer material has been eroded to create a gentler angle. Alternatively, position D may be a zone of deposition or a break of slope where material has accumulated, reducing the angle.
Marking: 1 mark for a valid reason. 1 mark for linking it to the specific positions or explaining the mechanism.
11. Describe how you would use a quadrat to measure the percentage ground cover of vegetation in a grassland ecosystem. [4]
Answer:
First, I would decide on an appropriate quadrat size (e.g., 1 m × 1 m) suitable for the grassland vegetation. To ensure the results are representative, I would use a sufficiently large sample size — for example, placing the quadrat at 20 or more positions. The quadrats would be placed using a systematic or random sampling strategy: for instance, by walking along a transect line and placing the quadrat at regular intervals (e.g., every 5 metres), or by using random number coordinates within the study area. At each placement, I would estimate the percentage of the quadrat area covered by vegetation (as opposed to bare ground), either by eye or using a gridded quadrat divided into 100 squares for greater accuracy. I would record each percentage estimate in a results table, and later calculate the mean percentage cover across all quadrats to summarise the findings.
Marking: 1 mark for appropriate quadrat size. 1 mark for sample size and sampling strategy (systematic or random). 1 mark for method of estimating percentage cover. 1 mark for recording results and calculating a mean.
12. Identify the independent and dependent variables. [2]
Answer:
Independent variable: Distance from the walking trail. [1]
Dependent variable: Soil depth. [1]
Note: The independent variable is what the student deliberately changes or selects; the dependent variable is what is measured in response.
13. State two ways in which the reliability of fieldwork data can be improved. [2]
Answer:
(i) Repeat measurements at each sample point and calculate a mean, to reduce the effect of anomalous readings. [1]
(ii) Increase the sample size (e.g., more sample points or more respondents) to ensure the data is more representative of the whole population or area. [1]
Other acceptable answers: Use standardised methods/equipment; calibrate equipment before use; train all group members to collect data consistently; conduct a pilot study.
14. Explain why a student might choose to use a data logger rather than a manual thermometer. [2]
Answer: A data logger can record temperature automatically at set time intervals (e.g., every minute) over an extended period, providing a continuous and detailed dataset. This is particularly useful in an urban heat island study because temperature varies throughout the day, and a manual thermometer would only provide a snapshot at the moment the student reads it. The data logger also reduces human error in reading and recording values.
Marking: 1 mark for identifying that data loggers record continuously/automatically. 1 mark for linking this advantage to the specific context of temperature variation in an urban heat island study.
Section C: Data Presentation, Analysis, and Evaluation (Questions 15–20)
15. (a) Describe the relationship between distance from the city centre and mean daytime surface temperature. [2]
Answer: There is a negative correlation between distance from the city centre and mean daytime surface temperature. As distance from the city centre increases, the mean daytime surface temperature decreases. Temperatures range from approximately 35 °C in the city centre to approximately 29 °C at 10 km from the centre. [2]
Marking: 1 mark for identifying the negative correlation/inverse relationship. 1 mark for referencing specific data values from the graph.
(b) Explain the relationship shown. [3]
Answer: The urban heat island effect explains this pattern. In the city centre, there is a high density of buildings, roads, and other impermeable surfaces that absorb and re-radiate solar energy, raising surface temperatures. There is also less vegetation in the city centre, meaning less evapotranspiration and less cooling. Additionally, human activities (vehicles, air conditioning units, industry) release waste heat. As distance from the city centre increases, there is typically more green space, fewer buildings, and greater vegetation cover, which cools the surface through evapotranspiration and shading, resulting in lower temperatures.
Marking: 1 mark for identifying the urban heat island effect. 1 mark for explaining the role of impermeable surfaces/buildings/anthropogenic heat. 1 mark for explaining the cooling effect of vegetation/evapotranspiration in areas further from the centre.
16. (a) Describe the strength and direction of the correlation. [2]
Answer: The rs value of +0.89 indicates a strong positive correlation. This means that as the pedestrian count increases, the number of shops also tends to increase. [2]
Marking: 1 mark for "strong" and 1 mark for "positive" (or correct description of direction).
(b) State whether the result is statistically significant and explain what this means. [2]
Answer: The calculated rs value of +0.89 is greater than the critical value of 0.738 at the 0.05 significance level, which means the result is statistically significant. This indicates that there is less than a 5% probability that the observed correlation occurred by chance, so the student can be confident that a genuine relationship exists between pedestrian count and the number of shops in the study area. [2]
Marking: 1 mark for stating that the result is significant (because 0.89 > 0.738). 1 mark for explaining the meaning in context (less than 5% probability of occurring by chance / genuine relationship exists).
17. (a) Which site has greater species diversity? Explain. [2]
Answer: The unmanaged woodland has greater species diversity. The Simpson's Diversity Index ranges from 0 to 1, where values closer to 1 indicate higher diversity. The unmanaged woodland has a value of 0.87, which is much closer to 1 than the managed park's value of 0.42, indicating significantly greater species diversity. [2]
Marking: 1 mark for identifying the unmanaged woodland. 1 mark for explaining with reference to the index values and what they mean.
(b) Suggest two geographical reasons for the difference in diversity. [2]
(i) The managed park is regularly mowed and maintained, which prevents many plant species from establishing and reduces habitat variety, lowering species diversity. [1]
(ii) The unmanaged woodland has a more complex structure (e.g., canopy layers, dead wood, leaf litter) that provides a wider range of ecological niches, supporting a greater variety of species. [1]
Other acceptable answers: Use of herbicides/pesticides in the managed park; greater soil disturbance in the managed park; natural succession in the woodland; less human interference in the woodland.
18. Evaluate the usefulness of annotated photographs as a method of data collection in a fieldwork study on coastal landforms. [4]
Answer:
Strengths: Annotated photographs provide a permanent, visual record of coastal landforms at the time of the visit, which can be analysed in detail after the fieldwork. They capture the spatial characteristics and scale of features (e.g., wave-cut platforms, stacks, arches) that may be difficult to convey through written descriptions alone. Annotations can label specific features, processes, and evidence of erosion or deposition, making the data highly useful for analysis and comparison with theoretical models. Photographs are also quick to take, allowing many sites to be recorded efficiently.
Limitations: Photographs only capture a single moment in time and do not show processes occurring (e.g., wave action, longshore drift). They are subjective — the photographer chooses what to photograph and what to annotate, which may introduce bias. Two-dimensional photographs may not accurately convey the scale or three-dimensional nature of landforms without additional measurements. Weather conditions (e.g., poor lighting, rain) can also reduce the quality and usefulness of photographs.
Marking: 1 mark for each well-developed strength (max 2). 1 mark for each well-developed limitation (max 2). Answers must be in the context of coastal landforms to gain full marks.
19. Assess the extent to which the student's conclusion is justified. [3]
Answer: The student's conclusion is not fully justified. While the data from three locations may show a downstream decrease in sediment size, three sample points is a very small sample size and may not be representative of the entire river. The pattern could be influenced by local factors such as tributary inputs, variations in channel gradient, or human interference (e.g., dams or construction), which could cause anomalies. To make a more robust conclusion, the student would need to sample at more locations along the river and consider whether the trend is consistent across the entire course. The use of the word "fully" is particularly problematic, as it implies certainty that cannot be supported by such limited data.
Marking: 1 mark for stating that the conclusion is not fully justified. 1 mark for explaining the issue of small sample size. 1 mark for suggesting additional factors that could affect the pattern or for critiquing the certainty of the conclusion.
20. Explain how two factors account for the differences in surface runoff between the car park and the wooded area. [4]
Factor 1: Impermeable surfaces [2]
The car park is covered with tarmac or concrete, which is impermeable, meaning rainfall cannot infiltrate into the ground. Instead, water flows rapidly over the surface as runoff. In contrast, the wooded area has a permeable soil surface covered with leaf litter, allowing water to infiltrate, greatly reducing surface runoff.
Factor 2: Vegetation cover [2]
The wooded area has dense vegetation, including trees and undergrowth, which intercepts rainfall on leaves and branches, reducing the amount of water reaching the ground. Root systems also increase infiltration capacity. The car park has no vegetation cover, so all rainfall reaches the surface directly and becomes runoff.
Other acceptable factors:
Infiltration rate: The soil in the wooded area has a higher infiltration rate due to its organic content, root channels, and lack of compaction, allowing water to soak in. The car park's surface has zero infiltration.
Soil compaction: Vehicle traffic on the car park compacts any exposed soil, reducing pore space and infiltration, increasing runoff. The wooded area's soil is uncompacted and well-structured, promoting infiltration.
Marking: 1 mark for identifying/explaining each factor in the context of the car park. 1 mark for contrasting with the wooded area for each factor. Maximum 4 marks (2 factors × 2 marks each).
Free quiz and exam paper access
Enter your details to view this paper
Your access is remembered on this device.