A-Level Geography H1 Quiz - Fieldwork
Name: ___________________________
Class: ___________________________
Date: ___________________________
Score: ___________________________
Duration: 60 minutes
Total Marks: 40
Topic: Fieldwork (Cluster 2: Community response to climate change / Needs analysis of the elderly)
Instructions:
- This quiz contains 20 questions on the topic of Fieldwork only.
- Answer all questions in the spaces provided.
- Section A (Q1–5): Short recall and definition (1–2 marks each).
- Section B (Q6–12): Data and method interpretation (2–4 marks each).
- Section C (Q13–17): Structured fieldwork application (4–6 marks each).
- Section D (Q18–20): Evaluative extended response (fieldwork evaluation, 5–6 marks each).
- Use geographical terminology and support answers with examples where asked.
Section A: Fieldwork Foundations (Q1–5)
1. State one defining characteristic of Cluster 2 fieldwork in the H1 Geography syllabus. [1]
2. Give one reason why a face-to-face questionnaire survey is often chosen for a needs analysis of the elderly in an urban neighbourhood. [1]
3. Identify one risk that student fieldworkers may encounter when conducting door-to-door surveys in a residential estate. [1]
4. State one way to minimise the impact of a fieldwork investigation on a studied neighbourhood site. [1]
5. Name one appropriate graphical method to represent ranked questionnaire responses on elderly mobility needs. [1]
Section B: Data and Method Interpretation (Q6–12)
6. A student group collected data on elderly residents' use of community climate shelters. Explain why a stratified sampling approach may improve the quality of this fieldwork. [2]
7. The table below shows counts of elderly respondents by awareness of community cooling centres during a heatwave.
| Awareness level | Number of respondents |
|---|
| Aware | 42 |
| Unaware | 28 |
| Unsure | 10 |
Calculate the percentage of respondents who were aware. Show your working. [2]
8. Suggest one limitation of using a single photo of a neighbourhood void deck to assess elderly liveability needs. [2]
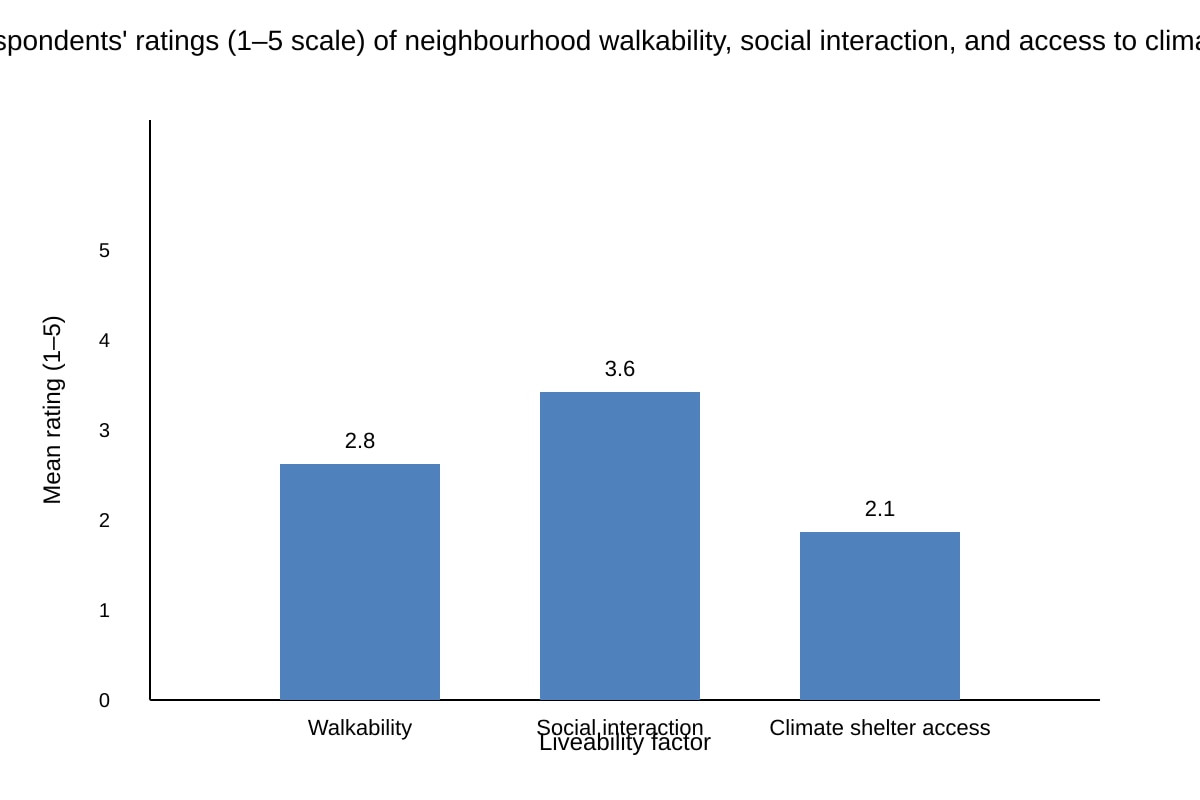
9.
Generated graph for Q9.
Using the chart above, identify the factor with the lowest mean rating and state why this matters for fieldwork planning. [2]
10. Explain how a semi-structured interview differs from a closed questionnaire for fieldwork on community response to climate change. [2]
11. A fieldwork project maps flood-prone zones used by elderly for daily errands. State one secondary data source that could support this and one advantage of using it. [2]
12. Describe one ethical consideration when recording elderly participants' responses in a climate-adaptation needs study. [2]
Section C: Structured Fieldwork Application (Q13–17)
13. A class of 22 students investigated community response to climate change in Braddell Heights by distributing 120 face-to-face questionnaires to residents aged 60+.
(a) Suggest one reason why face-to-face was preferred over online surveys. [2]
(b) State one method to reduce sampling bias in this study. [2]
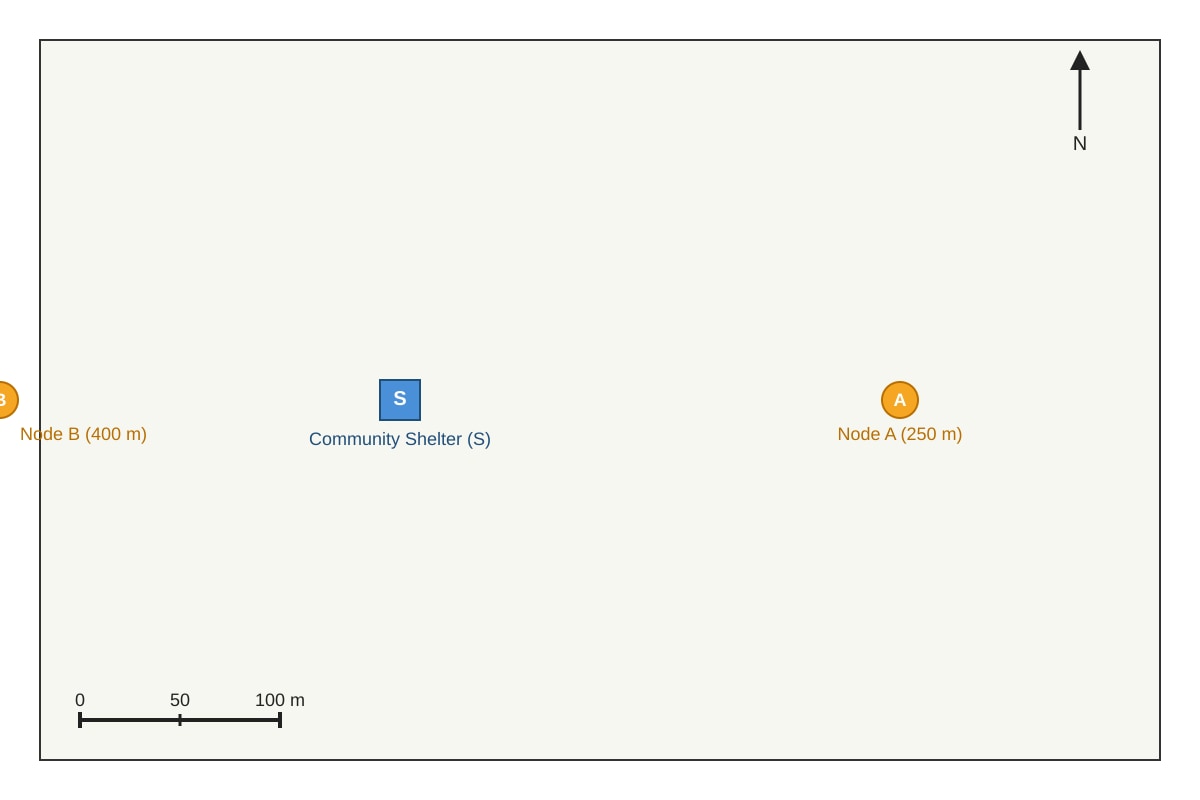
14.
Generated map for Q14.
Using the map, explain how distance from the community shelter may affect elderly climate resilience. [4]
15. Students measured infiltration rates at a park, a paved plaza, and a grass verge to study urban cooling. Their results: park 35 mm/h, plaza 8 mm/h, grass 22 mm/h.
(a) Describe the pattern. [2]
(b) Explain one reason the plaza had the lowest rate. [2]
16. For a needs analysis of the elderly, propose a suitable fieldwork question and state the data collection method you would use. [4]
17. Evaluate the usefulness of a 10-question questionnaire alone to understand elderly needs in a neighbourhood. Use a Level 1–3 descriptor style (max 6 marks). [6]
Section D: Evaluative Extended Response (Q18–20)
18. To what extent can student fieldwork on community response to climate change in one neighbourhood represent the whole city? Evaluate with reference to scale and method. [5]
19. Discuss how triangulation of questionnaire, interview, and observation data strengthens a fieldwork study on elderly liveability. [5]
20. A group evaluated neighbourhood cooling needs of the elderly using only Instagram photos tagged with a local place name. Assess the validity of this method for fieldwork. [6]
</stage3_quiz_answers_md>
A-Level Geography H1 Quiz Answers - Fieldwork
Topic: Fieldwork
Total Marks: 40
Section A (Q1–5)
1. [1] One defining characteristic: Cluster 2 fieldwork is a compulsory 30-mark section in the A-Level paper focused on either (a) community response to climate change OR (b) needs analysis of the elderly.
Teaching note: The syllabus specifies only these two focus areas; fieldwork is not a free-choice topic.
2. [1] Reason: Face-to-face allows clarification for elderly who may have low digital literacy or vision issues, and builds rapport to improve response honesty.
Teaching note: Elderly respondents may struggle with online forms; personal contact raises completion rates.
3. [1] Risk: Personal safety (e.g., student approached by stranger, heat exposure, trip hazards in void decks).
Common mistake: Saying "bad data" is not a field risk; risk means physical/ethical safety.
4. [1] Minimise impact: Avoid blocking common corridors, keep noise low, obtain consent, and leave site clean.
Marking: Any one valid low-impact practice accepted.
5. [1] Graphical method: Bar chart (or diverging bar, or ranked bar).
Note: For ranked responses, a bar chart with factors on x-axis is standard.
Section B (Q6–12)
6. [2] Stratified sampling improves quality by ensuring subgroups (e.g., age 60–69, 70–79, 80+) are proportionally represented, reducing bias and allowing comparison across vulnerability levels.
Marks: 1 for definition, 1 for linkage to data quality.
7. [2] Working: Total = 42 + 28 + 10 = 80. Aware % = (42 / 80) × 100 = 52.5%.
Answer: 52.5%.
Marking: 1 for correct total and division, 1 for correct %.
8. [2] Limitation: A single photo captures one moment and may miss temporal use (e.g., elderly gather only mornings); also cannot show subjective needs or accessibility barriers.
Marks: 1 for temporal, 1 for subjective/access limitation.
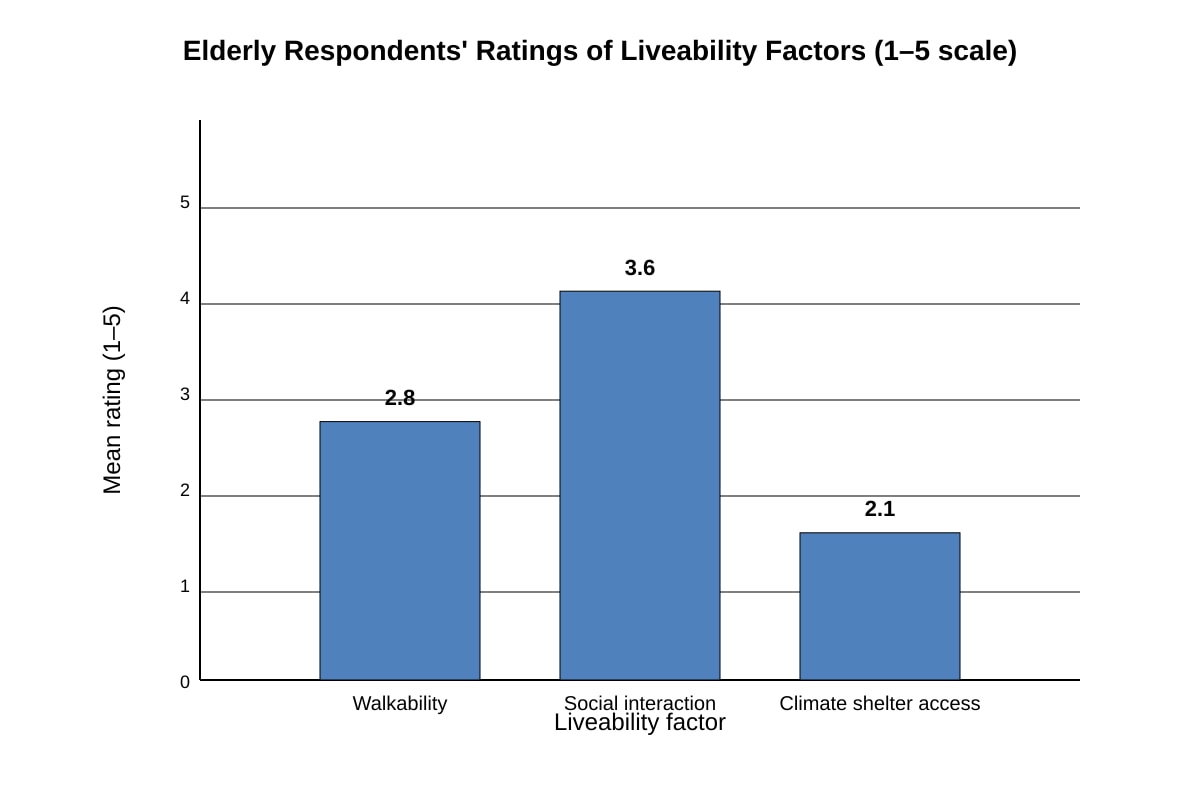
9. [2] Lowest mean: Climate shelter access (2.1). Matters because it shows a priority gap for fieldwork follow-up interviews on shelter usability.
Image support: Chart must show three bars; 2.1 is lowest.
10. [2] Semi-structured interview allows open elaboration on personal climate experiences; closed questionnaire restricts to fixed responses, limiting depth on community response nuance.
Marks: 1 each for contrast points.
11. [2] Secondary source: NEA flood map (or URA master plan). Advantage: Covers long-term spatial pattern without field cost.
Marks: 1 source, 1 advantage.
12. [2] Ethical consideration: Anonymise names and get informed consent before recording to protect privacy of vulnerable elderly.
Marks: 1 anonymise, 1 consent.
Section C (Q13–17)
13. [4]
(a) [2] Face-to-face preferred: many elderly lack smartphones/internet; interviewer can assist reading and probe for detail.
(b) [2] Reduce bias: Use proportional stratified sampling by block so all estates represented, not just ground-floor units.
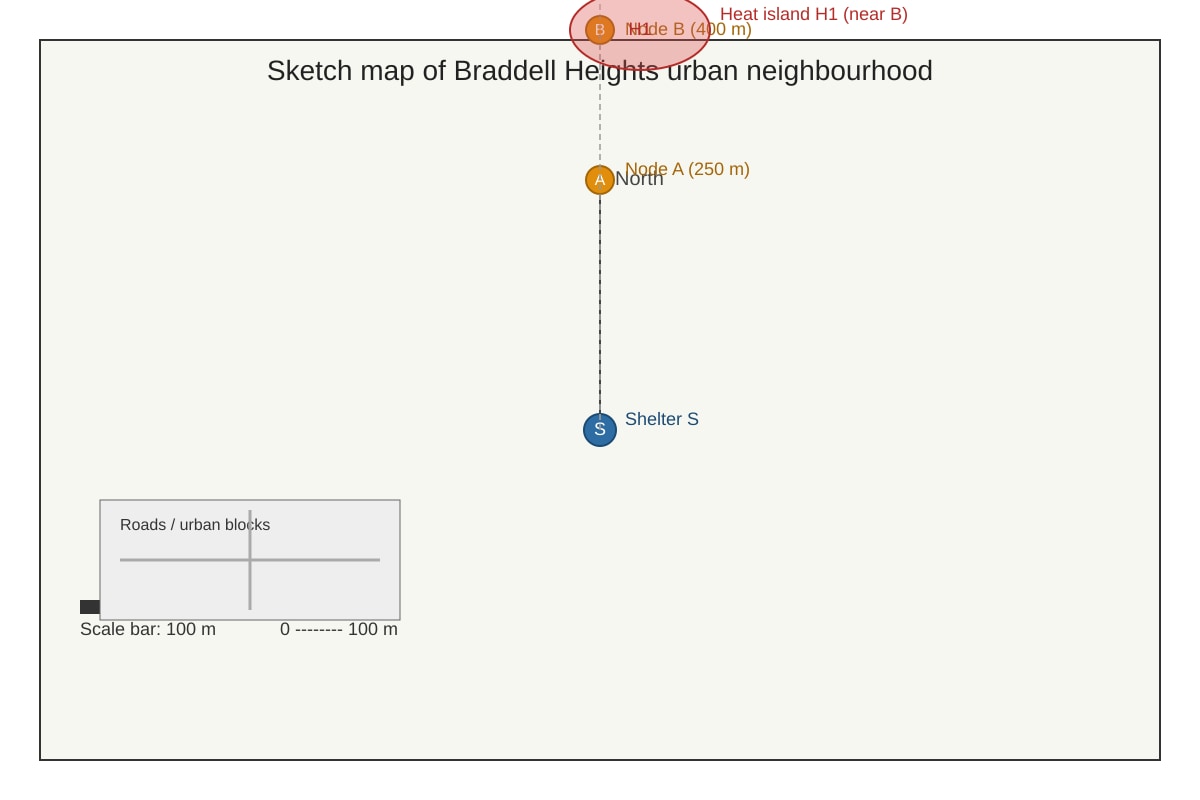
14. [4] Using map: Node C (600 m) and B (400 m) are farther than A (250 m); H1/H2 near B/C mean those elderly face heat exposure with longer shelter distance, lowering resilience. Map must show distances and heat islands.
Marks: 2 for distance interpretation, 2 for resilience link.
15. [4]
(a) [2] Pattern: Infiltration highest at park (35), then grass (22), lowest plaza (8 mm/h); vegetated surfaces absorb more.
(b) [2] Plaza low due to impervious concrete preventing water entry, raising surface heat.
16. [4] Question: "What mobility aids do elderly need to reach climate shelters?" Method: Observed route walk + short questionnaire.
Marks: 2 question relevance, 2 method fit.
17. [6] Level descriptors:
- L1 (1–3): Says questionnaire gives some useful counts but notes it misses depth.
- L2 (4–5): Compares to interviews; notes questionnaire cannot capture emotion/context.
- L3 (6): Concludes questionnaire alone insufficient; recommends triangulation; notes representativeness limits.
Teaching: A single method lacks validity for complex needs.
Section D (Q18–20)
18. [5] Evaluation: One neighbourhood (local scale) cannot capture city-wide variance in housing type, income, or microclimate (scale mismatch). But deep method (interviews) gives process insight. Conclusion: partial representation only; city-level claims need multi-site data.
Marks: 2 scale, 2 method limit, 1 judgement.
19. [5] Triangulation strengthens by cross-checking: questionnaire gives breadth, interview gives why, observation gives behaviour. Reduces single-method bias.
Marks: 1 each method role, 2 synthesis.
20. [6] Validity low: Instagram tags self-select young/active users, exclude non-digital elderly (bias); photos lack need severity. But show public space use. Assess: not valid alone for elderly needs; use with surveys.
Marks: 2 bias, 2 exclusion, 2 overall assess.
</stage3_quiz_answers_md>
<stage3_quiz_md>
A-Level Geography H1 Quiz - Fieldwork
Name: ___________________________
Class: ___________________________
Date: ___________________________
Score: ___________________________
Duration: 60 minutes
Total Marks: 40
Topic: Fieldwork (Cluster 2: Community response to climate change / Needs analysis of the elderly)
Instructions:
- This quiz contains 20 questions on the topic of Fieldwork only.
- Answer all questions in the spaces provided.
- Section A (Q1–5): Short recall and definition (1–2 marks each).
- Section B (Q6–12): Data and method interpretation (2–4 marks each).
- Section C (Q13–17): Structured fieldwork application (4–6 marks each).
- Section D (Q18–20): Evaluative extended response (fieldwork evaluation, 5–6 marks each).
- Use geographical terminology and support answers with examples where asked.
Section A: Fieldwork Foundations (Q1–5)
1. State one defining characteristic of Cluster 2 fieldwork in the H1 Geography syllabus. [1]
2. Give one reason why a face-to-face questionnaire survey is often chosen for a needs analysis of the elderly in an urban neighbourhood. [1]
3. Identify one risk that student fieldworkers may encounter when conducting door-to-door surveys in a residential estate. [1]
4. State one way to minimise the impact of a fieldwork investigation on a studied neighbourhood site. [1]
5. Name one appropriate graphical method to represent ranked questionnaire responses on elderly mobility needs. [1]
Section B: Data and Method Interpretation (Q6–12)
6. A student group collected data on elderly residents' use of community climate shelters. Explain why a stratified sampling approach may improve the quality of this fieldwork. [2]
7. The table below shows counts of elderly respondents by awareness of community cooling centres during a heatwave.
| Awareness level | Number of respondents |
|---|
| Aware | 42 |
| Unaware | 28 |
| Unsure | 10 |
Calculate the percentage of respondents who were aware. Show your working. [2]
8. Suggest one limitation of using a single photo of a neighbourhood void deck to assess elderly liveability needs. [2]
9.
Generated graph for Q9.
Using the chart above, identify the factor with the lowest mean rating and state why this matters for fieldwork planning. [2]
10. Explain how a semi-structured interview differs from a closed questionnaire for fieldwork on community response to climate change. [2]
11. A fieldwork project maps flood-prone zones used by elderly for daily errands. State one secondary data source that could support this and one advantage of using it. [2]
12. Describe one ethical consideration when recording elderly participants' responses in a climate-adaptation needs study. [2]
Section C: Structured Fieldwork Application (Q13–17)
13. A class of 22 students investigated community response to climate change in Braddell Heights by distributing 120 face-to-face questionnaires to residents aged 60+.
(a) Suggest one reason why face-to-face was preferred over online surveys. [2]
(b) State one method to reduce sampling bias in this study. [2]
14.
Generated map for Q14.
Using the map, explain how distance from the community shelter may affect elderly climate resilience. [4]
15. Students measured infiltration rates at a park, a paved plaza, and a grass verge to study urban cooling. Their results: park 35 mm/h, plaza 8 mm/h, grass 22 mm/h.
(a) Describe the pattern. [2]
(b) Explain one reason the plaza had the lowest rate. [2]
16. For a needs analysis of the elderly, propose a suitable fieldwork question and state the data collection method you would use. [4]
17. Evaluate the usefulness of a 10-question questionnaire alone to understand elderly needs in a neighbourhood. Use a Level 1–3 descriptor style (max 6 marks). [6]
Section D: Evaluative Extended Response (Q18–20)
18. To what extent can student fieldwork on community response to climate change in one neighbourhood represent the whole city? Evaluate with reference to scale and method. [5]
19. Discuss how triangulation of questionnaire, interview, and observation data strengthens a fieldwork study on elderly liveability. [5]
20. A group evaluated neighbourhood cooling needs of the elderly using only Instagram photos tagged with a local place name. Assess the validity of this method for fieldwork. [6]