AI Generated Exam Paper
A Level H1 Geography Practice Paper 5
Free A Level H1 Geography Practice Paper 5, LongCat AI version, with questions, answers, and A Level-style practice for Singapore students.
These static practice materials are generated from the site's syllabus and paper-generation workflow, with source and model context shown so students and parents can evaluate the material before use.
Questions
TuitionGoWhere Practice Paper - Geography H1 A-Level
TuitionGoWhere Practice Paper (AI)
Subject: Geography Level: A-Level H1 Paper: Practice Paper — Theme: Resources & Sustainability Version: 5 of 5 Duration: 1 hour 30 minutes Total Marks: 50
Name: ___________________________ Class: ___________________________ Date: ___________________________
Instructions
- Answer ALL questions.
- Write your answers in the spaces provided.
- Begin each section on a fresh page.
- Where data/resources are referenced, study them carefully before answering.
- The number of marks for each question or part-question is shown in brackets [ ].
- You are advised to spend approximately:
- Section A: 35 minutes
- Section B: 55 minutes
- Credit will be given for the use of relevant examples, case studies, and evidence from the resources provided.
Section A: Data Response Questions [25 marks]
Answer ALL questions in this section.
Study Resource 1 carefully before answering Questions 1–5.
Resource 1 shows data on global freshwater withdrawal by sector (agriculture, industry, domestic) for selected countries in 2020, alongside each country's Gross National Income (GNI) per capita.
Table 1: Freshwater Withdrawal by Sector and GNI per Capita (2020)
| Country | Agriculture (%) | Industry (%) | Domestic (%) | Total Freshwater Withdrawal (km³/yr) | GNI per Capita (US$) |
|---|---|---|---|---|---|
| Bangladesh | 88 | 5 | 7 | 35.9 | 2,227 |
| India | 85 | 8 | 7 | 761.0 | 1,928 |
| Brazil | 60 | 18 | 22 | 74.8 | 8,721 |
| United Kingdom | 10 | 68 | 22 | 8.4 | 42,374 |
| Japan | 34 | 32 | 34 | 81.5 | 40,193 |
| Saudi Arabia | 82 | 3 | 15 | 24.8 | 21,724 |
| Nigeria | 73 | 12 | 15 | 13.1 | 2,097 |
| Netherlands | 1 | 88 | 11 | 10.8 | 52,295 |
1. Using Resource 1, describe the relationship between GNI per capita and the percentage of freshwater withdrawn for agriculture. [3]
2. Suggest two reasons why Saudi Arabia has a high total freshwater withdrawal despite its arid climate. [4]
(a) _________________________________________________________________________
(b) _________________________________________________________________________
3. Explain why Bangladesh and India together account for a disproportionately large share of global agricultural water use. [4]
4. Using evidence from Resource 1, compare the water withdrawal profiles of the United Kingdom and Japan. [5]
5. "Countries with higher GNI per capita use less water for agriculture." Evaluate this statement using evidence from Resource 1 and your own knowledge. [9]
Section B: Structured and Essay Questions [25 marks]
Answer ALL questions in this section.
Study Resource 2 carefully before answering Questions 6–8.
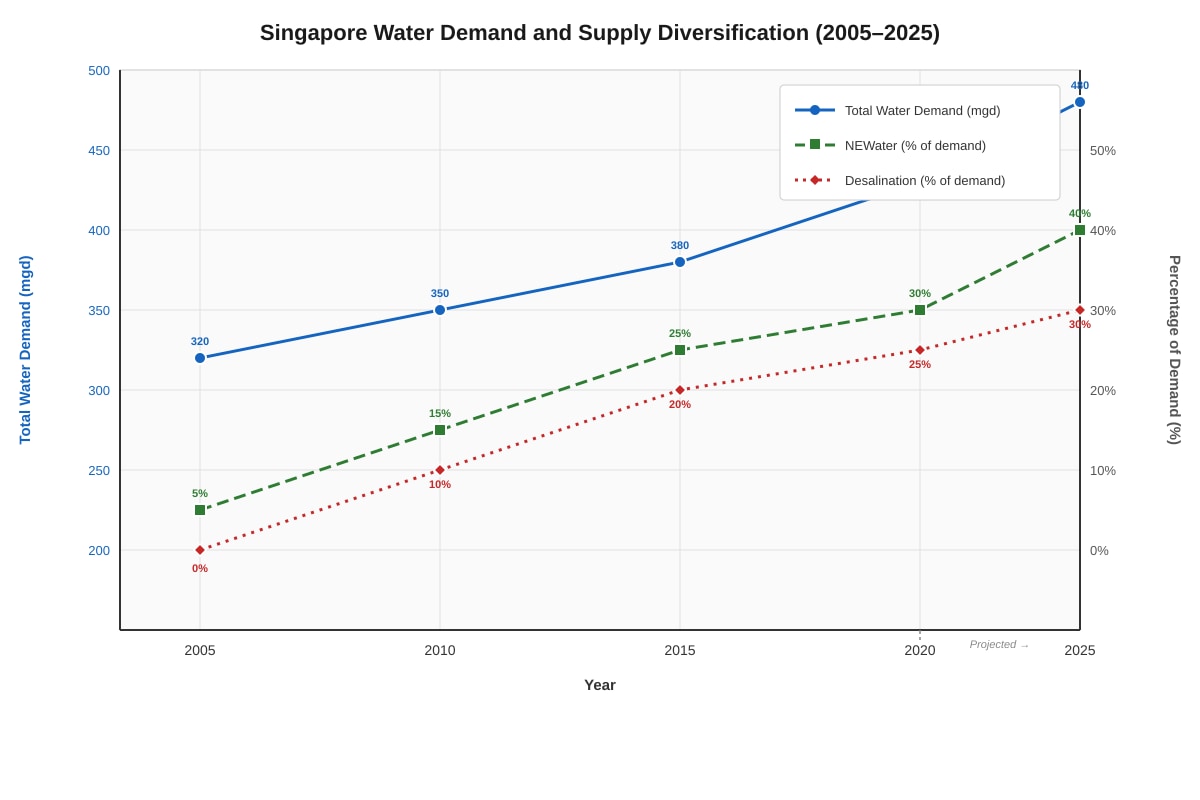
Resource 2 is a line graph showing the change in Singapore's total water demand (million gallons per day, mgd) and the contribution of NEWater and desalination (as a percentage of total demand) from 2005 to 2025 (projected).
Generated graph for Q6.
6. Using Resource 2, describe the trend in Singapore's total water demand from 2005 to 2025. [3]
7. Explain how the development of NEWater and desalination has contributed to Singapore's water security. [6]
8. Assess the extent to which technological solutions alone can ensure long-term water sustainability for a densely populated city-state like Singapore. [10]
9. Explain two strategies, other than technological solutions, that a country can adopt to manage its resources sustainably. [6]
Strategy 1: __________________________________________________________________
Strategy 2: __________________________________________________________________
End of Paper
Total Marks: 50
Answers
TuitionGoWhere Practice Paper — Answer Key & Marking Scheme
Subject: Geography H1 A-Level Paper: Practice Paper — Theme: Resources & Sustainability Version: 5 of 5 Total Marks: 50
Section A: Data Response Questions [25 marks]
Question 1 [3 marks]
Question: Using Resource 1, describe the relationship between GNI per capita and the percentage of freshwater withdrawn for agriculture.
Answer:
There is an inverse (negative) relationship between GNI per capita and the percentage of freshwater withdrawn for agriculture. Countries with lower GNI per capita, such as India (GNI 1,928;852,227; 88% agricultural withdrawal), allocate a very high proportion of their freshwater to agriculture. In contrast, countries with higher GNI per capita, such as the Netherlands (GNI 52,295;142,374; 10% agricultural withdrawal), use a much smaller percentage for agriculture. This suggests that as countries develop economically, agriculture becomes a less dominant sector in water use, while industrial and domestic sectors increase in relative importance.
Mark Scheme:
- [1] Identifies the inverse/negative relationship.
- [1] Uses at least two specific data pairs from Resource 1 to support the description (e.g., India vs Netherlands, Bangladesh vs UK).
- [1] Provides a valid explanation linking economic development to sectoral water use shift.
Common Mistakes:
- Only describing one country's data without comparing.
- Stating a correlation without using specific figures from the table.
- Confusing percentage of withdrawal with total volume of withdrawal.
Question 2 [4 marks]
Question: Suggest two reasons why Saudi Arabia has a high total freshwater withdrawal despite its arid climate.
Answer:
(a) Agricultural irrigation demands: Saudi Arabia has invested heavily in large-scale irrigation projects to achieve food security, particularly for wheat and date palm cultivation. Despite receiving minimal rainfall, the country extracts significant volumes of fossil groundwater from deep aquifers to irrigate crops in desert environments. This agricultural ambition drives very high total freshwater withdrawal.
(b) High domestic water consumption linked to economic wealth: Saudi Arabia's high GNI per capita ($21,724) enables high standards of living, including water-intensive lifestyles. Air conditioning, landscaping, swimming pools, and desalination-powered municipal supply all contribute to substantial domestic water use. The reliance on energy-intensive desalination makes water artificially available, encouraging higher per capita consumption than would otherwise be expected in an arid region.
Mark Scheme:
- [2] for each valid reason (1 mark for identifying the reason, 1 mark for developing/explaining it).
- Reasons must be distinct and specific to Saudi Arabia's context.
Common Mistakes:
- Stating "because it is hot" without linking to a specific water use mechanism.
- Confusing water availability with water withdrawal.
- Providing generic reasons not tied to the data or context.
Question 3 [4 marks]
Question: Explain why Bangladesh and India together account for a disproportionately large share of global agricultural water use.
Answer:
Bangladesh and India together account for a disproportionately large share of global agricultural water use for several interconnected reasons:
-
Large agricultural populations and labour forces: Both countries have vast rural populations dependent on farming. India alone has over 150 million farming households, and Bangladesh's economy is heavily reliant on rice cultivation, which is extremely water-intensive.
-
Dominance of water-intensive crops: Both countries are major producers of rice (paddy), which requires continuous flooding of fields during the growing season. India is also a significant producer of sugarcane and cotton, both of which have high water footprints.
-
Extensive irrigation infrastructure: India has one of the world's largest irrigated areas, with over 68 million hectares under irrigation. Much of this relies on groundwater extraction through millions of tube wells, contributing to the massive total withdrawal figure of 761 km³/yr.
-
Subsistence and food security needs: Both countries must feed enormous populations (combined ~1.6 billion people), necessitating high agricultural output and therefore high water consumption. Limited adoption of water-efficient irrigation techniques (such as drip irrigation) further amplifies water demand.
Mark Scheme:
- [1] mark for each valid explanatory point, up to a maximum of 4.
- Answers must go beyond description of the data and provide causal explanations.
- Credit relevant examples and specific details.
Common Mistakes:
- Simply restating the data from the table without explaining causation.
- Failing to mention specific crops or irrigation methods.
- Not linking population size to agricultural demand.
Question 4 [5 marks]
Question: Using evidence from Resource 1, compare the water withdrawal profiles of the United Kingdom and Japan.
Answer:
The United Kingdom and Japan show both similarities and differences in their water withdrawal profiles:
Similarities:
- Both countries have relatively high GNI per capita (UK: 42,374;Japan:40,193), indicating similar levels of economic development.
- Both countries have moderate total freshwater withdrawal volumes (UK: 8.4 km³/yr; Japan: 81.5 km³/yr), though Japan's is notably higher in absolute terms.
- Both allocate a significant proportion of water to non-agricultural uses, reflecting post-industrial economies.
Differences:
- The UK has a much higher industrial water withdrawal (68%) compared to Japan (32%). This reflects the UK's historical and ongoing reliance on water-intensive industries such as chemical manufacturing, power generation (cooling), and steel production.
- Japan has a higher agricultural withdrawal (34%) compared to the UK (10%). Japan's rice paddy cultivation requires substantial irrigation water, whereas the UK's temperate climate allows rain-fed agriculture for many crops.
- Japan's domestic water use (34%) is significantly higher than the UK's (22%), likely reflecting differences in population size (Japan: ~125 million; UK: ~67 million) and cultural water use patterns.
- Japan's total withdrawal (81.5 km³/yr) is nearly ten times that of the UK (8.4 km³/yr), reflecting Japan's larger population, greater industrial output, and more extensive irrigated agriculture.
Mark Scheme:
- [1] Identifies at least one valid similarity with data support.
- [1] Identifies at least one valid difference with data support.
- [1] Provides a second valid difference with data support.
- [1] Offers explanatory reasoning for the differences (not just description).
- [1] Overall coherence and use of comparative language (e.g., "whereas," "in contrast," "similarly").
Common Mistakes:
- Only describing each country separately without making direct comparisons.
- Not using specific percentage or volume data from the table.
- Failing to explain why the differences exist.
Question 5 [9 marks]
Question: "Countries with higher GNI per capita use less water for agriculture." Evaluate this statement using evidence from Resource 1 and your own knowledge.
Answer:
Agreement with the statement:
The data in Resource 1 largely supports this statement. There is a clear inverse relationship between GNI per capita and agricultural water withdrawal percentage. The Netherlands (GNI 52,295)usesonly142,374) uses 10%. In contrast, India (GNI 1,928)uses852,227) uses 88%. This pattern reflects the structural economic shift that accompanies development: as countries industrialise and move toward service-based economies, agriculture's share of GDP and employment declines, reducing its relative water demand. Higher-GNI countries also tend to adopt more efficient irrigation technologies (e.g., drip irrigation, precision agriculture), which reduce the volume of water needed per unit of agricultural output.
Challenges to the statement:
However, the relationship is not perfectly linear. Saudi Arabia (GNI $21,724) has a relatively high GNI per capita but still withdraws 82% of its freshwater for agriculture. This is because Saudi Arabia has invested heavily in irrigated agriculture as part of its food security strategy, extracting fossil groundwater to grow crops in the desert. This demonstrates that national policy priorities can override the general trend.
Additionally, the statement refers to the percentage of water used for agriculture, not the absolute volume. A high-GNI country may use a smaller proportion for agriculture but still withdraw large total volumes. For example, Japan (GNI $40,193) withdraws 81.5 km³/yr in total, with 34% going to agriculture — this is still a substantial absolute volume (~27.7 km³/yr for agriculture).
Furthermore, some high-income countries in arid regions, such as Australia and Israel, have significant agricultural water use despite high GNI, driven by export-oriented agriculture and the need to manage scarce water resources carefully.
Conclusion:
The statement is broadly supported by the data in Resource 1, as there is a clear general trend of declining agricultural water use percentage with rising GNI per capita. However, the relationship is mediated by factors such as national policy, climate, agricultural export orientation, and absolute water volumes. The statement should therefore be treated as a generalisation rather than a universal rule.
Mark Scheme:
| Level | Marks | Descriptors |
|---|---|---|
| Level 1 | 1–3 | Describes the data with limited evaluation. May agree or disagree but without balanced argument. Limited use of own knowledge. |
| Level 2 | 4–6 | Explains the relationship using data from Resource 1. Some evaluation with at least one challenge or limitation identified. Uses some own knowledge. |
| Level 3 | 7–9 | Balanced evaluation with clear agreement and challenges. Uses specific data from Resource 1 and relevant own knowledge. Reaches a reasoned conclusion. Demonstrates understanding of mediating factors. |
Common Mistakes:
- Only describing the data without evaluating the statement.
- Ignoring anomalies like Saudi Arabia.
- Not distinguishing between percentage and absolute volume.
- Failing to reach a conclusion.
Section B: Structured and Essay Questions [25 marks]
Question 6 [3 marks]
Question: Using Resource 2, describe the trend in Singapore's total water demand from 2005 to 2025.
Answer:
Singapore's total water demand has shown a consistent upward trend from 2005 to 2025. In 2005, total demand was approximately 320 million gallons per day (mgd). By 2010, it had risen to about 350 mgd, and by 2015 it reached approximately 380 mgd. The rate of increase appears to accelerate after 2015, with demand reaching about 430 mgd by 2020 and projected to reach approximately 480 mgd by 2025. This represents an overall increase of about 160 mgd (or roughly 50%) over the 20-year period. The trend is consistently upward with no periods of decline, reflecting Singapore's growing population, expanding economy, and increasing industrial and domestic water needs.
Mark Scheme:
- [1] Identifies the overall upward/increasing trend.
- [1] Uses at least two specific data points from the graph to support the description.
- [1] Notes the rate of change or overall magnitude of increase (e.g., "accelerating," "50% increase").
Common Mistakes:
- Only stating "it increased" without quantifying.
- Not using specific figures from the graph.
- Describing NEWater/dalination trends instead of total demand.
Question 7 [6 marks]
Question: Explain how the development of NEWater and desalination has contributed to Singapore's water security.
Answer:
Singapore's development of NEWater and desalination has significantly enhanced its water security by diversifying its water supply sources and reducing dependence on imported water.
NEWater (recycled water): NEWater is high-grade reclaimed water produced through advanced membrane technology (microfiltration and reverse osmosis) followed by ultraviolet disinfection. As shown in Resource 2, NEWater's contribution has grown from approximately 5% of total demand in 2005 to a projected 40% by 2025. This represents a massive expansion of a reliable, climate-independent water source. NEWater is particularly valuable because it can be produced domestically regardless of weather conditions, reducing vulnerability to droughts that could affect local catchment rainfall. It also reduces Singapore's reliance on water imports from Malaysia, which have been a source of diplomatic tension.
Desalination: Desalination converts seawater into potable water using reverse osmosis technology. Resource 2 shows desalination's contribution growing from 0% in 2005 to a projected 30% by 2025. Singapore's coastal geography makes it well-suited for desalination. Like NEWater, desalination provides a drought-resistant supply source. The Tuas and Keppel desalination plants have progressively increased capacity, and a fifth plant is planned.
Combined impact: Together, NEWater and desalination are projected to meet up to 70% of Singapore's water demand by 2025 (40% + 30%), dramatically reducing the share met by imported water and local catchment. This diversification enhances resilience against supply disruptions, climate change impacts on rainfall, and geopolitical risks associated with water imports. Singapore's "Four National Taps" strategy — local catchment, imported water, NEWater, and desalination — exemplifies a comprehensive approach to water security.
Mark Scheme:
- [1] Explains what NEWater is and how it is produced.
- [1] Uses data from Resource 2 to show NEWater's growing contribution.
- [1] Explains the significance of NEWater for water security (climate independence, reduced import dependence).
- [1] Explains what desalination is and its relevance to Singapore.
- [1] Uses data from Resource 2 to show desalination's growing contribution.
- [1] Synthesises the combined impact of both technologies on overall water security.
Common Mistakes:
- Describing the technologies without linking to water security.
- Not using data from Resource 2.
- Confusing NEWater with desalination.
- Not mentioning the "Four National Taps" or diversification strategy.
Question 8 [10 marks]
Question: Assess the extent to which technological solutions alone can ensure long-term water sustainability for a densely populated city-state like Singapore.
Answer:
Introduction: Water sustainability refers to the ability to meet current and future water needs without compromising environmental integrity or resource availability. Singapore, as a densely populated city-state with limited land area and no natural aquifers, faces acute water scarcity. While technological solutions such as NEWater and desalination have been transformative, this essay argues that technology alone is insufficient to ensure long-term water sustainability; it must be complemented by demand management, governance, and behavioural change.
Arguments that technology can ensure sustainability:
-
Supply diversification through technology: Singapore's investment in NEWater and desalination has reduced its dependence on imported water from Malaysia (which currently supplies about 40% of demand, down from nearly 100% historically). By 2025, NEWater and desalination are projected to meet 70% of demand. This technological diversification provides resilience against geopolitical risks and climate variability.
-
Increasing efficiency of water production: Advances in membrane technology have reduced the energy cost of both NEWater production and desalination. For example, energy consumption for desalination has fallen from approximately 10 kWh/m³ in the 1990s to around 3–4 kWh/m³ today. This makes technological solutions increasingly viable and sustainable from an energy perspective.
-
Smart water management systems: Singapore uses advanced sensor networks and data analytics to monitor its water distribution system in real time, detecting leaks and reducing non-revenue water to approximately 5% — one of the lowest rates globally. This technological infrastructure minimises waste and optimises distribution.
Arguments that technology alone is insufficient:
-
High energy demands and environmental costs: Desalination remains energy-intensive, and if the energy comes from fossil fuels, it contributes to carbon emissions and climate change — which in turn affects water availability. Singapore's desalination plants consume significant electricity, creating a paradox where solving water scarcity exacerbates climate change. NEWater production also requires substantial energy for membrane processes.
-
Rising demand outpacing supply capacity: As shown in Resource 2, Singapore's total water demand is projected to continue rising (from 320 mgd in 2005 to 480 mgd by 2025). If demand continues to grow, even expanding technological capacity may not keep pace. Without demand management, the gap between supply and demand could widen, especially as population and economic activity grow.
-
Cost implications: Technological solutions are expensive to build and maintain. Desalination plants require billions of dollars in capital investment and ongoing operational costs. These costs are ultimately borne by consumers and the government, raising questions about affordability and equity, particularly during economic downturns.
-
Need for demand-side management: Singapore has implemented water pricing reforms, public education campaigns (e.g., the Water Efficient Homes programme), and mandatory water efficiency labelling for appliances. These non-technological measures help reduce per capita consumption and are essential complements to supply-side technology. Without behavioural change, technology alone cannot close the water gap.
-
Governance and international cooperation: Singapore's water sustainability also depends on diplomatic agreements with Malaysia regarding imported water, as well as effective governance of water resources through the Public Utilities Board (PUB). Technology cannot substitute for sound policy and international relations.
Conclusion: Technological solutions are a necessary and powerful component of Singapore's water sustainability strategy, and they have already transformed the country's water security landscape. However, they are not sufficient on their own. Long-term water sustainability requires an integrated approach combining technology with demand management, effective governance, public education, and international cooperation. Singapore's holistic "Four National Taps" strategy, which includes both supply-side and demand-side measures, exemplifies this balanced approach.
Mark Scheme:
| Level | Marks | Descriptors |
|---|---|---|
| Level 1 | 1–3 | Limited understanding of the issue. May describe technological solutions without assessing their adequacy. Little or no use of examples. |
| Level 2 | 4–6 | Explains technological solutions and identifies some limitations. Some attempt at assessment but may be unbalanced. Uses some examples. |
| Level 3 | 7–10 | Balanced assessment with clear arguments for and against technology alone. Uses specific examples (NEWater, desalination, demand management). Reaches a reasoned conclusion. Demonstrates understanding of the integrated approach needed. |
Indicative content for Level 3:
- Detailed knowledge of NEWater and desalination processes and contributions.
- Awareness of energy costs and environmental trade-offs.
- Understanding of demand-side measures (pricing, education, regulation).
- Reference to Singapore's specific context (limited land, population density, import dependence).
- Clear evaluative language ("however," "on the other hand," "nevertheless").
- Reasoned conclusion that goes beyond simply restating the question.
Common Mistakes:
- One-sided argument (only praising technology or only criticising it).
- Generic answers not specific to Singapore.
- Describing technologies without evaluating their sufficiency.
- No conclusion or a conclusion that does not answer the question.
Question 9 [6 marks]
Question: Explain two strategies, other than technological solutions, that a country can adopt to manage its resources sustainably.
Answer:
Strategy 1: Regulatory and Legislative Frameworks
Governments can implement laws and regulations to control resource extraction and promote sustainable use. For example, Singapore's Water Conservation Tax and mandatory water efficiency labelling for appliances and fittings are regulatory tools that discourage wastewater use. Similarly, many countries impose quotas on groundwater extraction to prevent aquifer depletion. In the European Union, the Water Framework Directive sets binding standards for water quality and quantity management across member states. Regulations can also mandate environmental impact assessments for new developments, ensuring that resource use is evaluated before projects proceed. These frameworks create legal accountability and set clear boundaries for resource exploitation, making them effective tools for sustainability.
Strategy 2: Economic Instruments and Pricing Mechanisms
Governments can use economic tools such as taxes, subsidies, and tradable permits to incentivise sustainable resource use. For instance, progressive water pricing (where higher usage is charged at higher rates) encourages conservation by making wastewater consumption more expensive. Carbon taxes and emissions trading schemes (such as the EU Emissions Trading System) put a price on pollution, incentivising businesses to reduce their environmental footprint. Subsidies for renewable energy or water-efficient technologies can also shift behaviour towards sustainability. In Singapore, the government provides rebates for households that install water-efficient devices. Economic instruments work by aligning individual and corporate financial incentives with broader sustainability goals, making them powerful complements to regulation.
Mark Scheme:
- [3] marks for each strategy:
- [1] Clearly identifies and names the strategy.
- [1] Explains how the strategy works (mechanism/process).
- [1] Provides a specific, relevant example or case study.
- Strategies must be distinct from technological solutions (e.g., not NEWater, desalination, drip irrigation technology).
Common Mistakes:
- Describing technological solutions instead of non-technological ones.
- Providing vague strategies without specific examples.
- Both strategies being essentially the same (e.g., two types of regulation without clear distinction).
- Not explaining how the strategy promotes sustainability.
End of Answer Key
Total Marks: 50
Free quiz and exam paper access
Enter your details to view this paper
Your access is remembered on this device.