AI Generated Exam Paper
A Level H1 Geography Practice Paper 4
Free A Level H1 Geography Practice Paper 4, LongCat AI version, with questions, answers, and A Level-style practice for Singapore students.
These static practice materials are generated from the site's syllabus and paper-generation workflow, with source and model context shown so students and parents can evaluate the material before use.
Questions
TuitionGoWhere Practice Paper (AI)
Subject: Geography H1
Level: A-Level
Paper: Practice Paper (Resources & Sustainability Focus)
Duration: 1 hour 30 minutes
Total Marks: 60
Version: 4 of 5
Name: ___________________________
Class: ___________________________
Date: ___________________________
Instructions
- Answer ALL questions in Section A and Section B.
- Write your answers in the spaces provided.
- The number of marks for each question is shown in brackets [ ].
- You are advised to spend approximately 45 minutes on Section A and 45 minutes on Section B.
- Credit will be given for the use of relevant examples and case studies.
- Where a question requires reference to a resource, study the resource carefully before answering.
Section A: Data-Based Questions
Answer ALL questions in this section. (30 marks)
Question 1
Study Resource 1 below, which shows global material extraction by resource type from 1970 to 2020.

Generated graph for Q1.
Resource 1: Global material extraction by resource type, 1970–2020
(a) Describe the overall trend in global material extraction between 1970 and 2020. [2]
..................................................................................................
..................................................................................................
..................................................................................................
(b) Identify which resource type showed the greatest absolute increase between 1970 and 2020. Support your answer with data from Resource 1. [2]
..................................................................................................
..................................................................................................
..................................................................................................
(c) Suggest two reasons for the rapid increase in extraction of non-metallic minerals since 1970. [2]
..................................................................................................
..................................................................................................
..................................................................................................
Question 2
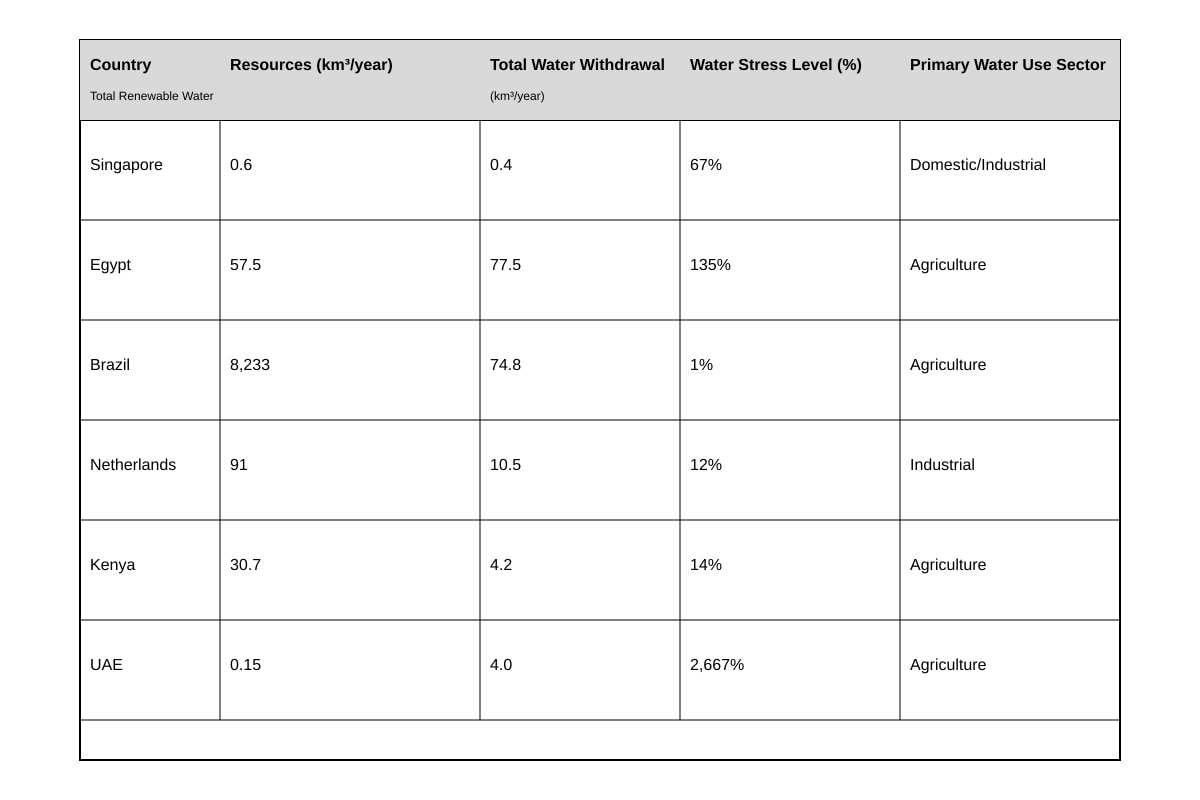
Study Resource 2 below, which shows the water stress levels of selected countries in 2023.
Generated table for Q2.
Resource 2: Water stress levels of selected countries, 2023
(a) Define the term "water stress" in the context of resource sustainability. [2]
..................................................................................................
..................................................................................................
..................................................................................................
(b) Using Resource 2, compare the water stress situations of Egypt and Brazil. [3]
..................................................................................................
..................................................................................................
..................................................................................................
..................................................................................................
..................................................................................................
(c) Explain why the UAE has an exceptionally high water stress level despite its relatively small total water withdrawal. [2]
..................................................................................................
..................................................................................................
..................................................................................................
Question 3
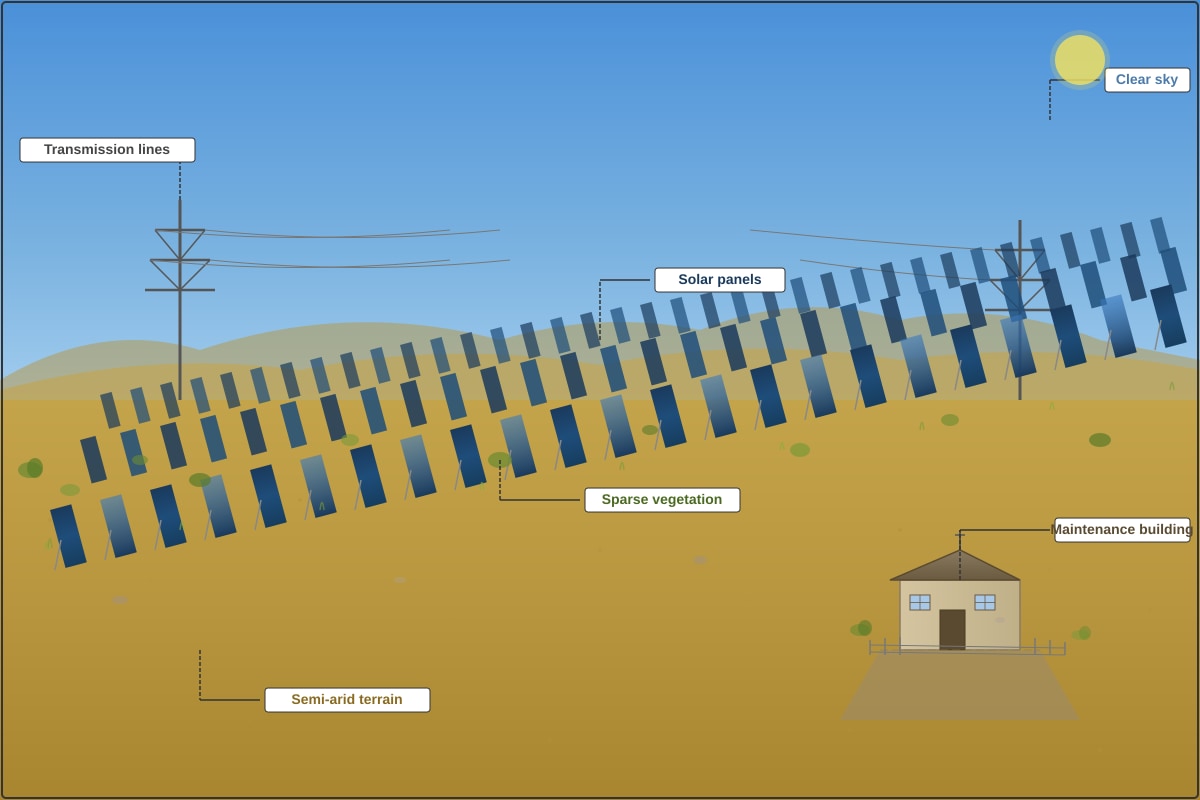
Study Resource 3 below, which shows a photograph of a solar farm in a semi-arid region.
Generated source_image for Q3.
Resource 3: Solar farm in a semi-arid region
(a) Identify two advantages of locating solar farms in semi-arid regions, as suggested by Resource 3. [2]
..................................................................................................
..................................................................................................
..................................................................................................
(b) Discuss one environmental concern associated with large-scale solar farm development in semi-arid regions. [2]
..................................................................................................
..................................................................................................
..................................................................................................
(c) Evaluate the extent to which solar energy can contribute to resource sustainability in water-scarce regions. [3]
..................................................................................................
..................................................................................................
..................................................................................................
..................................................................................................
..................................................................................................
Section B: Structured and Extended Response
Answer ALL questions in this section. (30 marks)
Question 4
(a) Explain the concept of "sustainable yield" in the context of renewable resource management. [3]
..................................................................................................
..................................................................................................
..................................................................................................
..................................................................................................
..................................................................................................
(b) Using a named example, discuss how overexploitation of a renewable resource can lead to long-term sustainability challenges. [5]
..................................................................................................
..................................................................................................
..................................................................................................
..................................................................................................
..................................................................................................
..................................................................................................
..................................................................................................
..................................................................................................
..................................................................................................
..................................................................................................
Question 5
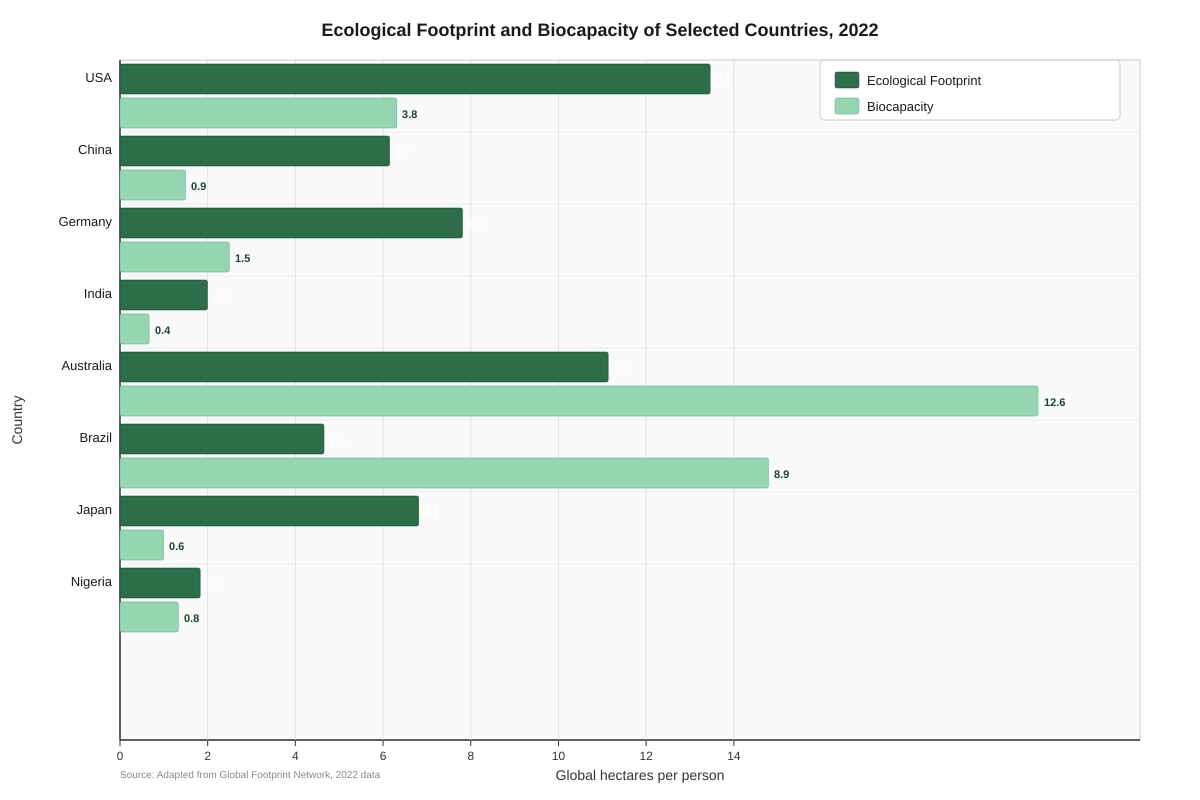
Study Resource 4 below, which shows the ecological footprint and biocapacity of selected countries in 2022.
Generated chart for Q5.
Resource 4: Ecological footprint and biocapacity of selected countries, 2022
(a) Using Resource 4, identify two countries that are in ecological deficit and two countries that are in ecological reserve. [2]
..................................................................................................
..................................................................................................
..................................................................................................
(b) Explain three factors that contribute to a country having a high ecological footprint. [4]
..................................................................................................
..................................................................................................
..................................................................................................
..................................................................................................
..................................................................................................
..................................................................................................
..................................................................................................
..................................................................................................
(c) To what extent can technological innovation alone achieve resource sustainability? Discuss with reference to examples. [6]
..................................................................................................
..................................................................................................
..................................................................................................
..................................................................................................
..................................................................................................
..................................................................................................
..................................................................................................
..................................................................................................
..................................................................................................
..................................................................................................
..................................................................................................
..................................................................................................
Question 6
(a) Describe the main features of a circular economy approach to resource management. [3]
..................................................................................................
..................................................................................................
..................................................................................................
..................................................................................................
..................................................................................................
(b) Assess the challenges faced by developing countries in transitioning from a linear to a circular economy. [5]
..................................................................................................
..................................................................................................
..................................................................................................
..................................................................................................
..................................................................................................
..................................................................................................
..................................................................................................
..................................................................................................
..................................................................................................
..................................................................................................
Question 7
Evaluate the effectiveness of international agreements in promoting global resource sustainability. In your answer, refer to at least one specific international agreement and consider both achievements and limitations. [8]
..................................................................................................
..................................................................................................
..................................................................................................
..................................................................................................
..................................................................................................
..................................................................................................
..................................................................................................
..................................................................................................
..................................................................................................
..................................................................................................
..................................................................................................
..................................................................................................
..................................................................................................
..................................................................................................
..................................................................................................
..................................................................................................
End of Practice Paper
Section A Total: 30 marks
Section B Total: 30 marks
Total Marks: 60
Answers
TuitionGoWhere Practice Paper (AI) — Answer Key
Subject: Geography H1
Level: A-Level
Paper: Practice Paper (Resources & Sustainability Focus)
Version: 4 of 5
Total Marks: 60
Section A: Data-Based Questions (30 marks)
Question 1
(a) Describe the overall trend in global material extraction between 1970 and 2020. [2]
Answer: Global material extraction increased significantly between 1970 and 2020, rising from approximately 30 billion tonnes to approximately 90 billion tonnes — a threefold increase over the 50-year period. The growth was not uniform; the rate of increase accelerated after 2000, with the steepest rises occurring in the last two decades.
Marking notes:
- 1 mark for identifying the overall upward/increasing trend.
- 1 mark for quantifying the increase (e.g., threefold, from ~30 to ~90 billion tonnes, or similar data reference).
- Award 1 mark for noting the acceleration in recent decades (optional, for the second mark if quantification is weak but trend description is detailed).
Common mistakes: Students may describe individual resource trends rather than the overall total trend. The question asks for the overall trend, so answers must refer to total extraction.
(b) Identify which resource type showed the greatest absolute increase between 1970 and 2020. Support your answer with data from Resource 1. [2]
Answer: Non-metallic minerals showed the greatest absolute increase. Extraction rose from approximately 6 billion tonnes in 1970 to approximately 40 billion tonnes in 2020, representing an increase of approximately 34 billion tonnes. This is larger than the increase in biomass (~13 billion tonnes), fossil fuels (~7 billion tonnes), and metals and ores (~6 billion tonnes).
Marking notes:
- 1 mark for correctly identifying non-metallic minerals.
- 1 mark for supporting with appropriate data from the resource (e.g., 6 to 40 billion tonnes, or an increase of ~34 billion tonnes).
Common mistakes: Students may confuse absolute increase with percentage increase. Biomass had a high percentage increase but a smaller absolute increase. The question specifically asks for absolute increase.
(c) Suggest two reasons for the rapid increase in extraction of non-metallic minerals since 1970. [2]
Answer:
- Rapid urbanisation and infrastructure development, particularly in developing countries such as China and India, which require vast quantities of construction materials (sand, gravel, limestone for cement).
- Industrialisation and manufacturing growth, which demand raw materials for glass, ceramics, chemicals, and other industrial products.
Marking notes:
- 1 mark per valid reason, up to 2 marks.
- Accept other valid reasons: population growth driving construction demand, expansion of road and building infrastructure, growth in the cement and concrete industry.
Question 2
(a) Define the term "water stress" in the context of resource sustainability. [2]
Answer: Water stress refers to the ratio of total water withdrawal to total renewable water resources in a given area, expressed as a percentage. When water withdrawals approach or exceed the available renewable supply (typically above 40%), the area is considered to be under water stress, indicating unsustainable water use that may lead to depletion of water sources, ecosystem degradation, and competition among users.
Marking notes:
- 1 mark for defining water stress as the relationship between water demand/withdrawal and available supply.
- 1 mark for linking it to sustainability (e.g., exceeding renewable supply, competition, depletion risk).
(b) Using Resource 2, compare the water stress situations of Egypt and Brazil. [3]
Answer: Egypt and Brazil represent contrasting water stress situations. Egypt has a water stress level of 135%, meaning it withdraws more water than its renewable resources provide (77.5 km³ withdrawn vs. 57.5 km³ available), indicating severe overexploitation. Its primary water use is agriculture. In contrast, Brazil has a water stress level of only 1%, withdrawing just 74.8 km³ from its vast renewable resources of 8,233 km³. Despite agriculture being its primary water use sector, Brazil's enormous water endowment means it faces minimal water stress. Egypt's situation is unsustainable in the long term, while Brazil's water resources remain largely underutilised relative to availability.
Marking notes:
- 1 mark for identifying the contrast (Egypt high stress vs. Brazil low stress).
- 1 mark for using specific data from Resource 2 to support the comparison.
- 1 mark for explaining the significance (e.g., Egypt's withdrawal exceeds supply; Brazil's vast resources buffer demand).
(c) Explain why the UAE has an exceptionally high water stress level despite its relatively small total water withdrawal. [2]
Answer: The UAE's water stress level of 2,667% is exceptionally high because its total renewable water resources are extremely limited (only 0.15 km³/year) due to its arid desert climate with minimal rainfall and no permanent rivers. Even a relatively small withdrawal of 4.0 km³/year represents nearly 27 times its renewable supply. The UAE relies heavily on desalination and groundwater extraction to meet demand, meaning its actual water consumption far exceeds what natural renewable sources can sustainably provide.
Marking notes:
- 1 mark for identifying the extremely low renewable water resource base (arid climate, minimal rainfall).
- 1 mark for explaining that the ratio is high because the denominator (renewable resources) is very small, not because the numerator (withdrawal) is exceptionally large.
Question 3
(a) Identify two advantages of locating solar farms in semi-arid regions, as suggested by Resource 3. [2]
Answer:
- High solar irradiance and clear skies — the photograph shows a clear sky with minimal cloud cover, indicating abundant and consistent sunlight for energy generation.
- Availability of large, flat, sparsely vegetated land — the semi-arid terrain shown is flat with low scrub vegetation, making it suitable for large-scale panel installation with minimal land-use conflict.
Marking notes:
- 1 mark per valid advantage linked to what is visible or inferable from Resource 3.
- Accept: reduced competition for agricultural land, lower land costs, high solar intensity.
(b) Discuss one environmental concern associated with large-scale solar farm development in semi-arid regions. [2]
Answer: Large-scale solar farms can disrupt fragile semi-arid ecosystems. The installation of solar panels and associated infrastructure (such as the transmission lines and maintenance building visible in Resource 3) can lead to habitat loss and fragmentation for native species. The sparse vegetation visible between panel rows may be further degraded during construction. Additionally, the reflective surfaces of solar panels can affect local microclimates and may pose risks to bird species (solar flux injuries). Water used for panel cleaning in water-scarce regions also competes with already limited water resources.
Marking notes:
- 1 mark for identifying a valid environmental concern.
- 1 mark for developing the explanation with specific reference to semi-arid contexts.
(c) Evaluate the extent to which solar energy can contribute to resource sustainability in water-scarce regions. [3]
Answer: Solar energy can significantly contribute to resource sustainability in water-scarce regions, but with limitations. On the positive side, solar PV technology requires minimal water for operation (mainly occasional panel cleaning), making it far less water-intensive than thermal power plants or even some forms of renewable energy like concentrated solar power (CSP) that use water for cooling. This reduces pressure on already scarce water resources. Solar energy also reduces dependence on fossil fuels, which require water for extraction and processing. However, solar energy alone cannot address all resource sustainability challenges. It is intermittent, requiring energy storage solutions (batteries) that involve resource-intensive mining for lithium and other materials. The manufacturing of solar panels also requires water and energy. Furthermore, solar farms require large land areas, which may compete with other land uses. Overall, solar energy is a valuable component of a sustainable resource strategy in water-scarce regions, but it must be complemented by demand management, efficiency improvements, and diversified energy sources.
Marking notes:
- 1 mark for explaining how solar energy contributes positively to water sustainability (low water demand, reduced fossil fuel dependence).
- 1 mark for acknowledging limitations (intermittency, manufacturing impacts, land use, storage requirements).
- 1 mark for a balanced evaluative conclusion that weighs both sides.
Section B: Structured and Extended Response (30 marks)
Question 4
(a) Explain the concept of "sustainable yield" in the context of renewable resource management. [3]
Answer: Sustainable yield refers to the maximum rate at which a renewable resource can be used without reducing its long-term productive capacity or ability to regenerate. It is the harvest or extraction rate that equals the natural replenishment rate of the resource. For example, in fisheries, sustainable yield is the number of fish that can be caught annually without causing the fish population to decline over time. In forestry, it is the volume of timber that can be harvested while allowing the forest to regenerate naturally. The concept is central to resource sustainability because it ensures that current use does not compromise the availability of the resource for future generations. However, calculating sustainable yield is complex because natural systems are dynamic and influenced by environmental variability, climate change, and human impacts.
Marking notes:
- 1 mark for defining sustainable yield (maximum use rate without depleting the resource).
- 1 mark for explaining the principle (harvest rate = regeneration rate).
- 1 mark for providing an example or linking to sustainability/future generations.
(b) Using a named example, discuss how overexploitation of a renewable resource can lead to long-term sustainability challenges. [5]
Answer: Overexploitation of renewable resources occurs when extraction exceeds the sustainable yield, leading to resource depletion and long-term sustainability challenges. A clear example is the overfishing of the North Atlantic cod stocks off the coast of Newfoundland, Canada. In the 1960s and 1970s, industrial fishing fleets using advanced technology (sonar, factory trawlers) harvested cod at rates far exceeding the stock's ability to reproduce. Despite warnings from scientists, fishing quotas were set too high due to political and economic pressures. By the early 1990s, cod populations had collapsed to less than 1% of their historical levels, leading to a government-imposed moratorium in 1992. The sustainability challenges that followed were severe: approximately 40,000 people lost their livelihoods, coastal communities experienced economic devastation, and the marine ecosystem was fundamentally altered. Even decades later, cod stocks have not fully recovered, demonstrating that overexploitation can cause irreversible damage to renewable resources. This case illustrates that renewable resources are only sustainable if managed within their regenerative capacity, and that short-term economic gains from overexploitation can lead to long-term ecological and socio-economic costs.
Marking notes:
- 1 mark for defining overexploitation in relation to sustainable yield.
- 1 mark for providing a specific, named example (Newfoundland cod, or another valid example such as deforestation in the Amazon, groundwater depletion in the Ogallala Aquifer).
- 2 marks for explaining the sustainability challenges that resulted (ecological, economic, social).
- 1 mark for a concluding point about the long-term implications or the importance of sustainable management.
Question 5
(a) Using Resource 4, identify two countries that are in ecological deficit and two countries that are in ecological reserve. [2]
Answer:
- Ecological deficit (footprint > biocapacity): USA (8.1 > 3.8), China (3.7 > 0.9), Germany (4.7 > 1.5), Japan (4.1 > 0.6)
- Ecological reserve (biocapacity > footprint): Australia (12.6 > 6.7), Brazil (8.9 > 2.8)
Marking notes:
- 1 mark for correctly identifying two countries in ecological deficit (any two from USA, China, Germany, Japan, or Nigeria).
- 1 mark for correctly identifying two countries in ecological reserve (Australia and Brazil).
- India (1.2 > 0.4) and Nigeria (1.1 > 0.8) are also in ecological deficit and are acceptable answers.
(b) Explain three factors that contribute to a country having a high ecological footprint. [4]
Answer:
- High levels of consumption and affluence — Wealthy countries with high per capita consumption of goods, energy, and resources (such as the USA) have larger ecological footprints because their citizens consume more food, energy, manufactured products, and services, all of which require land and resources to produce.
- Energy-intensive industrial and economic activities — Countries with large manufacturing sectors, heavy industry, and fossil fuel-dependent energy systems (such as China) have high footprints due to the resource inputs and emissions associated with production processes.
- High meat consumption and food production systems — Diets rich in animal products require significantly more land, water, and energy than plant-based diets. Countries with high per capita meat consumption (such as the USA and Australia) have larger footprints from agricultural land use and livestock emissions.
Marking notes:
- 1 mark per valid factor explained, up to 3 marks.
- 1 additional mark for linking factors to specific countries from Resource 4 or providing clear examples.
- Accept other valid factors: urban sprawl, car-dependent transport systems, high waste generation, reliance on imported goods.
(c) To what extent can technological innovation alone achieve resource sustainability? Discuss with reference to examples. [6]
Answer: Technological innovation is an important enabler of resource sustainability, but it cannot achieve sustainability on its own. Technology can improve resource efficiency, reduce waste, and enable the transition to cleaner energy sources. For example, advances in solar panel efficiency and battery storage have made renewable energy more viable, reducing dependence on fossil fuels. Precision agriculture technologies (GPS-guided equipment, drone monitoring, soil sensors) can optimise water and fertiliser use, reducing agricultural waste. In manufacturing, 3D printing and advanced materials can reduce material waste and energy consumption. The development of electric vehicles (EVs) offers the potential to reduce transport emissions, as seen in countries like Norway where EV adoption exceeds 80% of new car sales.
However, technological innovation alone is insufficient for several reasons. First, the Jevons Paradox (or rebound effect) means that efficiency gains can lead to increased overall consumption — for example, more fuel-efficient cars may encourage more driving, offsetting the per-unit savings. Second, technology does not address the root causes of overconsumption driven by economic growth models, consumer culture, and population growth. Third, technological solutions often create new environmental problems — for example, EV batteries require lithium and cobalt mining, which has significant environmental and social impacts in countries like the Democratic Republic of Congo. Fourth, technology adoption is uneven globally; developing countries may lack the financial resources and infrastructure to implement advanced technologies. Finally, achieving sustainability requires changes in behaviour, governance, economic systems, and values that technology cannot deliver on its own.
In conclusion, technological innovation is a necessary but not sufficient condition for resource sustainability. It must be accompanied by policy interventions (carbon pricing, regulations), behavioural changes (reduced consumption, sustainable lifestyles), and systemic shifts (circular economy, degrowth strategies) to achieve genuine sustainability.
Marking notes:
- 1–2 marks for explaining how technology contributes to sustainability with examples.
- 1–2 marks for discussing the limitations of technology alone (rebound effect, new problems, uneven access, need for behavioural/systemic change).
- 1–2 marks for a balanced evaluative conclusion that weighs both sides and reaches a substantiated judgement.
- Award higher marks for well-developed arguments, specific examples, and clear evaluative language ("to a large extent," "however," "on the other hand").
Question 6
(a) Describe the main features of a circular economy approach to resource management. [3]
Answer: A circular economy is an economic system designed to eliminate waste and keep resources in use for as long as possible. Its main features include: (1) Design for longevity and reuse — products are designed to be durable, repairable, and upgradable rather than disposable; (2) Recycling and material recovery — materials from end-of-life products are recovered and fed back into production cycles, reducing the need for virgin resource extraction; (3) Sharing and service models — instead of owning products, consumers access services (e.g., car-sharing, leasing), reducing overall resource consumption; (4) Industrial symbiosis — waste from one industry becomes input for another, creating closed-loop systems; and (5) Renewable energy use — the system is powered by renewable energy rather than fossil fuels. The circular economy contrasts with the traditional linear economy (take-make-dispose) and aims to decouple economic growth from resource depletion.
Marking notes:
- 1 mark per valid feature described, up to 3 marks.
- Accept: reduce-reuse-recycle hierarchy, closed-loop systems, cradle-to-cradle design, waste-as-resource concept.
(b) Assess the challenges faced by developing countries in transitioning from a linear to a circular economy. [5]
Answer: Developing countries face significant challenges in transitioning to a circular economy. First, financial constraints are a major barrier — circular economy infrastructure (recycling facilities, waste sorting systems, remanufacturing plants) requires substantial investment that many developing countries cannot afford. Second, informal waste sectors dominate in many developing countries (e.g., waste pickers in India, Brazil, and Kenya), and formalising these systems while protecting livelihoods is complex. Third, limited technological capacity means developing countries often lack the advanced recycling and material recovery technologies needed for effective circular systems. Fourth, weak governance and regulatory frameworks — many developing countries lack the environmental regulations, enforcement mechanisms, and institutional capacity to implement circular economy policies. Fifth, export of waste — developing countries have historically received waste from developed countries (e.g., plastic waste exports to Southeast Asia), creating dependency and environmental harm rather than circular systems. Sixth, rapid urbanisation and growing consumption in developing countries increases waste volumes faster than infrastructure can be developed. However, some developing countries are making progress — for example, Rwanda's ban on plastic bags and Kenya's restrictions on single-use plastics show that policy action is possible. International support, technology transfer, and capacity building are essential to help developing countries overcome these challenges.
Marking notes:
- 1 mark per valid challenge explained, up to 4 marks.
- 1 mark for acknowledging any positive developments or solutions (e.g., Rwanda's plastic ban, role of international support).
- Award higher marks for well-structured arguments with specific examples.
Question 7
Evaluate the effectiveness of international agreements in promoting global resource sustainability. In your answer, refer to at least one specific international agreement and consider both achievements and limitations. [8]
Answer: International agreements play a crucial but imperfect role in promoting global resource sustainability. They provide frameworks for collective action, set targets, and facilitate cooperation among nations. However, their effectiveness is often limited by enforcement challenges, sovereignty concerns, and the tension between economic development and environmental protection.
The Paris Agreement (2015) is a key example. Its achievements include: (1) near-universal participation (196 parties), demonstrating global recognition of the climate crisis; (2) the establishment of a long-term goal to limit warming to well below 2°C, with efforts to limit to 1.5°C; (3) the Nationally Determined Contributions (NDCs) mechanism, which allows countries to set their own targets while creating accountability through regular reporting and review; (4) the mobilisation of climate finance, with developed countries pledging $100 billion annually to support developing countries; and (5) catalysing national climate policies and private sector action in many countries.
However, the Paris Agreement has significant limitations: (1) NDCs are voluntary and not legally binding, meaning countries face no penalties for non-compliance; (2) current NDCs are insufficient to meet the 1.5°C target — even if fully implemented, they would lead to approximately 2.5–2.8°C of warming; (3) the $100 billion climate finance pledge has not been fully met, undermining trust and capacity in developing countries; (4) major emitters (USA, China, India) have not committed to sufficiently ambitious targets; and (5) the agreement lacks strong enforcement mechanisms, relying instead on peer pressure and transparency.
Other agreements show similar patterns. The Montreal Protocol (1987) is often cited as the most successful international environmental agreement, having phased out 99% of ozone-depleting substances through binding targets, financial mechanisms (Multilateral Fund), and trade restrictions on non-parties. Its success demonstrates that international agreements can be effective when they have clear targets, financial support, and enforcement mechanisms. In contrast, the Convention on Biological Diversity (CBD) and its Aichi Targets largely failed to halt biodiversity loss, partly because targets were too broad, monitoring was inadequate, and implementation was weak.
In conclusion, international agreements are necessary but not sufficient for global resource sustainability. They provide essential frameworks and norms, but their effectiveness depends on the ambition of commitments, the strength of enforcement mechanisms, the availability of financial resources, and the political will of participating nations. Agreements work best when they combine binding targets with financial support, technology transfer, and regular review mechanisms. Ultimately, international agreements must be complemented by national policies, private sector action, and civil society engagement to achieve meaningful progress toward resource sustainability.
Marking notes:
- 1–2 marks for introducing the role of international agreements and setting up the evaluation.
- 2–3 marks for discussing achievements of at least one specific agreement (Paris Agreement, Montreal Protocol, or other valid example) with concrete details.
- 2–3 marks for discussing limitations with specific evidence.
- 1–2 marks for a balanced evaluative conclusion that synthesises both sides and reaches a substantiated judgement.
- Award higher marks for: use of multiple agreements as evidence, specific data/figures, clear evaluative language, well-structured argument with introduction, body, and conclusion.
Mark Summary
| Question | Marks |
|---|---|
| 1(a) | 2 |
| 1(b) | 2 |
| 1(c) | 2 |
| 2(a) | 2 |
| 2(b) | 3 |
| 2(c) | 2 |
| 3(a) | 2 |
| 3(b) | 2 |
| 3(c) | 3 |
| 4(a) | 3 |
| 4(b) | 5 |
| 5(a) | 2 |
| 5(b) | 4 |
| 5(c) | 6 |
| 6(a) | 3 |
| 6(b) | 5 |
| 7 | 8 |
| Total | 60 |
Section A Total: 30 marks
Section B Total: 30 marks
Grand Total: 60 marks
Free quiz and exam paper access
Enter your details to view this paper
Your access is remembered on this device.