AI Generated Exam Paper
A Level H1 Geography Practice Paper 4
Free A Level H1 Geography Practice Paper 4, HY3 AI version, with questions, answers, and A Level-style practice for Singapore students.
These static practice materials are generated from the site's syllabus and paper-generation workflow, with source and model context shown so students and parents can evaluate the material before use.
Questions
Free quiz and exam paper access
Enter your details to view this paper
Your access is remembered on this device.
Answers
TuitionGoWhere Practice Paper Answer Key — Geography H1 A-Level (Version 4)
Total Marks: 50
Section A Answers
Q1 [5 marks]
Teaching note: Account = explain causes, not just describe. Use table data.
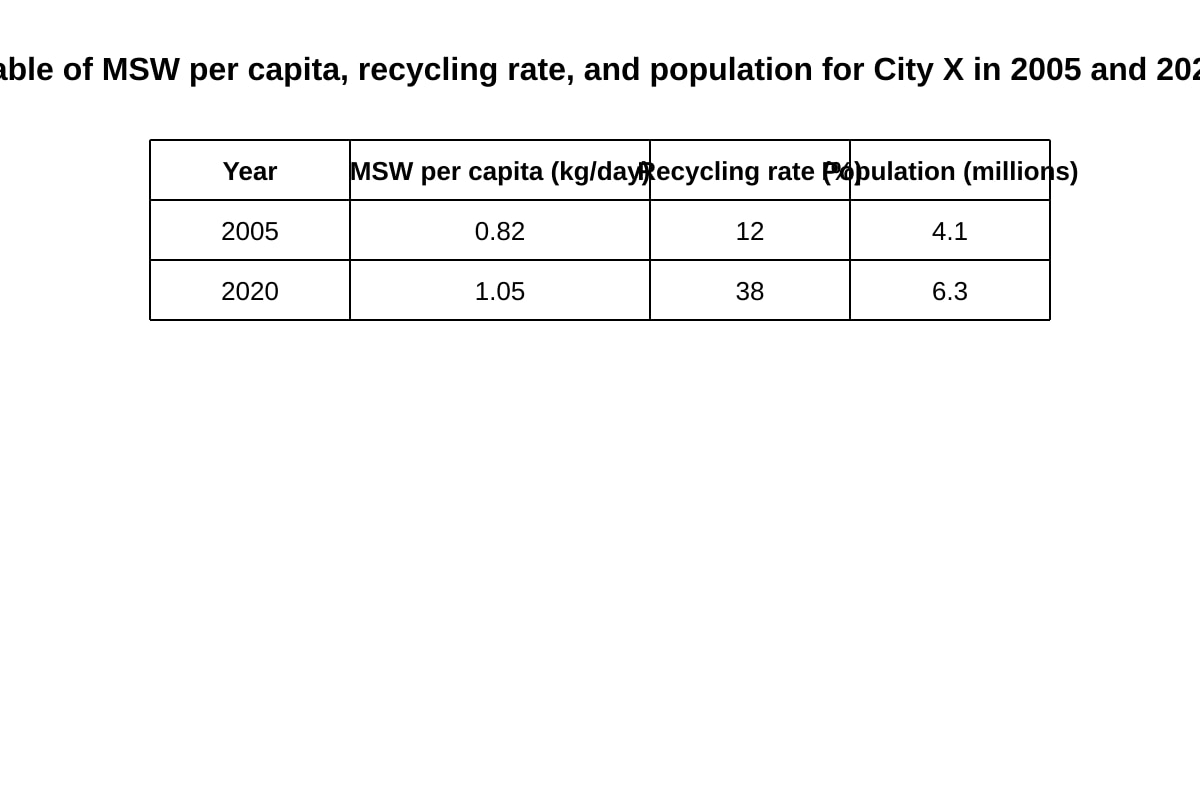
- MSW per capita rose from 0.82 to 1.05 kg/day (+28%). Cause: population growth 4.1→6.3M increased total consumption and absolute waste. [2]
- Recycling rate rose 12→38%, showing policy intervention diverted waste from landfill, yet per-capita still rose due to affluence. [2]
- Overall: increased urbanisation and income drove generation; recycling partially offset but not enough. [1]
Marking: 1 mark per valid causal point linked to data; final synthesis 1.
Q2 [5 marks]
Teaching note: Informal waste picking = unregulated recovery by marginalised groups.
- Characteristic 1: Low wages / insecure income → sustains poverty, limits social sustainability. [2]
- Characteristic 2: Recovers recyclables without protective gear → health risk, yet reduces landfill pressure (environmental benefit). [2]
- Link: Shows tension between liveability (for pickers) and sustainability. [1]
Q3 [6 marks]
Eval structure: Judgment + strengths/limits each + compare.
- Resource A: useful (official stats, clear output) but limited (self-reported, no spatial detail). [2]
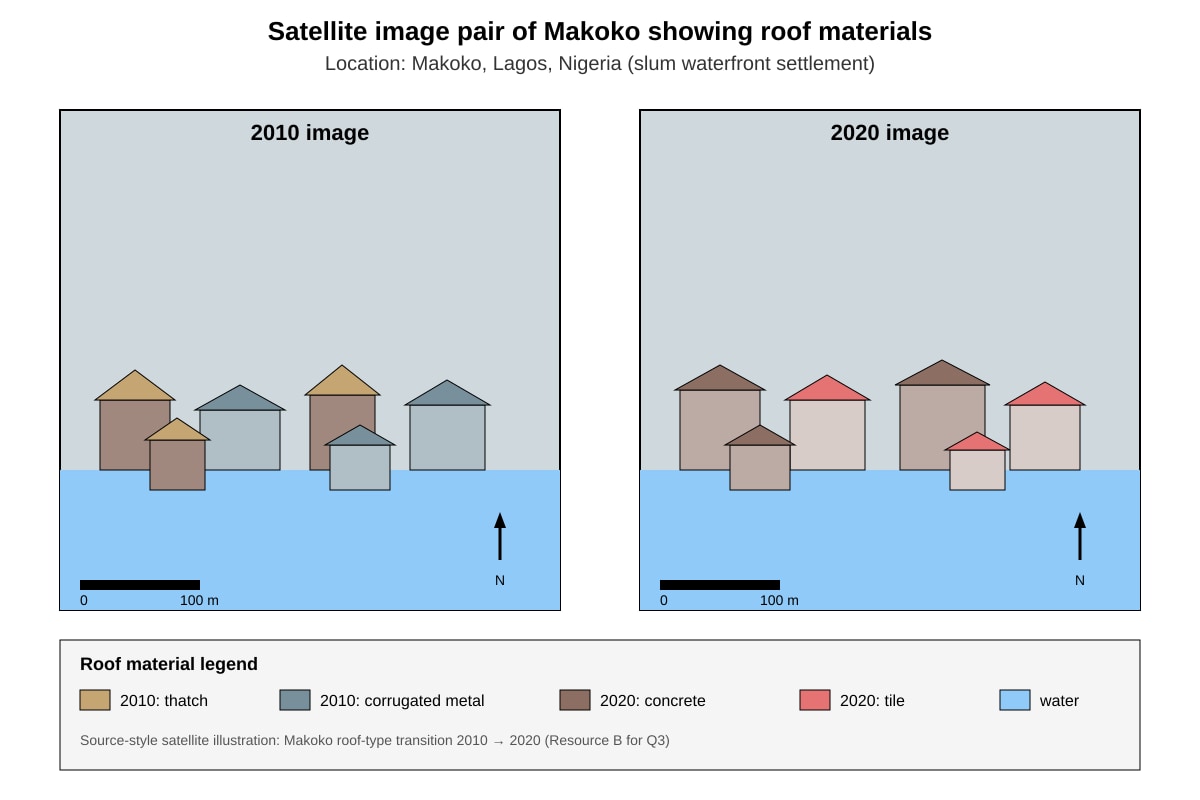
- Resource B: useful (visual change evidence, independent) but limited (cannot show service access, only housing). [2]
- Overall: complementary; B shows physical upgrade, A confirms service gain; together moderately useful. [2]
Q4 [7 marks]
Analyse extent:
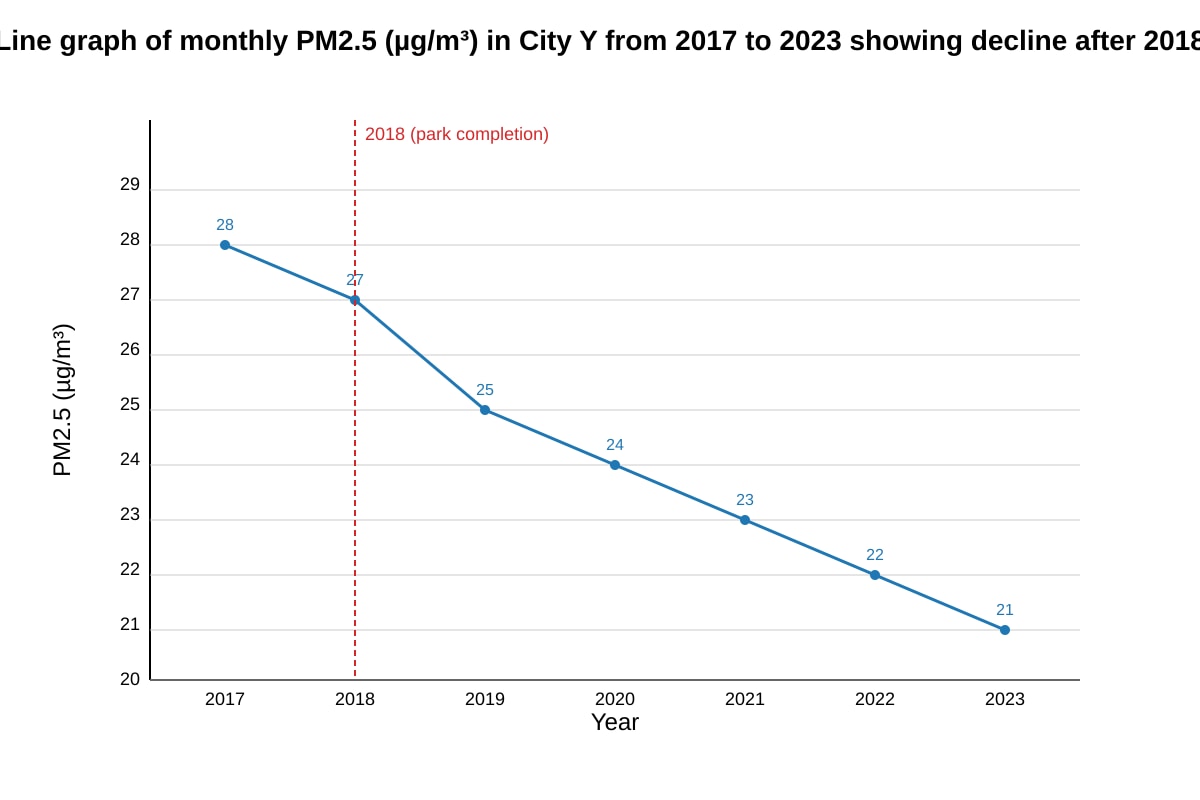
- Positive: 22 ha green space, active mobility +70% cuts transport emissions; PM2.5 −9% (graph). [3]
- Limits: 9% small vs citywide; solar lighting minor vs total energy; reimaging may raise land values, displacing poor. [3]
- Extent: moderate contribution to environmental sustainability, social equity less clear. [1]
Q5 [7 marks]
Eval statement:
- For: women bear care burden, exposed to unsafe waste sites; gender-sensitive siting improves liveability. [3]
- Against/limit: adds cost, may not address root consumption. [2]
- Judg: essential in social dimension, but must pair with technical measures. [2]
Section B Answers
Q6 [8 marks]
Describe + explain:
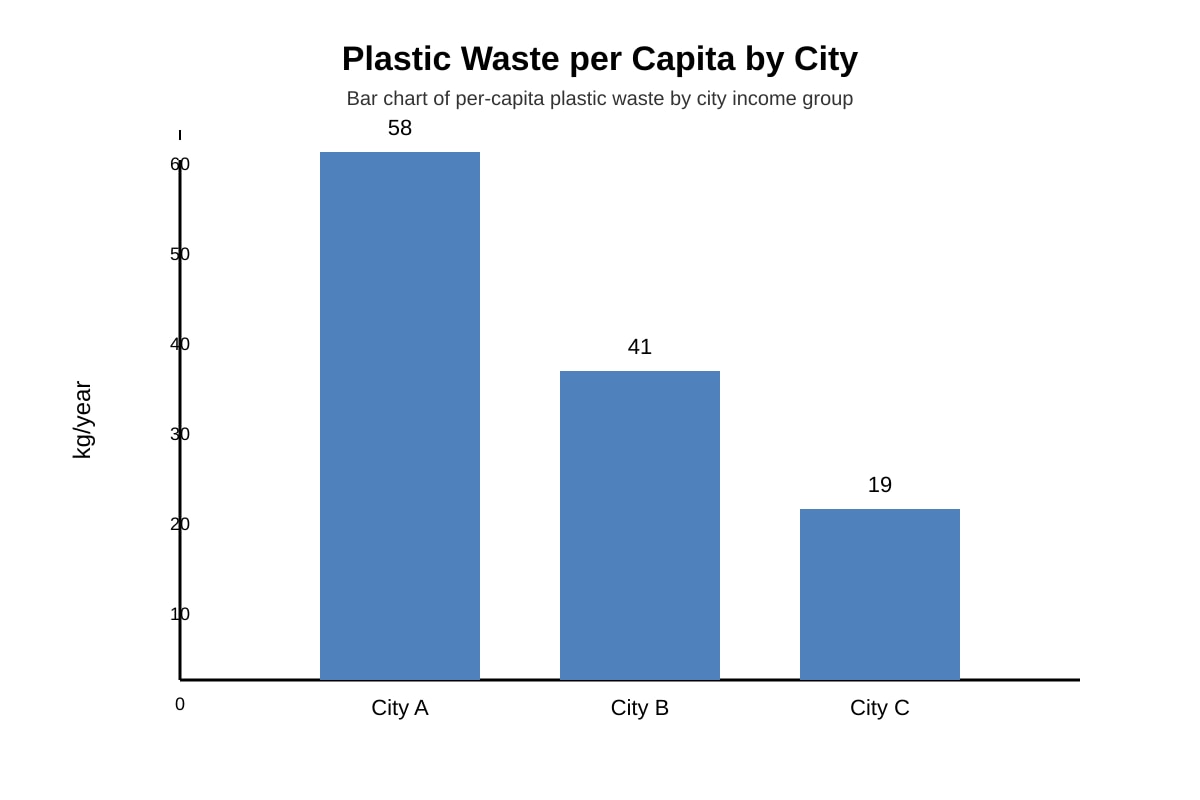
- Pattern: A (58) > B (41) > C (19); higher income = more plastic waste. [2 desc]
- Explain A: high consumption, packaging culture, formal collection enables measurement. [2]
- Explain C: lower income, less packaged goods, informal reuse. [2]
- Note: collection type affects data visibility. [2]
Q7 [6 marks]
- Reason 1: Informal sector means waste not captured in stats; actual leakage to environment high. [3]
- Reason 2: Low absolute waste due to deprivation, not good management; liveability low. [3]
Q8 [6 marks]
Eval claim:
- Challenge: elderly-friendly transport (e.g., lifts) uses energy but reduces car use; net may help. [3]
- Counter: poor design wastes resources. Conclusion: not always; depends on strategy. [3]