AI Generated Exam Paper
A Level H1 Geography Practice Paper 3
Free A Level H1 Geography Practice Paper 3, LongCat AI version, with questions, answers, and A Level-style practice for Singapore students.
These static practice materials are generated from the site's syllabus and paper-generation workflow, with source and model context shown so students and parents can evaluate the material before use.
Questions
TuitionGoWhere Practice Paper - Geography H1 A-Level
TuitionGoWhere Practice Paper (AI)
Subject: Geography Level: A-Level H1 Paper: Practice Paper — Resources & Sustainability Version: 3 of 5 Duration: 1 hour 30 minutes Total Marks: 50
Name: ___________________________ Class: ___________________________ Date: ___________________________
Instructions
- Answer all questions in Section A and Section B.
- Write your answers in the spaces provided.
- The number of marks for each question or part-question is shown in brackets [ ].
- Begin each section on a fresh page.
- Credit will be given for the use of relevant examples and case studies.
- Where a question refers to a resource, study the resource carefully before answering.
- You may use a calculator where appropriate.
Section A: Data-Based Questions (25 marks)
Answer all questions in this section.
Question 1
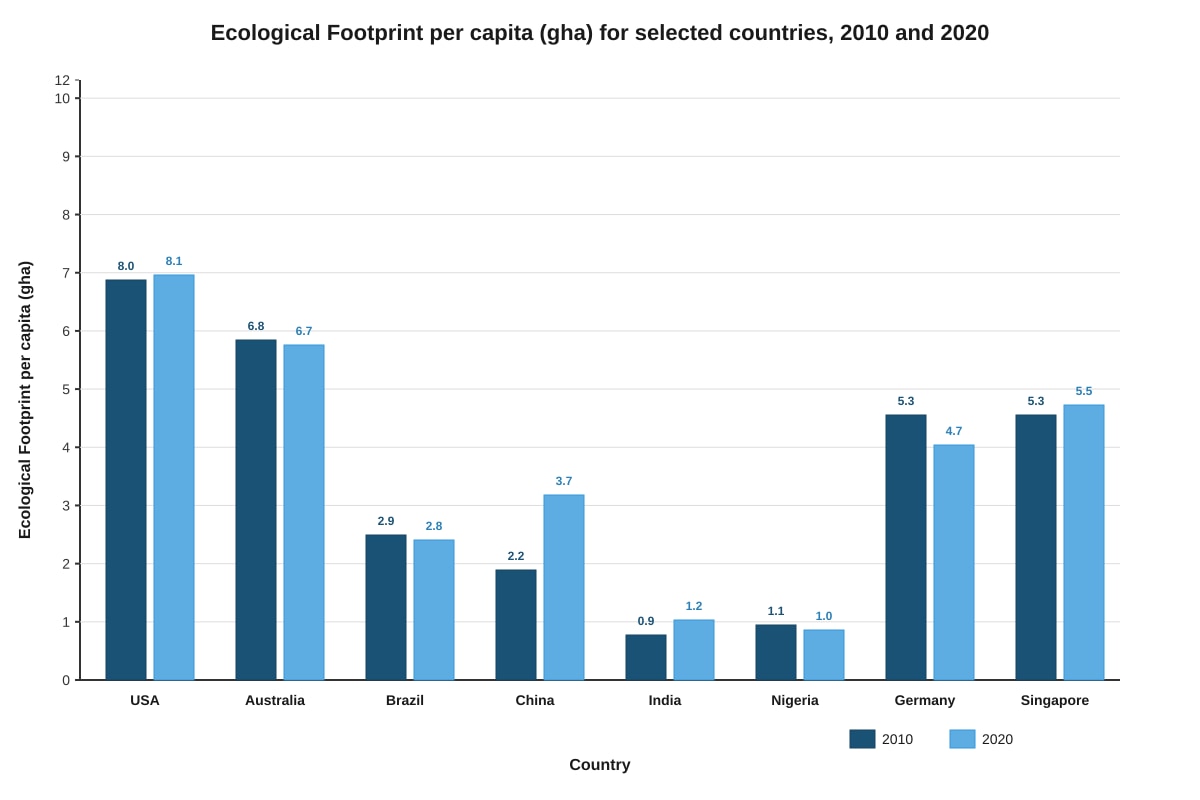
Study Resource A below, which shows the global Ecological Footprint per capita (in global hectares, gha) for selected countries in 2010 and 2020.
Generated chart for Q1.
Resource A: Ecological Footprint per capita (gha) for selected countries, 2010 and 2020
(a) State the country with the largest increase in Ecological Footprint per capita between 2010 and 2020. [1]
(b) Calculate the percentage change in China's Ecological Footprint per capita between 2010 and 2020. Show your working. [2]
(c) Suggest two reasons why some high-income countries have seen a decrease in their Ecological Footprint per capita between 2010 and 2020. [2]
Question 2
Study Resource B, which is an extract from a report on water scarcity in Cape Town, South Africa.
Resource B
Cape Town, a city of over 4 million people, faced an unprecedented water crisis in 2017–2018, dubbed "Day Zero" — the day when municipal water supplies would be largely shut off. Dam levels dropped below 20% capacity due to three consecutive years of below-average rainfall, linked to changing climate patterns. Rapid population growth (averaging 2.6% per year from 2005 to 2015) increased water demand, while aging infrastructure led to significant water losses through leakage — estimated at 15–20% of total supply. Agricultural water use in the surrounding Western Cape province accounted for approximately 30% of regional water consumption. The city implemented emergency measures including strict water restrictions (50 litres per person per day), agricultural water reallocation, public awareness campaigns, and investment in desalination plants and groundwater extraction. By mid-2018, dam levels had recovered to over 50% following above-average winter rainfall and reduced consumption.
(a) Using Resource B, identify two physical (natural) causes of Cape Town's water crisis. [2]
(b) Using Resource B, explain how human factors contributed to the severity of the water crisis. [3]
(c) Evaluate the effectiveness of the measures taken by Cape Town to manage its water crisis. [4]
Question 3
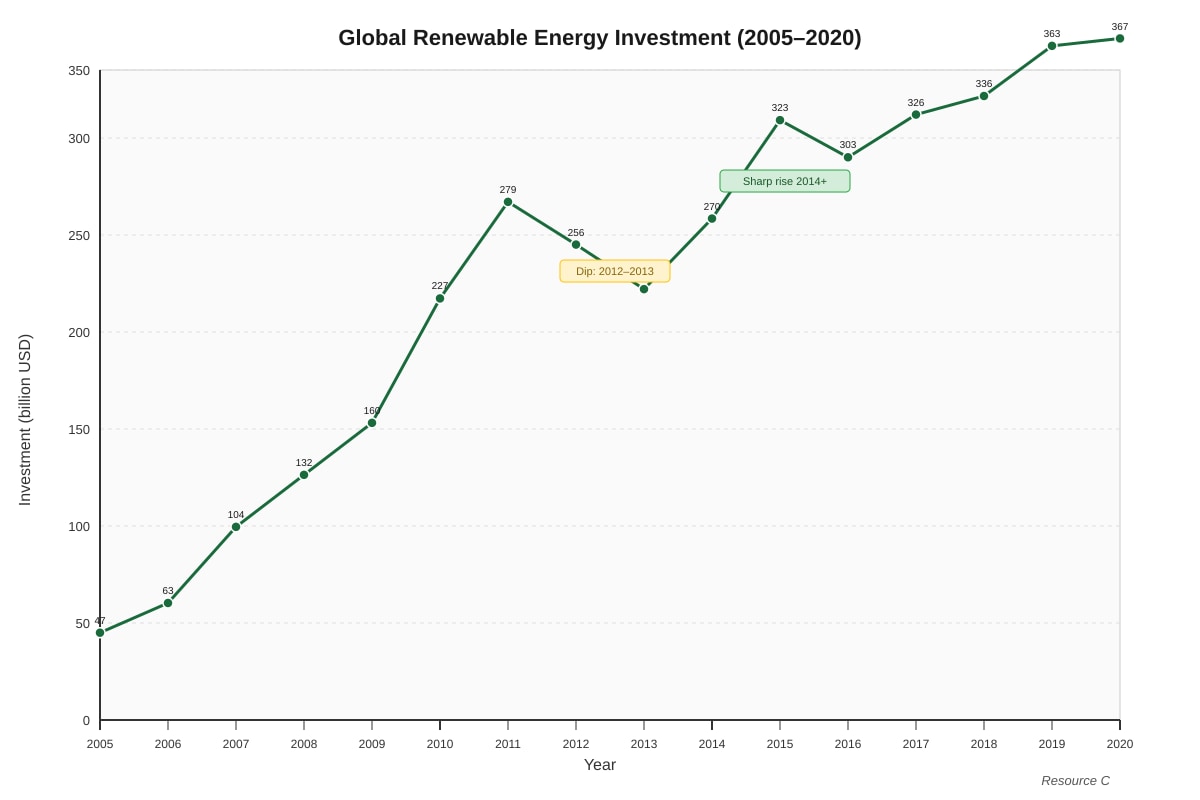
Study Resource C, which shows a graph of global renewable energy investment (in billion USD) from 2005 to 2020.
Generated image for this question.
id: Q3-fig1 type: graph linked_question: Q3 description: A line graph showing global renewable energy investment (billion USD) from 2005 to 2020. The line shows a general upward trend with a dip around 2012–2013 and a sharp rise from 2014 onwards. labels: x-axis: Year (2005–2020); y-axis: Investment (billion USD), scale 0–350 values: 2005=47, 2006=63, 2007=104, 2008=132, 2009=160, 2010=227, 2011=279, 2012=256, 2013=232, 2014=270, 2015=323, 2016=303, 2017=326, 2018=336, 2019=363, 2020=367 must_show: Clear upward trend, visible dip 2012–2013, sharp rise 2014+, all data points plotted, axes labelled with units </image_resource>
Resource C: Global renewable energy investment (billion USD), 2005–2020
(a) Describe the trend in global renewable energy investment between 2005 and 2020. [2]
(b) Suggest two reasons for the dip in investment between 2011 and 2013. [2]
(c) Explain why renewable energy investment is important for achieving resource sustainability. [3]
Section B: Structured Response Questions (25 marks)
Answer all questions in this section.
Question 4
(a) Define the term sustainable development. [2]
(b) Explain why achieving sustainable development is challenging for developing countries. [4]
Question 5
Study Resource D, which shows a table of food waste data for selected countries.
| Country | Food waste per capita (kg/year) | % of food wasted at consumer level | GDP per capita (USD) |
|---|---|---|---|
| USA | 59 | 42% | 63,544 |
| Germany | 75 | 32% | 51,204 |
| South Korea | 71 | 28% | 34,998 |
| Brazil | 60 | 18% | 8,917 |
| India | 50 | 5% | 2,277 |
| Nigeria | 73 | 3% | 2,097 |
Resource D: Food waste data for selected countries
(a) Using Resource D, describe the relationship between GDP per capita and the percentage of food wasted at the consumer level. [2]
(b) Suggest reasons for the pattern you described in (a). [3]
(c) Evaluate the effectiveness of two strategies that could be used to reduce food waste in high-income countries. [4]
Question 6
(a) Explain how the concept of the ecological footprint can be used to measure resource sustainability. [3]
(b) "Economic growth and resource sustainability are incompatible." How far do you agree with this statement? Use examples to support your answer. [6]
End of Practice Paper
Total Marks: 25 + 25 = 50
Answers
TuitionGoWhere Practice Paper — Geography H1 A-Level
Answer Key & Marking Scheme
Subject: Geography | Level: A-Level H1 | Paper: Practice Paper — Resources & Sustainability Version: 3 of 5 | Total Marks: 50
Section A: Data-Based Questions (25 marks)
Question 1
(a) State the country with the largest increase in Ecological Footprint per capita between 2010 and 2020. [1]
Answer: China
Marking: 1 mark for correctly identifying China.
Teaching Note: China's footprint rose from 2.2 gha to 3.7 gha — an increase of 1.5 gha, the largest absolute increase among all listed countries. Students should compare the difference between 2010 and 2020 values for each country to determine this.
(b) Calculate the percentage change in China's Ecological Footprint per capita between 2010 and 2020. Show your working. [2]
Answer:
Percentage change=Old valueNew value−Old value×100%
=2.23.7−2.2×100%
=2.21.5×100%
=68.2% (to 1 d.p.)
Marking:
- 1 mark for correct formula/method.
- 1 mark for correct answer (68.2% or 68%). Accept 68% if rounded to nearest whole number.
Common Mistake: Students may divide by the new value (3.7) instead of the old value (2.2). The denominator must be the original (2010) value.
(c) Suggest two reasons why some high-income countries have seen a decrease in their Ecological Footprint per capita between 2010 and 2020. [2]
Answer (any two of the following, 1 mark each):
-
Increased use of renewable energy sources — Countries like Germany have invested heavily in wind and solar power, reducing their reliance on fossil fuels and lowering their carbon footprint component of the ecological footprint.
-
Greater environmental awareness and government policies — Implementation of carbon taxes, emissions trading schemes, and stricter environmental regulations have encouraged more sustainable consumption and production patterns.
-
Improved energy efficiency — Advances in technology and building standards have reduced energy consumption per unit of GDP, lowering the overall resource demand per capita.
-
Shift towards service-based economies — As high-income countries transition from manufacturing to service-oriented economies, the resource intensity of economic activity tends to decrease.
Marking: 1 mark per valid, clearly explained reason. Do not award marks for vague answers such as "they are more environmentally friendly" without specifying a mechanism.
Question 2
(a) Using Resource B, identify two physical (natural) causes of Cape Town's water crisis. [2]
Answer (1 mark each):
- Three consecutive years of below-average rainfall.
- Changing climate patterns (linked to reduced rainfall).
Marking: 1 mark per correct identification, must be drawn from Resource B. Answers must refer to natural/climatic factors, not human factors.
Common Mistake: Students may confuse physical causes with human causes (e.g., population growth, aging infrastructure). Physical causes relate to natural processes such as rainfall variability and climate change.
(b) Using Resource B, explain how human factors contributed to the severity of the water crisis. [3]
Answer:
-
Rapid population growth — The city's population grew at 2.6% per year from 2005 to 2015, significantly increasing total water demand and placing greater pressure on already limited dam supplies. [1]
-
Aging infrastructure leading to water losses — Leakage from old pipes and systems caused an estimated 15–20% of total water supply to be lost before reaching consumers, reducing the effective supply available during the crisis. [1]
-
High agricultural water use — Agriculture in the surrounding Western Cape province consumed approximately 30% of regional water, competing with urban domestic demand and reducing the water available for Cape Town's residents. [1]
Marking: 1 mark per human factor, clearly explained with reference to Resource B. Students must explain how the factor worsened the crisis, not just identify it.
Teaching Note: The key skill here is linking the human factor to the crisis outcome. For example, it is not enough to say "population growth" — students must explain that more people means greater water demand, which depletes dam reserves faster.
(c) Evaluate the effectiveness of the measures taken by Cape Town to manage its water crisis. [4]
Answer:
Level 2 (3–4 marks) response should include:
Short-term effectiveness:
- Strict water restrictions (50 litres/person/day) were highly effective in the short term — they dramatically reduced daily consumption and delayed Day Zero. Public compliance was high due to the visible threat of dam depletion.
- Public awareness campaigns helped change behaviour, with residents adopting water-saving habits such as shorter showers and reusing greywater.
Long-term effectiveness:
- Desalination plants and groundwater extraction provided alternative water sources, reducing dependence on rainfall. However, desalination is energy-intensive and expensive, making it less sustainable as a long-term solution.
- Agricultural water reallocation freed up water for urban use but may have harmed farming livelihoods and food production in the region.
Limitations:
- The recovery of dam levels to over 50% by mid-2018 was partly due to above-average winter rainfall — a natural factor — suggesting that the measures alone may not have been sufficient without favourable weather conditions.
- Some emergency measures (e.g., desalination) were costly and may not be financially sustainable for long-term implementation.
Marking Descriptors:
| Marks | Descriptor |
|---|---|
| 1–2 | Describes the measures with limited or no evaluation. Lacks reference to Resource B or fails to assess effectiveness. |
| 3–4 | Evaluates the effectiveness of at least two measures, considering both strengths and limitations. Uses evidence from Resource B. Shows awareness of short-term vs. long-term effectiveness. |
Common Mistake: Students often describe the measures without evaluating them. Evaluation requires making a judgement about how well the measures worked, considering both positive outcomes and limitations.
Question 3
(a) Describe the trend in global renewable energy investment between 2005 and 2020. [2]
Answer:
Global renewable energy investment showed an overall upward trend between 2005 and 2020, rising from approximately 47billionin2005to367 billion in 2020. However, there was a notable dip between 2011 (279billion)and2013(232 billion), after which investment recovered and increased sharply from 2014 onwards, reaching its highest level in 2020.
Marking:
- 1 mark for identifying the overall upward trend.
- 1 mark for noting the dip/fluctuation between 2011–2013 (or specific years/figures).
Teaching Note: A good trend description should include: direction of change, specific figures to support the description, and any anomalies or fluctuations. Students should avoid vague statements like "it increased a lot" without quantifying.
(b) Suggest two reasons for the dip in investment between 2011 and 2013. [2]
Answer (any two of the following, 1 mark each):
-
Global economic uncertainty following the 2008 financial crisis — Many governments reduced subsidies and incentives for renewable energy as part of austerity measures, leading to decreased investment.
-
Reduction in the cost of fossil fuels — The shale gas boom in the USA and falling oil prices during this period made fossil fuels more economically competitive, reducing the relative attractiveness of renewable energy investment.
-
Policy changes in key markets — Some European countries (e.g., Spain, Italy) cut feed-in tariffs and renewable energy subsidies due to budget constraints, leading to reduced investment in those markets.
Marking: 1 mark per valid reason. Answers must be specific to the 2011–2013 period.
(c) Explain why renewable energy investment is important for achieving resource sustainability. [3]
Answer:
-
Reduces dependence on finite fossil fuels — Renewable energy sources such as solar, wind, and hydroelectric power are replenished naturally and do not deplete over time, unlike coal, oil, and natural gas which are finite resources. Investing in renewables extends the longevity of global energy supplies. [1]
-
Reduces greenhouse gas emissions — Renewable energy generates electricity with significantly lower carbon emissions compared to fossil fuels, helping to mitigate climate change and reduce the environmental degradation associated with resource extraction and combustion. [1]
-
Promotes long-term energy security — Diversifying the energy mix through renewable sources reduces vulnerability to fossil fuel price volatility and supply disruptions, ensuring more stable and sustainable energy access for future generations. [1]
Marking: 1 mark per well-explained point. Students must explain the link between renewable energy investment and resource sustainability, not just state that renewables are "better for the environment."
Section B: Structured Response Questions (25 marks)
Question 4
(a) Define the term sustainable development. [2]
Answer:
Sustainable development is development that meets the needs of the present without compromising the ability of future generations to meet their own needs. (Brundtland Commission, 1987)
Marking:
- 1 mark for the core idea of meeting present needs.
- 1 mark for the idea of not compromising future generations' needs.
Teaching Note: This is the standard Brundtland definition. Students should memorise it precisely. Alternative phrasings that convey the same meaning (e.g., "balancing current resource use with the needs of future generations") are acceptable.
(b) Explain why achieving sustainable development is challenging for developing countries. [4]
Answer:
-
Poverty and immediate survival needs — Many developing countries face high poverty rates, forcing communities to prioritise immediate economic survival over long-term environmental sustainability. For example, deforestation for subsistence agriculture or fuel wood may be necessary for short-term livelihoods even though it degrades resources. [1]
-
Rapid population growth — High population growth rates in many developing countries increase pressure on finite resources such as water, arable land, and energy, making it difficult to balance development with conservation. [1]
-
Limited financial resources and technology — Developing countries often lack the capital and advanced technology needed to invest in sustainable infrastructure (e.g., renewable energy, waste management systems, efficient public transport), making it harder to pursue sustainable pathways. [1]
-
Dependence on primary industries — Many developing economies rely heavily on resource extraction (mining, logging, agriculture) for export revenue, creating economic incentives to exploit resources unsustainably. [1]
-
Weak governance and institutional capacity — Inadequate environmental regulations, corruption, and limited enforcement capacity can undermine sustainable development efforts, even when policies exist on paper. [1]
Marking: 1 mark per valid point, up to 4 marks. Points must be explained, not just stated. For example, "poverty" alone is not enough — students must explain how poverty makes sustainable development harder.
Question 5
(a) Using Resource D, describe the relationship between GDP per capita and the percentage of food wasted at the consumer level. [2]
Answer:
There is a general positive relationship between GDP per capita and the percentage of food wasted at the consumer level. Countries with higher GDP per capita tend to waste a higher proportion of food at the consumer level. For example, the USA (GDP per capita 63,544)wastes422,097) wastes only 3%. However, the relationship is not perfectly linear — Germany has a higher GDP than South Korea but wastes a lower percentage at the consumer level (32% vs. 28%).
Marking:
- 1 mark for identifying the positive/correlation relationship.
- 1 mark for using specific data from Resource D to support the description.
Common Mistake: Students may claim a perfect correlation. It is important to note the general trend while acknowledging exceptions.
(b) Suggest reasons for the pattern you described in (a). [3]
Answer:
-
Higher disposable incomes in high-GDP countries — Wealthier consumers can afford to buy more food than they need, leading to over-purchasing and subsequent waste. In lower-income countries, food represents a larger proportion of household expenditure, so consumers are more careful about not wasting it. [1]
-
Consumer culture and aesthetic standards — In high-income countries, supermarkets and consumers often reject food based on cosmetic appearance (e.g., misshapen fruits and vegetables), leading to significant waste. Strict cosmetic standards in supply chains also result in edible food being discarded before it reaches consumers. [1]
-
Lack of food preservation infrastructure in low-income countries — While this may seem counterintuitive, in many low-income countries, food is wasted primarily at the production and distribution stages (due to poor storage and transport) rather than at the consumer level. Consumers in these countries tend to use food more efficiently because of economic necessity. [1]
Marking: 1 mark per well-explained reason. Reasons must address why higher GDP correlates with higher consumer-level food waste.
(c) Evaluate the effectiveness of two strategies that could be used to reduce food waste in high-income countries. [4]
Answer:
Strategy 1: Public awareness campaigns (e.g., "Love Food Hate Waste" in the UK)
- Strengths: These campaigns educate consumers about the environmental and economic impacts of food waste, encouraging behavioural changes such as better meal planning, understanding date labels, and using leftovers. They are relatively low-cost to implement and can reach large audiences through media and social media.
- Limitations: Behaviour change is slow and difficult to sustain. Campaigns may not reach all demographic groups equally, and awareness does not always translate into action. The impact is hard to measure and may plateau over time.
Strategy 2: Legislation and regulation (e.g., France's law banning supermarkets from throwing away unsold food)
- Strengths: Mandatory laws create a structural change that does not rely on individual voluntary action. France's 2016 law required supermarkets over 400 m² to donate unsold food to charities, directly redirecting waste to those in need. This has a measurable and immediate impact on food waste reduction.
- Limitations: Enforcement can be challenging, and compliance costs may be passed on to consumers. Legislation alone does not address consumer-level waste, which accounts for the largest share of food waste in high-income countries. Small businesses may be disproportionately affected.
Marking Descriptors:
| Marks | Descriptor |
|---|---|
| 1–2 | Describes one or two strategies with limited evaluation. May only discuss strengths or limitations, not both. |
| 3–4 | Evaluates two strategies, discussing both strengths and limitations of each. Provides specific examples and makes a reasoned judgement about effectiveness. |
Common Mistake: Students often describe strategies without evaluating them. Evaluation requires weighing up pros and cons and making a judgement.
Question 6
(a) Explain how the concept of the ecological footprint can be used to measure resource sustainability. [3]
Answer:
-
The ecological footprint measures the amount of biologically productive land and water area required to support a population's consumption and absorb its waste, using global hectares (gha) as a standardised unit. This provides a quantifiable measure of human demand on Earth's ecosystems. [1]
-
By comparing the ecological footprint to the available biocapacity (the Earth's ability to regenerate resources and absorb waste), we can determine whether a population is living within or exceeding its ecological means. If the footprint exceeds biocapacity, the population is in "ecological deficit," indicating unsustainable resource use. [1]
-
Tracking ecological footprint over time allows assessment of whether resource use is becoming more or less sustainable. For example, if a country's per capita footprint is decreasing while its population's needs are still being met, this suggests progress toward sustainability. It also enables comparisons between countries to identify which consumption patterns are most unsustainable. [1]
Marking: 1 mark per well-explained point. Students must explain how the ecological footprint serves as a measurement tool, not just define it.
(b) "Economic growth and resource sustainability are incompatible." How far do you agree with this statement? Use examples to support your answer. [6]
Answer:
Introduction: The relationship between economic growth and resource sustainability is complex. While traditional models of economic growth have often relied on the unsustainable exploitation of natural resources, it is possible to achieve economic growth alongside improved resource sustainability through deliberate policy choices, technological innovation, and shifts in consumption patterns.
Arguments that they ARE incompatible (agreeing with the statement):
-
Historical evidence of environmental degradation — Rapid industrialisation in countries like China and India has led to severe air and water pollution, deforestation, and soil degradation. China's GDP growth averaging 9–10% per year from 2000 to 2015 came at the cost of massive coal consumption, making it the world's largest CO₂ emitter. This suggests that economic growth, particularly in the early stages of development, often requires unsustainable resource exploitation.
-
The Jevons Paradox — Improvements in resource efficiency can lead to increased overall consumption rather than reduced use. For example, more fuel-efficient cars may encourage people to drive more, negating the resource savings. This suggests that technological solutions alone cannot reconcile growth with sustainability.
-
Tragedy of the commons — In the absence of strong regulation, individual economic actors have incentives to overexploit shared resources (e.g., overfishing, deforestation) for short-term profit, undermining long-term sustainability.
Arguments that they ARE compatible (disagreeing with the statement):
-
Decoupling of GDP growth from resource use — Some countries have demonstrated that it is possible to grow their economies while reducing environmental impact. Germany, for example, increased its GDP by approximately 15% between 2005 and 2020 while reducing its Ecological Footprint per capita from 5.3 to 4.7 gha, largely through investment in renewable energy and energy efficiency.
-
The circular economy model — Countries like the Netherlands and Japan have adopted circular economy principles, designing products for reuse, recycling, and remanufacturing. This reduces waste and resource consumption while creating new economic opportunities and jobs in the green economy sector.
-
Green growth strategies — Costa Rica has achieved significant economic growth while maintaining over 98% renewable electricity generation and increasing forest cover from 26% in 1983 to over 52% in 2020 through payment for ecosystem services (PES) programmes. This demonstrates that economic development and environmental sustainability can be mutually reinforcing.
Conclusion: While economic growth has historically been associated with unsustainable resource use, it is not inherently incompatible with sustainability. The key lies in the type of growth pursued — whether it is resource-intensive or knowledge- and service-based — and the strength of environmental governance. With appropriate policies, technological innovation, and a shift in societal values, economic growth and resource sustainability can be pursued simultaneously, though this requires deliberate and sustained effort.
Marking Descriptors:
| Marks | Descriptor |
|---|---|
| 1–2 | States a position with limited or no development. Lacks examples or geographical terminology. |
| 3–4 | Presents arguments for one side of the argument with some supporting examples. Limited counter-argument or evaluation. |
| 5–6 | Presents a balanced argument with well-developed points on both sides. Uses specific, relevant examples. Reaches a clear, well-supported conclusion. Uses appropriate geographical terminology throughout. |
Common Mistake: Students often present only one side of the argument. For a "how far do you agree" question, examiners expect a balanced discussion with a reasoned conclusion. The conclusion should directly answer the question and be supported by the evidence presented in the essay.
End of Answer Key
Section A Total: 25 marks | Section B Total: 25 marks | Grand Total: 50 marks
Free quiz and exam paper access
Enter your details to view this paper
Your access is remembered on this device.