AI Generated Exam Paper
A Level H1 Geography Practice Paper 3
Free A Level H1 Geography Practice Paper 3, HY3 AI version, with questions, answers, and A Level-style practice for Singapore students.
These static practice materials are generated from the site's syllabus and paper-generation workflow, with source and model context shown so students and parents can evaluate the material before use.
Questions
Free quiz and exam paper access
Enter your details to view this paper
Your access is remembered on this device.
Answers
TuitionGoWhere Practice Paper — Geography H1 A-Level (Version 3) Answer Key
Total Marks: 50
Section A: 20 | Section B: 20 | Section C: 10 (answer one)
Section A Answers
Q1 [5 marks]
Teaching note: Account means give reasons, not just describe. Use data as evidence.
- Recycling rose from 22% (2015) to 48% (2022). [1 mark for stating trend with data]
- Causal factor 1: Introduction of mandatory curbside recycling law in 2016 increased collection access. [1]
- Causal factor 2: Public education campaigns raised awareness of landfill scarcity. [1]
- Causal factor 3: Expansion of materials recovery facilities improved processing capacity. [1]
- Link: Each factor supported behavioural and systemic change, explaining the 26-point gain. [1]
Common mistake: Only describing the table without "because".
Q2 [5 marks]
Teaching note: Characteristics = features of the change shown.
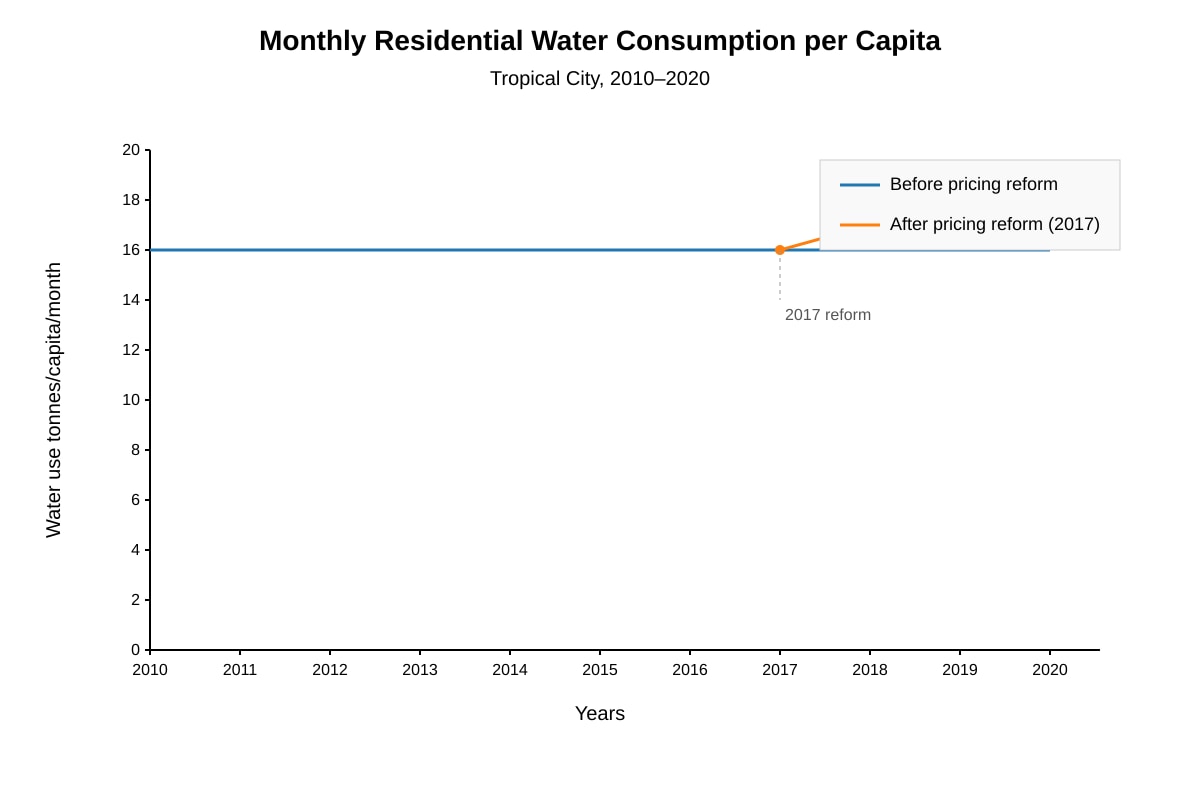
- After 2017, consumption dropped from ~16t to ~11t per capita/month. [1]
- The "after reform" line diverges downward from "before" steady line. [1]
- Decline was gradual 2017–2020, showing price elasticity of demand. [1]
- Gap widened over time, indicating sustained behaviour change. [1]
- No rebound to pre-reform level by 2020. [1]
Marking: 1 mark per clear characteristic with reference to graph.
Q3 [10 marks]
(a) [2] Face-to-face allowed clarification of questions for elderly respondents and higher response rate. (Any valid reason: 2 marks)
(b) [3] Risk: Non-response bias if residents unavailable daytime. Mitigation: Evening/weekend slots + online follow-up. (1+2)
(c) [5] Evaluation:
- Strength: Questionnaire gives attitudes; bill data gives actual use – triangulated. [1]
- Strength: Local scale relevant to Tampines policy. [1]
- Limitation: Self-reported behaviour may be exaggerated. [1]
- Limitation: 50 bills not fully representative. [1]
- Judgement: Useful but limited by sample size and social desirability bias. [1]
Section B Answers
Q4 [7 marks]
Teaching note: Evaluate = weigh usefulness and limits.
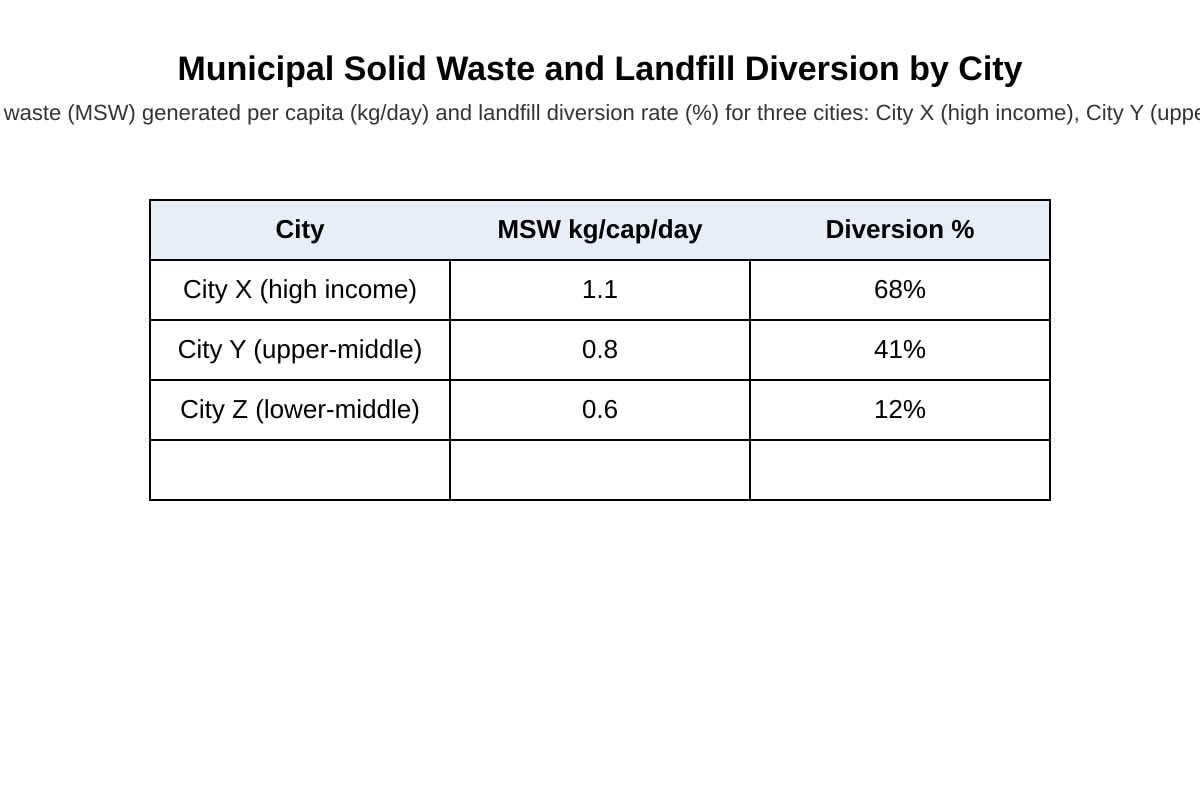
- Usefulness: Data shows clear pattern – higher income = higher MSW but higher diversion. [1]
- X (high income) 68% diversion shows capacity. [1]
- Z (lower-middle) 12% shows policy gap. [1]
- Limitation: Only 3 cities, not generalizable. [1]
- Limitation: No cause shown (income correlation not causation). [1]
- Judgement: Useful for hypothesis but needs qualitative support. [1]
Marking descriptors: L3 (6–7): balanced, explicit judgement; L2 (3–5): partial; L1 (1–2): descriptive.
Q5 [6 marks]
- Slum dwellers face deprivations: no sanitation, insecure tenure, overcrowding. [2]
- Upgrading provides toilets, tenure, services → reduces disease, improves liveability. [2]
- This supports SDG11 sustainable cities, lessens environmental spillover. [2]
Common mistake: Ignoring "multiple deprivations" keyword.
Q6 [7 marks]
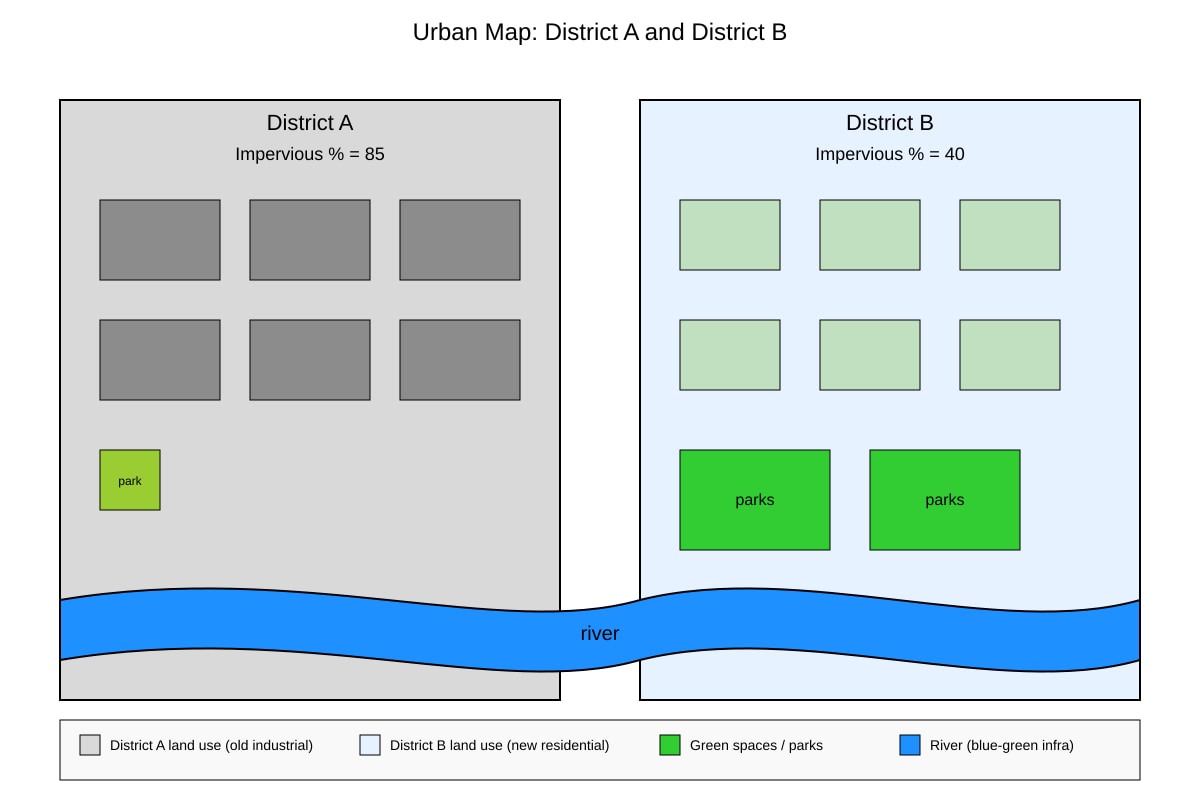
- District A: 85% impervious → high runoff, heat island, low biodiversity. [2]
- District B: 40% impervious + green-blue → absorbs flood, cooler. [2]
- Account: B planned with sustainability; A legacy industrial. [2]
- Conclusion: B more sustainable via design. [1]
Section C Answers (Answer ONE)
Q7 [10 marks]
Level descriptors (0–4, 10 max):
- L4 (9–10): Evaluates both sustainability (energy recovery, landfill cut) and liveability (air emissions, odour concern); balanced with Asian cases (e.g., Singapore Tuas).
- Content: Incineration cuts landfill, generates power; but PM2.5, equity issues for nearby residents.
- Judgement: Partial – needs recycling first.
Teaching: Must show tension between sustainability and liveability.
Q8 [10 marks]
- Reimaging (e.g., waterfront) draws investment → economic liveability. [3]
- But may displace elderly, raise costs → social tension. [3]
- Environmental gain if green spaces added. [2]
- Extent: Partial reconciliation only with inclusive planning. [2]
Marking: Evidence of ageing city (e.g., Tokyo) strengthens.