AI Generated Exam Paper
A Level H1 Geography Practice Paper 2
Free A Level H1 Geography Practice Paper 2, LongCat AI version, with questions, answers, and A Level-style practice for Singapore students.
These static practice materials are generated from the site's syllabus and paper-generation workflow, with source and model context shown so students and parents can evaluate the material before use.
Questions
TuitionGoWhere Practice Paper - Geography H1 A-Level
TuitionGoWhere Practice Paper (AI)
Subject: Geography H1 Level: A-Level Paper: Practice Paper — Resources Sustainability Duration: 1 hour 30 minutes Total Marks: 60 Name: ___________________________ Class: ___________________________ Date: ___________________________ Version: 2 of 5
Instructions to Candidates
- This paper consists of three sections: Section A, Section B, and Section C.
- Answer all questions in all sections.
- Write your answers in the spaces provided.
- The number of marks for each question is shown in brackets [ ].
- Begin each section on a fresh page.
- You are advised to spend approximately:
- Section A: 20 minutes
- Section B: 30 minutes
- Section C: 40 minutes
- Credit will be given for the use of relevant examples and case studies.
- Where a question requires reference to a resource, study the resource carefully before answering.
Section A: Data Response (20 marks)
Answer all questions in this section. Spend approximately 20 minutes on this section.
Question 1
Study Resource 1 below, which shows global freshwater withdrawal by sector for selected countries in 2020.
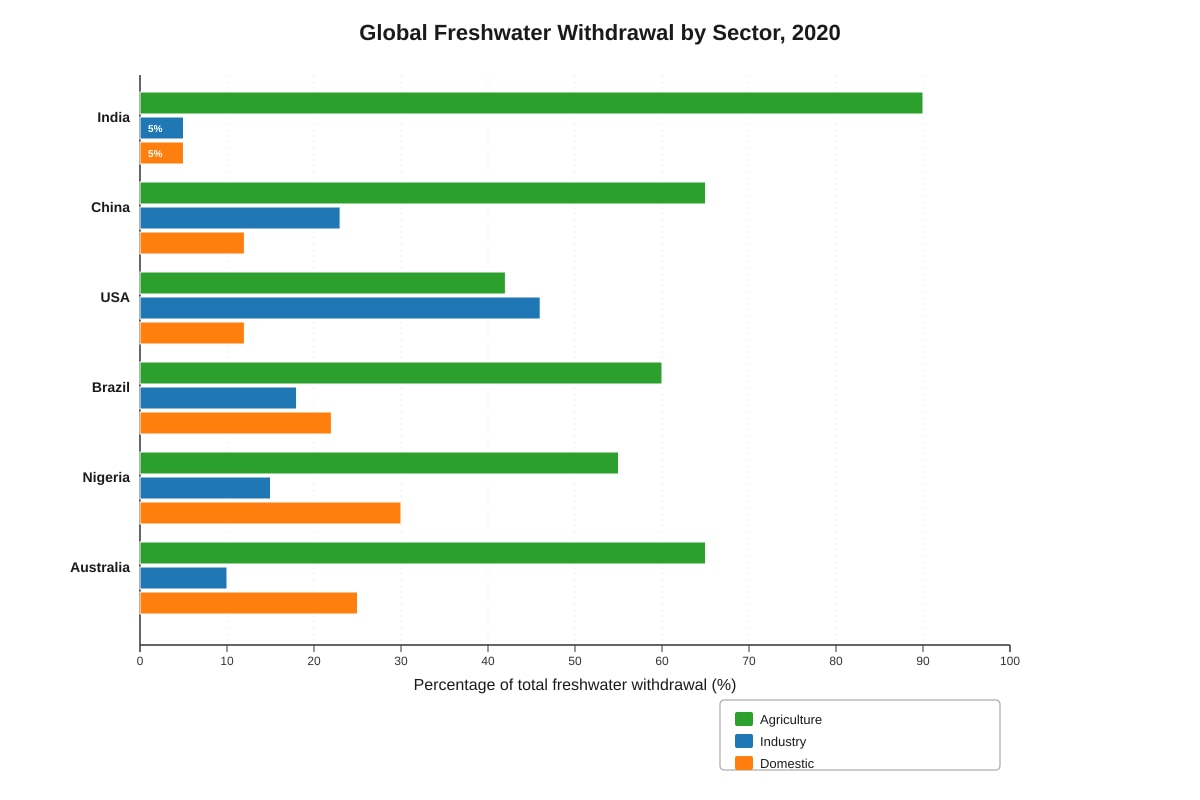
Generated chart for Q1.
Resource 1
(a) Identify the country in Resource 1 where agriculture accounts for the highest proportion of freshwater withdrawal. [1]
...........................................................................................................................................................
(b) State one country in Resource 1 where industrial freshwater withdrawal exceeds agricultural withdrawal. [1]
...........................................................................................................................................................
(c) Describe the pattern of domestic freshwater withdrawal shown in Resource 1. [3]
........................................................................................................................................................... ........................................................................................................................................................... ........................................................................................................................................................... ........................................................................................................................................................... ...........................................................................................................................................................
(d) Suggest two reasons why agricultural freshwater withdrawal is significantly higher in India and China compared to the USA. [4]
........................................................................................................................................................... ........................................................................................................................................................... ........................................................................................................................................................... ........................................................................................................................................................... ........................................................................................................................................................... ........................................................................................................................................................... ........................................................................................................................................................... ...........................................................................................................................................................
Question 2
Study Resource 2 below, which shows the change in global installed renewable energy capacity from 2010 to 2022.
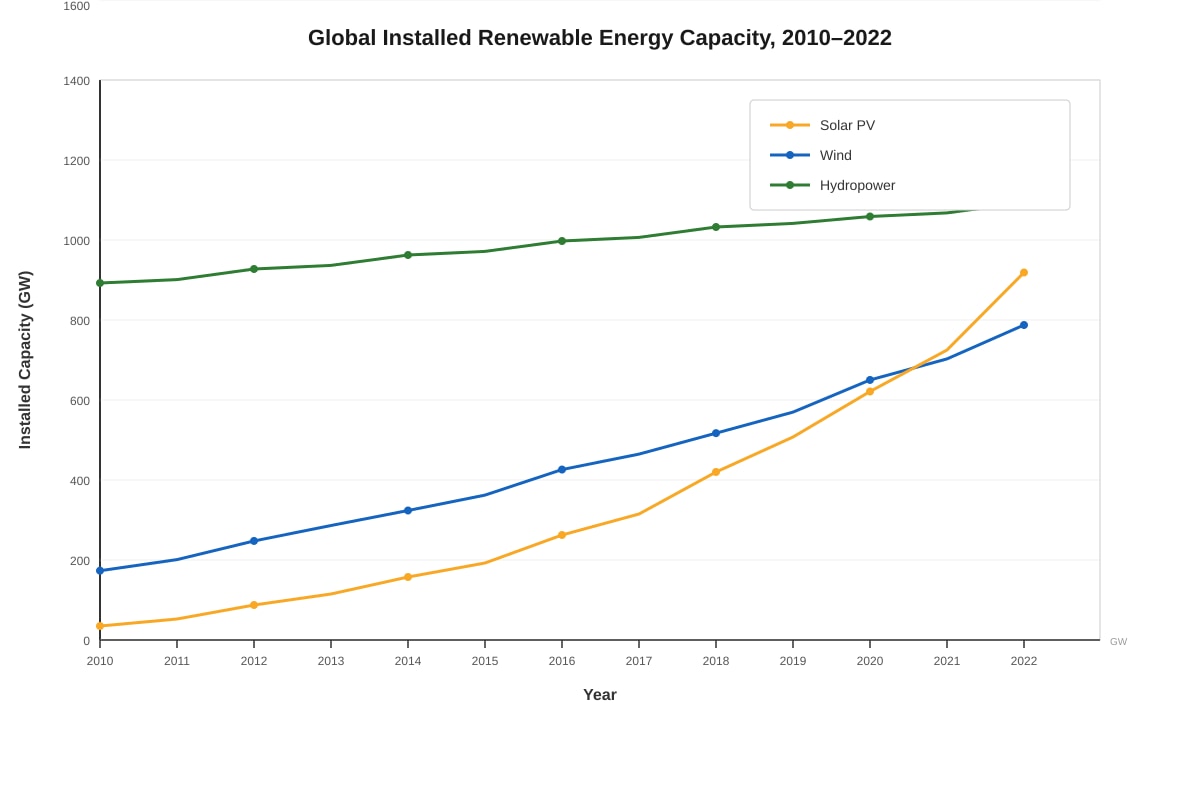
Generated graph for Q2.
Resource 2
(a) Calculate the approximate percentage increase in global solar PV capacity from 2010 to 2022. Show your working. [2]
........................................................................................................................................................... ...........................................................................................................................................................
(b) Compare the trends in solar PV and hydropower capacity shown in Resource 2. [3]
........................................................................................................................................................... ........................................................................................................................................................... ........................................................................................................................................................... ........................................................................................................................................................... ...........................................................................................................................................................
(c) Explain two factors that have contributed to the rapid growth in solar PV capacity since 2010. [4]
........................................................................................................................................................... ........................................................................................................................................................... ........................................................................................................................................................... ........................................................................................................................................................... ........................................................................................................................................................... ........................................................................................................................................................... ........................................................................................................................................................... ...........................................................................................................................................................
Section B: Structured Response (20 marks)
Answer all questions in this section. Spend approximately 30 minutes on this section.
Question 3
(a) Define the term sustainable development. [2]
........................................................................................................................................................... ........................................................................................................................................................... ...........................................................................................................................................................
(b) Explain how over-extraction of groundwater can lead to resource depletion. [4]
........................................................................................................................................................... ........................................................................................................................................................... ........................................................................................................................................................... ........................................................................................................................................................... ........................................................................................................................................................... ........................................................................................................................................................... ........................................................................................................................................................... ...........................................................................................................................................................
(c) Evaluate the effectiveness of desalination as a strategy to address water scarcity in arid regions. [6]
................................................................................................................................................................................................................................................................................................................ ........................................................................................................................................................... ........................................................................................................................................................... ........................................................................................................................................................... ........................................................................................................................................................... ........................................................................................................................................................... ........................................................................................................................................................... ........................................................................................................................................................... ........................................................................................................................................................... ........................................................................................................................................................... ........................................................................................................................................................... ...........................................................................................................................................................
Question 4
(a) State two characteristics of non-renewable energy resources. [2]
........................................................................................................................................................... ...........................................................................................................................................................
(b) Describe the environmental impacts associated with the extraction of fossil fuels. [4]
........................................................................................................................................................... ........................................................................................................................................................... ........................................................................................................................................................... ........................................................................................................................................................... ........................................................................................................................................................... ........................................................................................................................................................... ........................................................................................................................................................... ...........................................................................................................................................................
(c) Discuss the extent to which a transition to renewable energy can ensure long-term energy security for a country. [8]
................................................................................................................................................................................................................................................................................................................ ........................................................................................................................................................... ........................................................................................................................................................... ........................................................................................................................................................... ........................................................................................................................................................... ........................................................................................................................................................... ........................................................................................................................................................... ........................................................................................................................................................... ........................................................................................................................................................... ........................................................................................................................................................... ........................................................................................................................................................... ........................................................................................................................................................... ........................................................................................................................................................... ........................................................................................................................................................... ........................................................................................................................................................... ...........................................................................................................................................................
Section C: Extended Response (20 marks)
Answer all questions in this section. Spend approximately 40 minutes on this section.
Question 5
Study Resource 3 below, which provides information about food security challenges in Sub-Saharan Africa.
Resource 3
Sub-Saharan Africa faces significant food security challenges. Approximately 23% of the population was undernourished in 2022, the highest rate of any world region. Agricultural productivity remains low due to limited access to modern farming technology, poor soil fertility, and unreliable rainfall patterns exacerbated by climate change. Many smallholder farmers practise subsistence agriculture with minimal irrigation infrastructure.
Population growth in the region averages 2.7% per year, placing increasing pressure on arable land. Urbanisation is also accelerating, with the urban population projected to double by 2050. This shifts labour away from agriculture and increases demand for food imports.
International organisations have promoted various interventions, including drought-resistant crop varieties, micro-irrigation systems, and improved storage facilities. However, adoption rates remain uneven due to cost barriers, limited education, and inadequate rural infrastructure. Political instability in several countries further hampers long-term agricultural planning.
The African Union's Comprehensive Africa Agriculture Development Programme (CAADP) aims to achieve 6% annual agricultural growth and allocate at least 10% of national budgets to agriculture. Progress has been mixed, with only a handful of countries meeting these targets.
(a) Using Resource 3, identify three factors that contribute to food insecurity in Sub-Saharan Africa. [3]
........................................................................................................................................................... ........................................................................................................................................................... ........................................................................................................................................................... ........................................................................................................................................................... ...........................................................................................................................................................
(b) Explain how climate change and population growth interact to threaten food security in Sub-Saharan Africa. [5]
........................................................................................................................................................... ........................................................................................................................................................... ........................................................................................................................................................... ........................................................................................................................................................... ........................................................................................................................................................... ........................................................................................................................................................... ........................................................................................................................................................... ........................................................................................................................................................... ........................................................................................................................................................... ...........................................................................................................................................................
(c) Assess the view that technological solutions alone are sufficient to achieve food security in Sub-Saharan Africa. [12]
................................................................................................................................................................................................................................................................................................................ ........................................................................................................................................................... ........................................................................................................................................................... ........................................................................................................................................................... ........................................................................................................................................................... ........................................................................................................................................................... ........................................................................................................................................................... ........................................................................................................................................................... ........................................................................................................................................................... ........................................................................................................................................................... ........................................................................................................................................................... ........................................................................................................................................................... ........................................................................................................................................................... ........................................................................................................................................................... ........................................................................................................................................................... ........................................................................................................................................................... ........................................................................................................................................................... ........................................................................................................................................................... ........................................................................................................................................................... ........................................................................................................................................................... ........................................................................................................................................................... ........................................................................................................................................................... ........................................................................................................................................................... ........................................................................................................................................................... ........................................................................................................................................................... ........................................................................................................................................................... ........................................................................................................................................................... ........................................................................................................................................................... ........................................................................................................................................................... ...........................................................................................................................................................
End of Practice Paper
Answers
TuitionGoWhere Practice Paper — Geography H1 A-Level
Answer Key and Marking Scheme
Subject: Geography H1 | Paper: Practice Paper — Resources Sustainability | Version: 2 of 5 Total Marks: 60
Section A: Data Response (20 marks)
Question 1
(a) Identify the country in Resource 1 where agriculture accounts for the highest proportion of freshwater withdrawal. [1]
Answer: India [1]
Teaching Note: India's agricultural sector accounts for approximately 90% of total freshwater withdrawal, the highest among all six countries shown. This reflects India's large irrigated agricultural sector, which supports a population of over 1.4 billion. Students should be able to read bar charts accurately and compare proportions across categories.
(b) State one country in Resource 1 where industrial freshwater withdrawal exceeds agricultural withdrawal. [1]
Answer: USA [1]
Teaching Note: In the USA, industrial freshwater withdrawal (46%) exceeds agricultural withdrawal (42%). This is unusual globally and reflects the USA's highly industrialised economy and advanced agricultural efficiency (e.g., precision irrigation, drought-resistant crop varieties). Students should note that most countries show agriculture as the dominant water user.
(c) Describe the pattern of domestic freshwater withdrawal shown in Resource 1. [3]
Answer:
- Domestic freshwater withdrawal is the smallest sector in most countries shown, typically ranging from 5% to 30% of total withdrawal. [1]
- Nigeria has the highest domestic withdrawal at 30%, while India has the lowest at 5%. [1]
- There is a general pattern where less economically developed countries (Nigeria, Brazil) tend to have higher domestic withdrawal proportions compared to more industrialised nations (USA, China), though this is not a strict rule. [1]
Marking Notes:
- 1 mark for identifying that domestic use is generally the smallest share.
- 1 mark for referencing specific data values from the resource.
- 1 mark for identifying a valid comparative pattern or trend.
- Students must describe, not explain — no causal reasoning is required at this level.
(d) Suggest two reasons why agricultural freshwater withdrawal is significantly higher in India and China compared to the USA. [4]
Answer:
Reason 1: India and China have vast irrigated agricultural sectors that depend on surface water and groundwater for rice paddy cultivation and other water-intensive crops. Both countries have large rural populations engaged in agriculture, requiring extensive irrigation networks. [2]
Reason 2: The USA has more advanced agricultural technology, including precision irrigation (drip and sprinkler systems), genetically modified drought-resistant crops, and efficient water management practices, which reduce per-unit water consumption in agriculture. [2]
Marking Notes:
- 2 marks per reason (1 for identifying the reason, 1 for developing/explaining it).
- Accept alternative valid reasons: differences in crop types (rice vs. wheat/corn), climate differences, government subsidies for water-efficient technology, or the scale of industrial water recycling in the USA.
- Answers must go beyond simply restating the data — students must suggest plausible causal factors.
Question 2
(a) Calculate the approximate percentage increase in global solar PV capacity from 2010 to 2022. Show your working. [2]
Answer:
Percentage Increase=Original ValueNew Value−Original Value×100%
=401050−40×100%
=401010×100%
=25.25×100%=2525% (approximately)
Final Answer: Approximately 2525% increase [1 mark for correct working, 1 mark for correct answer]
Teaching Note: Percentage increase questions require students to identify the original and new values, apply the formula correctly, and express the answer with appropriate units. The dramatic growth in solar PV reflects falling costs (Swanson's Law), government subsidies, and technological improvements in photovoltaic efficiency.
(b) Compare the trends in solar PV and hydropower capacity shown in Resource 2. [3]
Answer:
- Solar PV shows a steep exponential/rapid growth trend, increasing from 40 GW in 2010 to 1050 GW in 2022 — a more than 25-fold increase. [1]
- Hydropower shows a slow, steady, almost linear growth trend, increasing from 1020 GW to 1250 GW over the same period — approximately a 23% increase. [1]
- In 2010, hydropower capacity was approximately 25 times larger than solar PV, but by 2022, solar PV capacity had reached approximately 84% of hydropower capacity, showing a significant narrowing of the gap. [1]
Marking Notes:
- 1 mark for describing the solar PV trend.
- 1 mark for describing the hydropower trend.
- 1 mark for a valid comparison between the two trends (e.g., rate of change, relative magnitudes, convergence).
- Students must use data from the resource to support their comparison.
(c) Explain two factors that have contributed to the rapid growth in solar PV capacity since 2010. [4]
Answer:
Factor 1 — Declining costs: The cost of solar PV modules has fallen dramatically since 2010, driven by economies of scale in manufacturing (particularly in China), technological improvements in cell efficiency, and streamlined supply chains. This has made solar energy increasingly cost-competitive with fossil fuels, encouraging both utility-scale and residential adoption. [2]
Factor 2 — Government policy and incentives: Many governments have introduced feed-in tariffs, tax credits, renewable energy targets, and subsidies to promote solar energy adoption. Examples include China's 13th Five-Year Plan renewable energy targets, the US Investment Tax Credit (ITC), and the European Union's Renewable Energy Directive. These policies have created stable investment environments and reduced financial barriers. [2]
Marking Notes:
- 2 marks per factor (1 for identifying the factor, 1 for explaining how it contributed to growth).
- Accept alternative valid factors: growing climate change awareness, corporate renewable energy procurement, grid parity achievement in many markets, or energy security concerns.
- Answers must explain the causal link between the factor and the growth in capacity.
Section B: Structured Response (20 marks)
Question 3
(a) Define the term sustainable development. [2]
Answer:
Sustainable development is development that meets the needs of the present without compromising the ability of future generations to meet their own needs. [2]
Teaching Note: This definition comes from the 1987 Brundtland Report (Our Common Future). Key elements include: (1) intergenerational equity, (2) balancing economic, social, and environmental dimensions, and (3) recognising that resources are finite. Students should be able to recall this definition precisely.
(b) Explain how over-extraction of groundwater can lead to resource depletion. [4]
Answer:
- Groundwater is recharged slowly through infiltration of precipitation and surface water, often over decades or centuries (fossil groundwater may take millennia to recharge). [1]
- When extraction rates exceed natural recharge rates, the water table drops progressively, reducing the volume of accessible groundwater. [1]
- This can lead to wells running dry, increased pumping costs as water must be lifted from greater depths, and land subsidence as underground aquifer structures collapse without water pressure to support them. [1]
- In coastal areas, over-extraction can cause saltwater intrusion, where seawater infiltrates the aquifer, rendering the remaining groundwater unusable for agriculture or drinking. [1]
Teaching Note: Groundwater depletion is a critical global issue. Major examples include the Ogallala Aquifer in the USA, the Indo-Gangetic Basin in South Asia, and the North China Plain. Students should understand the concept of safe yield (the rate at which groundwater can be extracted without causing long-term depletion) and the difference between renewable and non-renewable (fossil) groundwater.
(c) Evaluate the effectiveness of desalination as a strategy to address water scarcity in arid regions. [6]
Answer:
Introduction: Desalination — the process of removing salt and minerals from seawater or brackish water to produce freshwater — has become an increasingly important strategy for addressing water scarcity in arid regions such as the Middle East, North Africa, and parts of Australia.
Arguments that desalination is effective:
- Desalination provides a reliable, climate-independent source of freshwater that is not affected by drought or variable rainfall patterns. Countries like Saudi Arabia and Israel now derive a significant proportion of their domestic water from desalination plants. [1]
- Technological advances, particularly in reverse osmosis (RO), have reduced energy consumption and costs significantly. Modern RO plants use approximately 3–4 kWh per cubic metre, compared to over 10 kWh for older thermal distillation methods. [1]
- Desalination can be scaled to meet growing demand, and modular plants can be deployed relatively quickly compared to large dam projects. [1]
Arguments that desalination has limitations:
- Desalination remains energy-intensive, and if the energy comes from fossil fuels, it contributes to greenhouse gas emissions, creating a feedback loop with climate change. [1]
- The process produces highly concentrated brine as a by-product, which can cause severe ecological damage to marine ecosystems if discharged back into the ocean without proper dilution and dispersion. [1]
- High capital and operational costs make desalination inaccessible for many developing countries. The cost of desalinated water (typically 0.50–2.00 per cubic metre) is significantly higher than conventional freshwater sources. [1]
Conclusion: Desalination is an effective supplementary strategy for water-scarce arid regions, particularly where financial resources and energy infrastructure are available. However, it is not a standalone solution and should be integrated with water conservation, demand management, and wastewater recycling strategies for a sustainable water future. [1]
Marking Notes:
- This is a 6-mark evaluative question. Award marks as follows:
- Up to 3 marks for arguments supporting desalination's effectiveness.
- Up to 2 marks for limitations/counter-arguments.
- 1 mark for a balanced conclusion.
- Students must present both sides of the argument and reach a reasoned judgement.
- Accept references to specific case studies (e.g., Saudi Arabia, Israel, Singapore's NEWater and desalination programme).
Question 4
(a) State two characteristics of non-renewable energy resources. [2]
Answer:
- They exist in finite quantities and cannot be replenished on a human timescale once depleted. [1]
- They typically have high energy density and have historically been relatively cheap and easy to extract and transport. [1]
Teaching Note: Non-renewable energy resources include coal, oil, natural gas, and uranium (nuclear). Students should distinguish between non-renewable and renewable resources. Other acceptable characteristics include: they produce greenhouse gas emissions when burned, they take millions of years to form, or they are concentrated in specific geological formations.
(b) Describe the environmental impacts associated with the extraction of fossil fuels. [4]
Answer:
- Land degradation and habitat destruction: Surface mining (open-pit mining) for coal and oil sands removes vegetation, topsoil, and entire ecosystems. Mountaintop removal mining in Appalachia (USA) has destroyed over 500 mountains and buried thousands of kilometres of streams. [1]
- Water pollution: Oil spills (e.g., Deepwater Horizon, 2010) contaminate marine and coastal ecosystems. Acid mine drainage from coal mining releases heavy metals and sulphuric acid into waterways, harming aquatic life. [1]
- Air pollution and greenhouse gas emissions: Extraction and processing release methane (a potent greenhouse gas), volatile organic compounds, and particulate matter. Flaring of natural gas at oil wells contributes to air pollution and CO₂ emissions. [1]
- Seismic activity and subsidence: Fracking (hydraulic fracturing) for shale gas has been linked to induced seismicity (earthquakes) in regions like Oklahoma, USA. Groundwater contamination from fracking fluids is also a concern. [1]
Teaching Note: Students should be able to describe specific, named examples of environmental impacts. Vague answers without specific impacts or examples will not receive full marks. The key is to link the extraction method to a concrete environmental consequence.
(c) Discuss the extent to which a transition to renewable energy can ensure long-term energy security for a country. [8]
Answer:
Introduction: Energy security refers to the uninterrupted availability of energy sources at an affordable price. A transition to renewable energy is often proposed as a pathway to long-term energy security, but its effectiveness depends on multiple factors including technology, geography, economics, and policy.
Arguments that renewable energy enhances energy security:
- Renewable energy sources (solar, wind, hydro, geothermal) are domestically available in most countries, reducing dependence on imported fossil fuels and exposure to volatile global commodity markets and geopolitical disruptions. For example, Denmark now generates over 50% of its electricity from wind power, significantly reducing its reliance on Russian natural gas. [2]
- Renewable energy prices have fallen dramatically and are now competitive with or cheaper than fossil fuels in many markets. Solar PV costs have declined by over 90% since 2010, making renewable energy increasingly affordable and reducing the economic vulnerability associated with fossil fuel price spikes. [1]
- Distributed renewable energy systems (e.g., rooftop solar) can enhance grid resilience by reducing dependence on centralised power plants and long-distance transmission infrastructure, which are vulnerable to natural disasters and cyberattacks. [1]
Arguments that renewable energy alone cannot ensure energy security:
- Intermittency is a fundamental challenge — solar and wind energy are variable and dependent on weather conditions and time of day. Without adequate energy storage (batteries, pumped hydro) or backup power sources, renewable energy cannot guarantee continuous supply. Current battery technology remains expensive and has limited capacity for grid-scale storage. [1]
- The transition requires massive upfront investment in new infrastructure, including generation facilities, grid upgrades, and storage systems. Developing countries may lack the financial resources and technical expertise to undertake such transitions rapidly. [1]
- Some renewable energy technologies depend on critical minerals (lithium, cobalt, rare earth elements) that are concentrated in a few countries, potentially creating new supply chain vulnerabilities. For example, the Democratic Republic of Congo produces approximately 70% of the world's cobalt. [1]
- Energy density and land use requirements are significant. Renewable energy sources generally require much larger land areas per unit of energy produced compared to fossil fuels, which can create conflicts with agriculture, conservation, and urban development. [1]
Conclusion: A transition to renewable energy can significantly enhance long-term energy security by reducing import dependence, diversifying energy sources, and providing price stability. However, it cannot fully ensure energy security on its own without addressing intermittency through storage and grid management, securing critical mineral supply chains, and ensuring equitable access to the necessary technology and investment. An integrated approach combining renewables, energy efficiency, and transitional fuels (such as natural gas as a bridge fuel) is likely the most pragmatic pathway. [1]
Marking Notes:
- This is an 8-mark extended response question. Award marks as follows:
- Up to 4 marks for arguments supporting renewable energy's contribution to energy security.
- Up to 3 marks for limitations/counter-arguments.
- 1 mark for a balanced, reasoned conclusion.
- Students must demonstrate evaluative skills — simply listing advantages and disadvantages without analysis will not achieve the highest marks.
- Credit specific, named examples (e.g., Denmark's wind energy, Germany's Energiewende, China's solar manufacturing dominance).
- Answers should acknowledge the complexity of energy security, which encompasses availability, affordability, accessibility, and sustainability.
Section C: Extended Response (20 marks)
Question 5
(a) Using Resource 3, identify three factors that contribute to food insecurity in Sub-Saharan Africa. [3]
Answer:
- Low agricultural productivity due to limited access to modern farming technology and poor soil fertility. [1]
- Unreliable rainfall patterns exacerbated by climate change. [1]
- Rapid population growth (averaging 2.7% per year) placing increasing pressure on arable land. [1]
Teaching Note: Students must extract information directly from Resource 3. Other acceptable factors from the resource include: urbanisation shifting labour away from agriculture, political instability hampering long-term planning, cost barriers to adopting new technologies, and inadequate rural infrastructure. Each factor must be clearly stated and linked to the resource.
(b) Explain how climate change and population growth interact to threaten food security in Sub-Saharan Africa. [5]
Answer:
- Climate change is increasing the frequency and severity of droughts and unpredictable rainfall in Sub-Saharan Africa, directly reducing crop yields and livestock productivity in a region where rain-fed agriculture dominates. [1]
- Simultaneously, rapid population growth (2.7% per year) is increasing total food demand and driving the conversion of marginal land into agricultural use, which is often unsuitable for farming and prone to degradation. [1]
- The interaction creates a compounding effect: as climate change reduces per-hectare yields, more land must be cultivated to feed a growing population, leading to deforestation, soil erosion, and further environmental degradation that undermines long-term agricultural productivity. [1]
- Urbanisation, driven partly by population growth and partly by rural agricultural failure, shifts labour away from farming while increasing demand for purchased food, creating a double pressure on the food system. [1]
- This interaction creates a vicious cycle: environmental degradation from over-farming reduces the land's resilience to climate shocks, making future harvests even more vulnerable, while population growth ensures that demand continues to outstrip declining per-capita food availability. [1]
Teaching Note: The key skill here is explaining the interaction between two factors, not just describing them separately. Students should demonstrate understanding of feedback loops and compounding effects. This is a hallmark of higher-order geographical thinking at A-Level.
(c) Assess the view that technological solutions alone are sufficient to achieve food security in Sub-Saharan Africa. [12]
Answer:
Introduction: Food security exists when all people, at all times, have physical, social, and economic access to sufficient, safe, and nutritious food. Technological solutions — including drought-resistant crops, micro-irrigation, improved storage, and precision agriculture — are widely promoted as key interventions. However, achieving food security requires addressing a complex web of economic, social, political, and environmental factors that technology alone cannot resolve.
Arguments supporting the importance of technological solutions:
- Drought-resistant and high-yielding crop varieties (e.g., drought-tolerant maize developed by CIMMYT) have demonstrably increased yields in field trials by 20–30% under water-stressed conditions, directly addressing the climate-related productivity challenge. [2]
- Micro-irrigation systems (drip irrigation) can reduce water use by 30–60% compared to flood irrigation while increasing crop yields, making them highly suitable for water-scarce regions. Israel's drip irrigation technology has been successfully adapted in parts of Kenya and Ethiopia. [2]
- Improved post-harvest storage facilities can reduce food losses, which currently account for 20–40% of production in Sub-Saharan Africa due to pest infestation, mould, and inadequate storage infrastructure. Hermetic storage bags and metal silos have proven effective in reducing losses. [1]
- Mobile technology and digital platforms (e.g., M-Pesa in Kenya) can improve market access for smallholder farmers, reduce information asymmetries, and enable access to weather forecasts and agricultural advice. [1]
Arguments that technological solutions alone are insufficient:
- Resource 3 highlights that adoption rates of new technologies remain uneven due to cost barriers. Many smallholder farmers cannot afford the upfront investment required for improved seeds, irrigation equipment, or storage facilities, even when long-term benefits are clear. Without microfinance, subsidies, or cooperative models, technology remains inaccessible to those who need it most. [2]
- Political instability and conflict in countries such as South Sudan, Somalia, and the Democratic Republic of Congo disrupt agricultural production, displace farming communities, and destroy infrastructure. No technological solution can function effectively in a war zone or where governance is absent. [1]
- Education and capacity building are prerequisites for technology adoption. Farmers need training to use new technologies effectively, interpret weather data, and manage improved inputs. Without investment in rural education and extension services, technological potential remains unrealised. [1]
- Structural economic issues, including land tenure insecurity, lack of market access, and global trade inequalities, mean that even productive farmers may remain food-insecure if they cannot sell their produce at fair prices or access markets. Technology addresses production but not distribution or economic access. [1]
- Cultural and social factors, including gender inequality (women produce 60–80% of food in Sub-Saharan Africa but have less access to land, credit, and technology), can prevent technological solutions from reaching the most productive segments of the population. [1]
Conclusion: Technological solutions are a necessary but insufficient condition for achieving food security in Sub-Saharan Africa. While innovations in crop science, irrigation, storage, and digital agriculture offer significant potential to increase productivity and resilience, they must be embedded within broader strategies that address poverty, inequality, governance, education, and infrastructure. The African Union's CAADP framework, which targets both agricultural investment and governance reform, represents a more holistic approach. Ultimately, food security is as much a political and economic challenge as a technological one, and solutions must reflect this complexity. [1]
Marking Notes:
- This is a 12-mark extended essay question. Award marks using the following Level of Response (LOR) framework:
| Level | Marks | Descriptor |
|---|---|---|
| Level 4 | 10–12 | Comprehensive, well-structured argument with balanced evaluation. Uses specific, named examples. Demonstrates sophisticated understanding of the complexity of food security. Clear, reasoned conclusion. |
| Level 3 | 7–9 | Good understanding with some evaluation. Uses relevant examples but may lack depth or balance. Conclusion present but may be underdeveloped. |
| Level 2 | 4–6 | Descriptive rather than evaluative. May present one side more strongly than the other. Limited use of specific examples. Conclusion may be absent or superficial. |
| Level 1 | 1–3 | Basic understanding with limited development. May be largely descriptive or rely on general statements without evidence. |
- Key assessment criteria:
- Knowledge and understanding: Accurate use of geographical concepts, terminology, and case study evidence.
- Analysis and evaluation: Ability to weigh competing arguments, recognise complexity, and avoid oversimplification.
- Structure and coherence: Logical organisation with clear introduction, body paragraphs, and conclusion.
- Use of evidence: Specific, named examples (e.g., CIMMYT, M-Pesa, CAADP) rather than vague generalisations.
- Common mistakes to flag:
- Writing only about technology without addressing the "alone" aspect of the question.
- Listing advantages and disadvantages without evaluating their relative importance.
- Ignoring the resource material provided in the question.
- Reaching a conclusion that does not follow from the arguments presented.
End of Answer Key
Mark Summary:
| Section | Marks |
|---|---|
| Section A (Q1–Q2) | 20 |
| Section B (Q3–Q4) | 20 |
| Section C (Q5) | 20 |
| Total | 60 |
Free quiz and exam paper access
Enter your details to view this paper
Your access is remembered on this device.