AI Generated Exam Paper
A Level H1 Geography Practice Paper 1
Free A Level H1 Geography Practice Paper 1, LongCat AI version, with questions, answers, and A Level-style practice for Singapore students.
These static practice materials are generated from the site's syllabus and paper-generation workflow, with source and model context shown so students and parents can evaluate the material before use.
Questions
TuitionGoWhere Practice Paper - Geography H1 A-Level
TuitionGoWhere Practice Paper (AI)
Subject: Geography H1
Level: A-Level
Paper: Practice Paper — Resources Sustainability
Version: 1 of 5
Duration: 1 hour 30 minutes
Total Marks: 60
Name: ___________________________
Class: ___________________________
Date: ___________________________
Instructions
- Answer all questions in the spaces provided.
- Read each question carefully before answering.
- For data-based questions, refer to the resource provided and use specific evidence in your answers.
- Where a question asks you to "explain" or "account for," you must go beyond description and provide reasons.
- Where a question asks you to "evaluate" or "assess," you must present a balanced argument with a supported conclusion.
- Quality of written communication will be assessed in extended responses.
- The number of marks for each question is shown in brackets [ ].
Section A: Data-Based Questions (30 marks)
Answer all questions in this section. Refer to the resources provided.
Refer to Resource 1 and Resource 2 below.
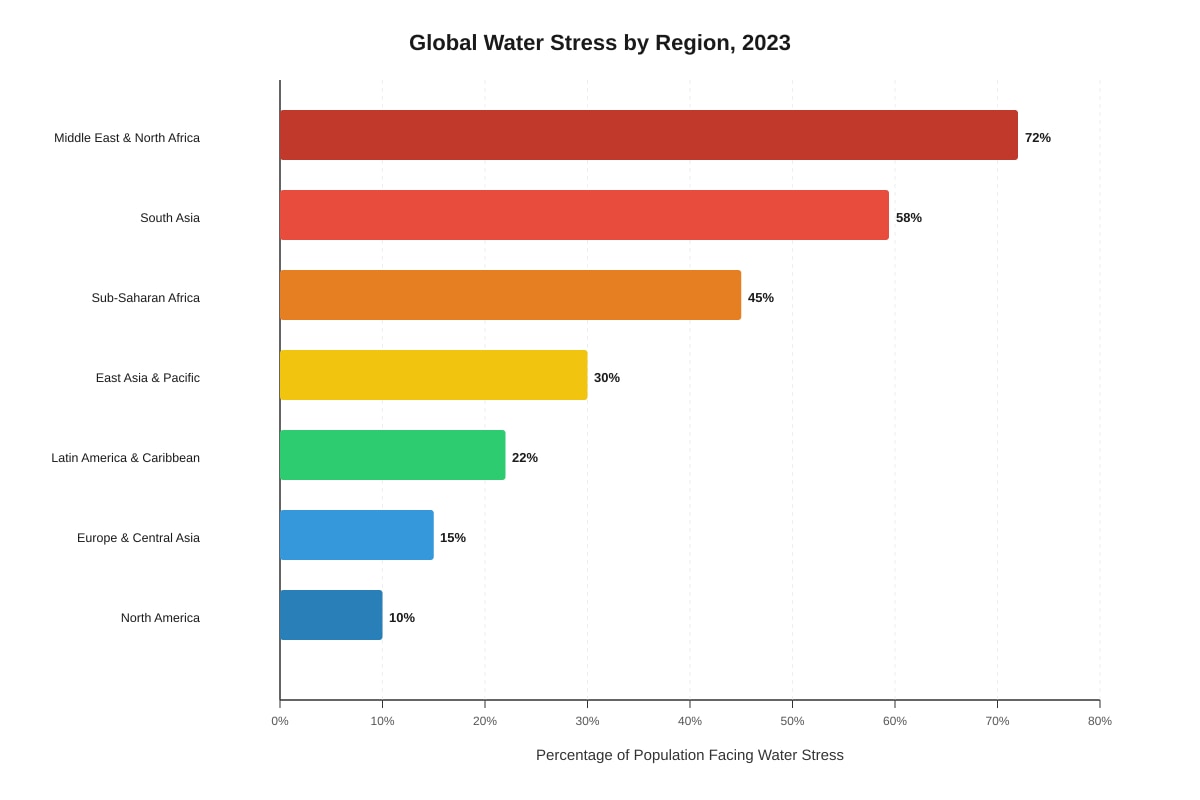
Resource 1: Global Water Stress by Region, 2023
Generated chart for Q1.
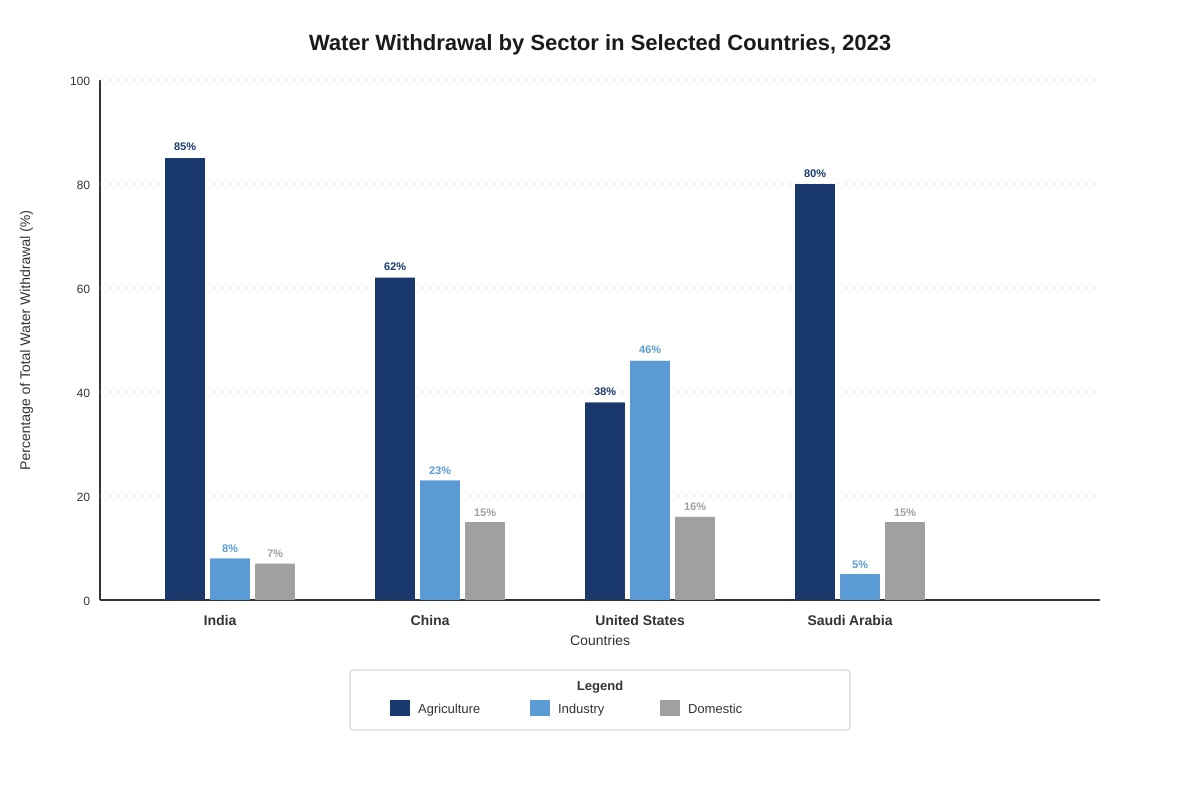
Resource 2: Water Withdrawal by Sector in Selected Countries, 2023
Generated chart for Q1.
Question 1
(a) Using Resource 1, describe the pattern of global water stress shown. [3]
.............................................................................................................
.............................................................................................................
.............................................................................................................
.............................................................................................................
.............................................................................................................
(b) Using Resource 2, compare the water withdrawal patterns of India and the United States. [4]
.............................................................................................................
.............................................................................................................
.............................................................................................................
.............................................................................................................
.............................................................................................................
.............................................................................................................
.............................................................................................................
(c) Suggest two reasons why agriculture accounts for a high proportion of water withdrawal in countries such as India and Saudi Arabia. [4]
.............................................................................................................
.............................................................................................................
.............................................................................................................
.............................................................................................................
.............................................................................................................
.............................................................................................................
.............................................................................................................
Question 2
(a) Define the term water stress. [2]
.............................................................................................................
.............................................................................................................
.............................................................................................................
(b) Explain two factors that contribute to water stress in the Middle East and North Africa region. [4]
.............................................................................................................
.............................................................................................................
.............................................................................................................
.............................................................................................................
.............................................................................................................
.............................................................................................................
.............................................................................................................
(c) Evaluate the effectiveness of demand-side strategies in managing water stress. [6]
.............................................................................................................
.............................................................................................................
.............................................................................................................
.............................................................................................................
.............................................................................................................
.............................................................................................................
.............................................................................................................
.............................................................................................................
.............................................................................................................
.............................................................................................................
.............................................................................................................
.............................................................................................................
.............................................................................................................
.............................................................................................................
.............................................................................................................
.............................................................................................................
Refer to Resource 3 below.
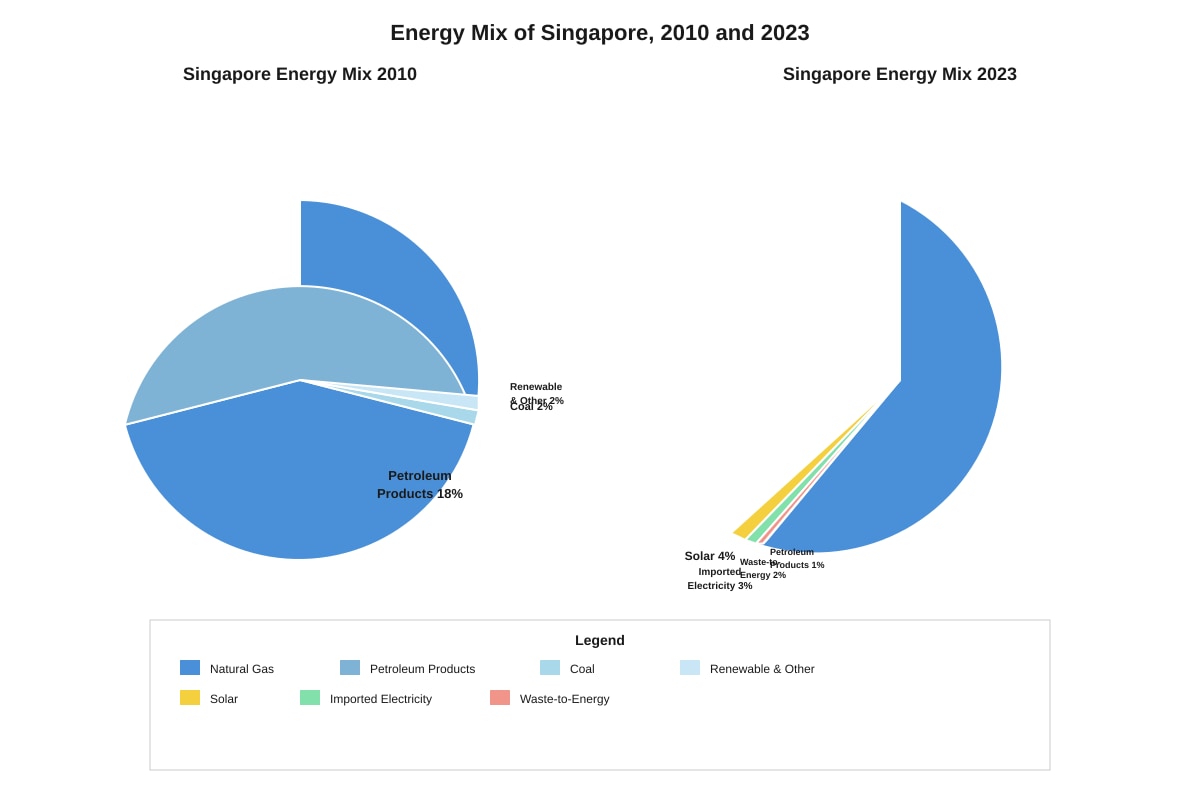
Resource 3: Energy Mix of Singapore, 2010 and 2023
Generated chart for Q3.
Question 3
(a) Using Resource 3, describe the changes in Singapore's energy mix between 2010 and 2023. [4]
.............................................................................................................
.............................................................................................................
.............................................................................................................
.............................................................................................................
.............................................................................................................
.............................................................................................................
.............................................................................................................
(b) Account for the changes in Singapore's energy mix shown in Resource 3. [5]
.............................................................................................................
.............................................................................................................
.............................................................................................................
.............................................................................................................
.............................................................................................................
.............................................................................................................
.............................................................................................................
.............................................................................................................
.............................................................................................................
.............................................................................................................
(c) Assess the extent to which Singapore's current energy mix is sustainable. [7]
.............................................................................................................
.............................................................................................................
.............................................................................................................
.............................................................................................................
.............................................................................................................
.............................................................................................................
.............................................................................................................
.............................................................................................................
.............................................................................................................
.............................................................................................................
.............................................................................................................
.............................................................................................................
.............................................................................................................
.............................................................................................................
.............................................................................................................
.............................................................................................................
.............................................................................................................
.............................................................................................................
.............................................................................................................
.............................................................................................................
.............................................................................................................
Section B: Structured and Essay Questions (30 marks)
Answer all questions in this section.
Question 4
(a) Outline two characteristics of renewable energy sources. [2]
.............................................................................................................
.............................................................................................................
.............................................................................................................
(b) Explain how the concept of energy security relates to a country's choice of energy sources. [4]
.............................................................................................................
.............................................................................................................
.............................................................................................................
.............................................................................................................
.............................................................................................................
.............................................................................................................
.............................................................................................................
(c) Discuss the view that economic development is the main driver of increasing resource consumption. [8]
.............................................................................................................
.............................................................................................................
.............................................................................................................
.............................................................................................................
.............................................................................................................
.............................................................................................................
.............................................................................................................
.............................................................................................................
.............................................................................................................
.............................................................................................................
.............................................................................................................
.............................................................................................................
.............................................................................................................
.............................................................................................................
.............................................................................................................
.............................................................................................................
.............................................................................................................
.............................................................................................................
.............................................................................................................
.............................................................................................................
.............................................................................................................
Question 5
(a) What is meant by the term sustainable development? [2]
.............................................................................................................
.............................................................................................................
.............................................................................................................
(b) Describe two ways in which sustainable development can be measured. [4]
.............................................................................................................
.............................................................................................................
.............................................................................................................
.............................................................................................................
.............................................................................................................
.............................................................................................................
.............................................................................................................
(c) "Technological innovation alone can achieve resource sustainability." How far do you agree with this statement? [8]
.............................................................................................................
.............................................................................................................
.............................................................................................................
.............................................................................................................
.............................................................................................................
.............................................................................................................
.............................................................................................................
.............................................................................................................
.............................................................................................................
.............................................................................................................
.............................................................................................................
.............................................................................................................
.............................................................................................................
.............................................................................................................
.............................................................................................................
.............................................................................................................
.............................................................................................................
.............................................................................................................
.............................................................................................................
.............................................................................................................
.............................................................................................................
Question 6
(a) Define carrying capacity in the context of resource sustainability. [2]
.............................................................................................................
.............................................................................................................
.............................................................................................................
(b) Explain how population growth affects the carrying capacity of a region. [4]
.............................................................................................................
.............................................................................................................
.............................................................................................................
.............................................................................................................
.............................................................................................................
.............................................................................................................
.............................................................................................................
(c) Evaluate the role of government policy in promoting resource sustainability. [8]
.............................................................................................................
.............................................................................................................
.............................................................................................................
.............................................................................................................
.............................................................................................................
.............................................................................................................
.............................................................................................................
.............................................................................................................
.............................................................................................................
.............................................................................................................
.............................................................................................................
.............................................................................................................
.............................................................................................................
.............................................................................................................
.............................................................................................................
.............................................................................................................
.............................................................................................................
.............................................................................................................
.............................................................................................................
.............................................................................................................
.............................................................................................................
End of Practice Paper
Total Marks: 60
| Section | Marks |
|---|---|
| Section A (Q1–Q3) | 30 |
| Section B (Q4–Q6) | 30 |
| Total | 60 |
Answers
TuitionGoWhere Practice Paper — Geography H1 A-Level
Answer Key and Marking Scheme
Paper: Practice Paper — Resources Sustainability
Version: 1 of 5
Total Marks: 60
Section A: Data-Based Questions (30 marks)
Question 1
(a) Using Resource 1, describe the pattern of global water stress shown. [3]
Answer:
Resource 1 shows significant variation in water stress across global regions. The Middle East & North Africa has the highest level at 72% of its population facing water stress, followed by South Asia at 58% and Sub-Saharan Africa at 45%. East Asia & Pacific (30%) and Latin America & Caribbean (22%) show moderate levels, while Europe & Central Asia (15%) and North America (10%) have the lowest levels. There is a clear pattern where developing regions in arid and semi-arid climates experience the highest water stress, while developed regions with greater infrastructure investment and more temperate climates experience lower stress.
Marking scheme:
- 1 mark for identifying the highest-stress region(s) with data reference.
- 1 mark for identifying the lowest-stress region(s) with data reference.
- 1 mark for recognising the overall pattern or trend (e.g., developing vs. developed, or climate-related gradient).
- Note: Pure description without data reference scores a maximum of 1 mark.
(b) Using Resource 2, compare the water withdrawal patterns of India and the United States. [4]
Answer:
India and the United States show contrasting water withdrawal patterns. In India, agriculture dominates water use at 85% of total withdrawal, with industry at 8% and domestic use at 7%. In the United States, agriculture accounts for 38% while industry is the largest sector at 46%, with domestic use at 16%. India's pattern reflects a developing economy heavily dependent on irrigated agriculture, whereas the United States has a more diversified water use profile with significant industrial demand. Both countries have similar domestic water use percentages (India 7%, US 16%), though the US figure is more than double India's. The key difference is that India is agriculture-dominated while the US has a more balanced distribution with industry as the leading sector.
Marking scheme:
- 1 mark for identifying that India is agriculture-dominated (with data).
- 1 mark for identifying that the US has a more balanced/diversified pattern (with data).
- 1 mark for a valid comparison point (e.g., industrial use contrast: 8% vs. 46%).
- 1 mark for a second valid comparison point or a developed comparative statement.
- Note: Answers must use specific data from Resource 2 to gain full marks.
(c) Suggest two reasons why agriculture accounts for a high proportion of water withdrawal in countries such as India and Saudi Arabia. [4]
Answer:
Reason 1 — Climate and irrigation needs: Both India and Saudi Arabia have large areas with arid or semi-arid climates where rainfall is insufficient for crop growth. In Saudi Arabia, desert conditions mean virtually all agricultural water must be supplied through irrigation. In India, monsoon-dependent agriculture requires supplementary irrigation during dry seasons to maintain crop yields, leading to high agricultural water demand.
Reason 2 — Economic structure and food security priorities: Agriculture remains a major employer and contributor to GDP in both countries. India has a large rural population dependent on farming, and the government prioritises food self-sufficiency, which requires extensive irrigated agriculture. Saudi Arabia has historically invested in agricultural development to reduce food import dependence, using significant water resources for this purpose despite water scarcity.
Marking scheme:
- 2 marks per reason (1 for identifying the reason, 1 for developing/explaining it with reference to the countries).
- Maximum 4 marks.
- Note: Generic answers without country-specific application score a maximum of 2 marks.
Question 2
(a) Define the term water stress. [2]
Answer:
Water stress refers to the condition where the demand for water exceeds the available supply during a certain period, or when poor quality restricts its use. It is typically measured as the ratio of total water withdrawals to available renewable water resources. When withdrawals exceed 25–40% of available supply, a region is considered to be under water stress.
Marking scheme:
- 1 mark for defining water stress as demand exceeding supply or insufficient water to meet needs.
- 1 mark for elaboration (e.g., reference to ratio of withdrawal to availability, or mention of quality constraints, or a threshold percentage).
(b) Explain two factors that contribute to water stress in the Middle East and North Africa region. [4]
Answer:
Factor 1 — Arid climate and low rainfall: The Middle East and North Africa (MENA) region is predominantly characterised by desert and semi-desert climates with very low annual rainfall, often below 100 mm per year. This natural scarcity of precipitation means that renewable freshwater resources from rivers, lakes, and groundwater recharge are extremely limited, creating a fundamental supply-side constraint.
Factor 2 — Rapid population growth and urbanisation: The MENA region has experienced rapid population growth and urbanisation, increasing domestic and industrial water demand. Countries such as Egypt and Saudi Arabia have seen significant population increases, placing additional pressure on already scarce water resources. Urbanisation concentrates demand in cities, requiring extensive water infrastructure and often leading to over-extraction of groundwater.
Marking scheme:
- 2 marks per factor (1 for identifying the factor, 1 for explaining how it contributes to water stress in MENA).
- Maximum 4 marks.
- Note: Answers must link the factor specifically to the MENA region.
(c) Evaluate the effectiveness of demand-side strategies in managing water stress. [6]
Answer:
Demand-side strategies focus on reducing water consumption and improving efficiency rather than increasing supply. Their effectiveness varies depending on context, implementation, and scale.
Arguments that demand-side strategies are effective:
- Water pricing and tariffs: Implementing tiered pricing structures can discourage wasteful consumption. For example, Singapore's progressive water tariff encourages conservation, and studies show that a 10% price increase can reduce domestic water use by 2–4%.
- Public education and awareness campaigns: Campaigns promoting water-saving behaviours (shorter showers, fixing leaks, efficient appliances) have proven effective in reducing per capita consumption. Australia's "Target 155" campaign during the Millennium drought successfully reduced daily water use.
- Water-efficient technologies: Mandating low-flow fixtures, drip irrigation, and water recycling in industry can significantly reduce demand. Israel's adoption of drip irrigation reduced agricultural water use by 30–50% while maintaining crop yields.
Limitations of demand-side strategies:
- Diminishing returns: In regions where water use is already efficient, further demand reduction becomes increasingly difficult and costly.
- Equity concerns: Water pricing disproportionately affects low-income households, raising social justice issues.
- Insufficient alone: In severely water-stressed regions, demand management alone cannot close the gap between supply and demand; supply-side measures (desalination, water transfer) are also needed.
- Behavioural inertia: Changing long-established water-use habits can be slow and requires sustained effort.
Conclusion:
Demand-side strategies are an essential and often cost-effective component of water stress management, particularly when combined with supply-side approaches. They are most effective when supported by appropriate pricing, regulation, and public engagement. However, they are rarely sufficient on their own in regions facing extreme water scarcity.
Marking scheme:
- 1–2 marks for identifying and explaining demand-side strategies.
- 1–2 marks for evaluating their effectiveness with examples.
- 1–2 marks for discussing limitations or counter-arguments.
- 1 mark for a balanced conclusion.
- Maximum 6 marks.
- Note: Answers must show evaluation (not just description) to score above 3 marks.
Question 3
(a) Using Resource 3, describe the changes in Singapore's energy mix between 2010 and 2023. [4]
Answer:
Singapore's energy mix has undergone notable changes between 2010 and 2023. The share of natural gas increased from 78% to 90%, making it even more dominant. Petroleum products decreased significantly from 18% to just 1%. Coal, which accounted for 2% in 2010, was completely phased out by 2023. The "Renewable & Other" category at 2% in 2010 has been replaced by more diversified sources: solar energy at 4%, imported electricity at 3%, and waste-to-energy at 2%. Overall, the energy mix has become more diversified in terms of source types but more concentrated in terms of natural gas dependency.
Marking scheme:
- 1 mark for noting the increase in natural gas share (with data).
- 1 mark for noting the decrease/elimination of petroleum and coal (with data).
- 1 mark for identifying new sources (solar, imported electricity, waste-to-energy).
- 1 mark for an overview statement about diversification or increased natural gas dominance.
- Note: Answers must reference specific data from Resource 3.
(b) Account for the changes in Singapore's energy mix shown in Resource 3. [5]
Answer:
Several factors account for the changes in Singapore's energy mix:
1. Environmental commitments and climate policy: Singapore's commitment to the Paris Agreement and its goal of halving emissions from their peak by 2050 drove the shift away from coal and petroleum products. Coal was eliminated entirely due to its high carbon intensity, and petroleum products were reduced as part of decarbonisation efforts.
2. Natural gas as a transition fuel: Natural gas was increasingly adopted because it produces approximately 50% less CO₂ than coal per unit of electricity generated. Singapore invested in liquefied natural gas (LNG) terminals and diversified its gas supply sources, making natural gas a reliable and relatively cleaner transition fuel.
3. Growth of solar energy: Singapore's SolarNova programme and floating solar farms (such as the 60 MWp Tengeh Reservoir project) expanded solar capacity. Government incentives, declining solar panel costs, and available reservoir and rooftop space supported this growth from negligible levels to 4% of the energy mix.
4. Regional energy cooperation: The import of electricity (3%) reflects Singapore's participation in regional power grids and cross-border electricity trading, such as the Lao PDR–Thailand–Malaysia–Singapore Power Integration Project, allowing access to renewable energy from neighbouring countries.
5. Waste-to-energy development: Singapore's limited landfill space and growing waste volumes led to investment in waste-to-energy plants, which contribute 2% of the energy mix while addressing waste management challenges.
Marking scheme:
- 1 mark per valid reason, with a maximum of 5 marks.
- Reasons must be explained (not just listed) to score.
- Note: Generic answers without reference to Singapore's specific context score a maximum of 2 marks.
(c) Assess the extent to which Singapore's current energy mix is sustainable. [7]
Answer:
Arguments that Singapore's energy mix is relatively sustainable:
- Low carbon intensity: The dominance of natural gas (90%) means Singapore's electricity generation has a lower carbon footprint than countries reliant on coal. Natural gas emits approximately 490 g CO₂/kWh compared to coal's ~1,000 g CO₂/kWh, making Singapore's energy mix relatively cleaner.
- Diversification efforts: The introduction of solar (4%), imported electricity (3%), and waste-to-energy (2%) demonstrates a commitment to diversifying energy sources and reducing over-reliance on any single fuel type.
- Energy efficiency policies: Singapore has implemented the Energy Conservation Act, energy efficiency standards for buildings, and the carbon tax (introduced in 2019 at S5/tonne,risingtoS25/tonne by 2024), which incentivise cleaner energy use.
- Waste-to-energy integration: Using waste for energy reduces landfill dependency and generates electricity, contributing to a circular economy approach.
Arguments that Singapore's energy mix is not yet fully sustainable:
- Heavy fossil fuel dependency: At 90% natural gas, Singapore remains overwhelmingly dependent on fossil fuels. Natural gas, while cleaner than coal, is still a non-renewable resource that contributes to greenhouse gas emissions.
- Limited renewable potential: Singapore's small land area, high population density, and lack of geothermal or hydro resources constrain renewable energy development. Solar energy, the most viable option, faces intermittency issues and land constraints.
- Energy security risks: Heavy reliance on imported natural gas (primarily from Malaysia and Indonesia) creates vulnerability to supply disruptions and price volatility in global energy markets.
- Carbon emissions trajectory: Despite efficiency improvements, Singapore's absolute emissions continue to rise with economic growth, and the current energy mix is insufficient to meet long-term net-zero targets without significant technological breakthroughs.
Conclusion:
Singapore's current energy mix represents a transitional phase toward sustainability. While it is more sustainable than coal-dependent energy systems, the overwhelming reliance on natural gas and limited renewable capacity mean it cannot yet be considered fully sustainable. Achieving long-term sustainability will require accelerated deployment of solar energy, regional renewable energy imports, carbon capture technologies, and potentially hydrogen fuel development.
Marking scheme:
- 1–2 marks for arguments supporting sustainability.
- 1–2 marks for arguments against sustainability.
- 1–2 marks for balanced analysis and use of evidence.
- 1 mark for a supported conclusion.
- Maximum 7 marks.
- Note: Answers must show assessment/evaluation (not just description) to score above 3 marks.
Section B: Structured and Essay Questions (30 marks)
Question 4
(a) Outline two characteristics of renewable energy sources. [2]
Answer:
- Naturally replenished: Renewable energy sources are derived from natural processes that are continuously replenished, such as sunlight, wind, and water flow, meaning they are not depleted when used (unlike fossil fuels).
- Low or zero carbon emissions: Most renewable energy sources produce little to no greenhouse gas emissions during operation, making them environmentally cleaner than fossil fuel alternatives.
Marking scheme:
- 1 mark per valid characteristic.
- Maximum 2 marks.
(b) Explain how the concept of energy security relates to a country's choice of energy sources. [4]
Answer:
Energy security refers to the uninterrupted availability of energy sources at an affordable price. It influences a country's energy source choices in several ways:
1. Diversification of supply: Countries seeking energy security tend to diversify their energy mix to avoid over-dependence on a single source or supplier. For example, a country reliant solely on imported oil is vulnerable to price shocks and supply disruptions, so it may invest in domestic renewable energy or nuclear power to enhance security.
2. Domestic resource availability: Countries with abundant domestic energy resources (e.g., hydropower in Norway, geothermal in Iceland) can achieve greater energy security by utilising these resources rather than relying on imports. This reduces exposure to geopolitical risks and international market volatility.
3. Reliability and baseload capacity: Energy security requires reliable supply. Countries may favour energy sources that provide consistent baseload power (such as natural gas or nuclear) over intermittent sources (such as solar and wind), unless adequate storage technology is available.
4. Affordability: Energy security also encompasses affordability. Countries may choose cheaper energy sources to ensure that energy remains accessible to industries and households, balancing cost with reliability and environmental considerations.
Marking scheme:
- 2 marks for explaining the link between energy security and diversification.
- 2 marks for explaining the link between energy security and domestic availability, reliability, or affordability.
- Maximum 4 marks.
- Note: Answers must explain the relationship, not just define energy security.
(c) Discuss the view that economic development is the main driver of increasing resource consumption. [8]
Answer:
Economic development is widely recognised as a major driver of resource consumption, but it is not the sole factor. This discussion examines the role of economic development alongside other drivers.
Arguments supporting economic development as the main driver:
- Industrialisation and manufacturing: As countries develop economically, they typically undergo industrialisation, which requires vast quantities of energy, water, and raw materials. China's rapid economic growth since the 1990s has made it the world's largest consumer of energy and many raw materials, including coal, iron ore, and copper.
- Rising living standards and consumption: Economic development increases household incomes, leading to higher consumption of goods, energy, and water. The "lifestyle effect" means that as people become wealthier, they consume more — larger homes, more appliances, private vehicles, and meat-intensive diets all increase per capita resource use.
- Infrastructure development: Developing economies invest heavily in infrastructure (roads, buildings, power plants), which requires enormous quantities of concrete, steel, and other materials. India's infrastructure boom has driven significant increases in cement and steel consumption.
- The Environmental Kuznets Curve (EKC) hypothesis: Some evidence suggests that resource consumption increases with economic development up to a certain income level before potentially declining as societies become more environmentally conscious and technologically efficient.
Arguments that other factors are also significant:
- Population growth: Even without economic development, a growing population increases total resource demand. Sub-Saharan Africa's resource consumption is rising partly due to rapid population growth, not just economic development.
- Technological change: Technology can both increase and decrease resource consumption. While some technologies increase demand (e.g., smartphones requiring rare earth minerals), others improve efficiency (e.g., LED lighting reducing energy use). The net effect depends on the type and adoption rate of technology.
- Cultural and social factors: Consumer culture, social norms, and advertising drive resource consumption independently of economic development. For example, fast fashion and food waste are driven by cultural attitudes as much as by income levels.
- Government policy and governance: Weak environmental regulations, subsidies for fossil fuels, and lack of resource management policies can accelerate resource consumption regardless of the level of economic development. Conversely, strong policies can decouple economic growth from resource use.
Conclusion:
Economic development is undoubtedly a primary driver of increasing resource consumption, particularly through industrialisation, rising living standards, and infrastructure development. However, it operates alongside and interacts with population growth, technological change, cultural factors, and governance. In some contexts, these other factors may be equally or more important. A comprehensive understanding of resource consumption requires considering all these drivers and their interactions.
Marking scheme:
- 2 marks for explaining how economic development drives resource consumption (with examples).
- 2 marks for providing specific evidence or case studies.
- 2 marks for discussing other drivers (population, technology, culture, policy).
- 1 mark for balanced analysis showing interaction between factors.
- 1 mark for a supported conclusion.
- Maximum 8 marks.
- Note: One-sided answers (only agreeing or only disagreeing) score a maximum of 5 marks.
Question 5
(a) What is meant by the term sustainable development? [2]
Answer:
Sustainable development is development that meets the needs of the present without compromising the ability of future generations to meet their own needs (as defined by the Brundtland Commission, 1987). It involves balancing three dimensions: economic growth, social equity, and environmental protection, ensuring that resource use today does not deplete or degrade resources for future use.
Marking scheme:
- 1 mark for defining sustainable development as meeting present needs without compromising future generations.
- 1 mark for mentioning the three dimensions (economic, social, environmental) or elaborating on the balance required.
(b) Describe two ways in which sustainable development can be measured. [4]
Answer:
1. The Human Development Index (HDI): The HDI, developed by the United Nations Development Programme, measures sustainable development through three dimensions: health (life expectancy at birth), education (mean years of schooling and expected years of schooling), and standard of living (gross national income per capita). A higher HDI score indicates more sustainable human development, as it reflects not just economic growth but also social well-being.
2. Ecological Footprint: The ecological footprint measures the amount of biologically productive land and water area required to produce the resources a population consumes and to absorb its waste. It is measured in global hectares (gha) per person. A footprint below the Earth's biocapacity (approximately 1.6 gha per person globally) indicates sustainable resource use, while a footprint above this threshold indicates unsustainable consumption that depletes natural capital.
Marking scheme:
- 2 marks per measurement method (1 for identifying the method, 1 for describing how it measures sustainable development).
- Maximum 4 marks.
- Note: Other valid measures (e.g., Genuine Progress Indicator, Sustainable Development Goals index, Environmental Performance Index) are also acceptable.
(c) "Technological innovation alone can achieve resource sustainability." How far do you agree with this statement? [8]
Answer:
Technological innovation plays a crucial role in advancing resource sustainability, but relying on it alone is insufficient. This discussion evaluates the potential and limitations of technology as the sole solution.
Arguments that technological innovation can significantly contribute to resource sustainability:
- Renewable energy technologies: Advances in solar photovoltaic efficiency (now exceeding 22% for commercial panels), wind turbine design, and battery storage have made renewable energy increasingly cost-competitive with fossil fuels. The levelised cost of solar energy has fallen by over 90% since 2010, enabling large-scale deployment.
- Resource efficiency improvements: Technologies such as precision agriculture, smart grids, and industrial process optimisation reduce resource waste. For example, precision agriculture using GPS and sensors can reduce water and fertiliser use by 20–30% while maintaining yields.
- Circular economy technologies: Innovations in recycling, material recovery, and waste-to-energy conversion enable resources to be reused rather than discarded. Advanced recycling technologies can recover over 95% of materials from electronic waste.
- Carbon capture and storage (CCS): CCS technologies can capture up to 90% of CO₂ emissions from industrial processes and power plants, potentially enabling continued use of fossil fuels while reducing climate impact.
Arguments that technological innovation alone is insufficient:
- Rebound effects (Jevons Paradox): Technological efficiency gains can lead to increased overall consumption because lower costs encourage greater use. For example, more fuel-efficient vehicles may lead to more total driving, offsetting efficiency gains.
- Access and equity issues: Advanced technologies are often expensive and concentrated in developed countries, limiting their global impact. Developing countries may lack the infrastructure, capital, and technical expertise to adopt new technologies at scale.
- Political and institutional barriers: Technology deployment requires supportive policies, regulations, and governance. Without political will and institutional frameworks, even the most effective technologies may not be adopted. Fossil fuel subsidies, for instance, undermine the competitiveness of renewable technologies.
- Behavioural and cultural factors: Technology cannot change consumption patterns driven by cultural norms, social status, or habitual behaviour. Reducing overconsumption requires shifts in values and lifestyles that technology alone cannot achieve.
- Unintended consequences: Some technologies create new environmental problems. For example, lithium-ion batteries for electric vehicles require mining of lithium and cobalt, which can cause water pollution and habitat destruction in mining regions.
Conclusion:
Technological innovation is a necessary and powerful tool for achieving resource sustainability, but it is not sufficient on its own. Effective resource sustainability requires a combination of technological innovation, supportive government policies, behavioural change, equitable access, and institutional reform. Technology must be embedded within a broader framework of social, economic, and political change to deliver lasting sustainability outcomes.
Marking scheme:
- 2 marks for explaining how technology contributes to sustainability (with examples).
- 2 marks for providing specific evidence or case studies.
- 2 marks for discussing limitations of technology-only approaches.
- 1 mark for balanced analysis.
- 1 mark for a supported conclusion.
- Maximum 8 marks.
- Note: One-sided answers score a maximum of 5 marks.
Question 6
(a) Define carrying capacity in the context of resource sustainability. [2]
Answer:
Carrying capacity refers to the maximum population size of a species that an environment can sustain indefinitely, given the available resources (food, water, habitat) and without degrading the environment. In the context of resource sustainability, it represents the level of resource use that can be maintained without depleting natural capital or exceeding the regenerative capacity of ecosystems.
Marking scheme:
- 1 mark for defining carrying capacity as the maximum population or use level an environment can sustain.
- 1 mark for linking it to resource availability, environmental limits, or sustainability.
(b) Explain how population growth affects the carrying capacity of a region. [4]
Answer:
Population growth affects carrying capacity in several interconnected ways:
1. Increased resource demand: A growing population increases demand for water, food, energy, and land. If demand exceeds the regenerative capacity of local resources, the effective carrying capacity is reduced. For example, rapid population growth in the Sahel region of Africa has increased pressure on already limited water and arable land resources.
2. Environmental degradation: Population growth often leads to deforestation, soil erosion, and pollution as more land is converted for agriculture and settlement. This degradation reduces the environment's ability to provide resources, effectively lowering carrying capacity. In Haiti, population pressure has led to severe deforestation, reducing soil fertility and agricultural productivity.
3. Technological and infrastructural adaptation: Population growth can also stimulate investment in technology and infrastructure that increase carrying capacity. Improved irrigation, fertilisers, and crop varieties can boost food production, effectively raising the carrying capacity. The Green Revolution in India during the 1960s–70s significantly increased food production, supporting a larger population.
4. Urbanisation effects: Population growth drives urbanisation, which concentrates resource demand in cities but can also enable more efficient resource distribution through economies of scale in infrastructure, public transport, and waste management.
Marking scheme:
- 2 marks for explaining how population growth increases resource demand and can exceed carrying capacity.
- 2 marks for explaining environmental degradation effects OR technological adaptation effects.
- Maximum 4 marks.
- Note: Answers must explain the mechanism, not just state that population growth affects carrying capacity.
(c) Evaluate the role of government policy in promoting resource sustainability. [8]
Answer:
Government policy plays a central role in promoting resource sustainability, though its effectiveness depends on design, implementation, and enforcement.
Arguments that government policy is effective in promoting resource sustainability:
- Regulation and legislation: Governments can enact laws that limit resource extraction, set pollution standards, and mandate sustainable practices. The European Union's Water Framework Directive requires member states to achieve good ecological status for all water bodies, driving significant improvements in water quality and management.
- Economic instruments: Taxes, subsidies, and trading schemes can incentivise sustainable behaviour. Carbon taxes (e.g., Sweden's carbon tax of approximately €120/tonne) have been effective in reducing emissions. Singapore's carbon tax and water pricing policies encourage conservation and efficiency.
- Investment in public goods: Governments can fund research, infrastructure, and education that support sustainability. Public investment in renewable energy research has driven down costs, and government-funded public transport systems reduce private vehicle use.
- International cooperation: Governments negotiate international agreements (e.g., the Paris Agreement, Convention on Biological Diversity) that set global frameworks for resource sustainability, enabling coordinated action on transboundary issues.
Limitations of government policy:
- Political short-termism: Electoral cycles can prioritise short-term economic gains over long-term sustainability. Politicians may avoid unpopular measures (e.g., fuel taxes) that are necessary for sustainability but politically costly.
- Enforcement challenges: Even well-designed policies may fail due to weak enforcement, corruption, or lack of monitoring capacity. Illegal logging persists in many countries despite legal protections for forests.
- Unintended consequences: Policies can have perverse effects. Biofuel mandates in the EU and US, intended to reduce fossil fuel use, led to deforestation in Southeast Asia as land was converted to palm oil production.
- Lobbying and vested interests: Powerful industries may lobby against sustainability policies. Fossil fuel companies have historically lobbied against climate legislation, delaying effective action.
- One-size-fits-all approaches: National policies may not account for local variations in resource availability, cultural practices, or economic conditions, reducing their effectiveness.
Conclusion:
Government policy is essential for promoting resource sustainability, as it provides the regulatory framework, economic incentives, and public investment that markets alone cannot deliver. However, policy effectiveness depends on strong governance, long-term political commitment, adaptive management, and the ability to balance competing interests. The most effective approaches combine regulation, economic instruments, public investment, and community engagement, tailored to local contexts and supported by international cooperation.
Marking scheme:
- 2 marks for explaining how government policy promotes sustainability (with examples).
- 2 marks for providing specific evidence or case studies.
- 2 marks for discussing limitations or challenges.
- 1 mark for balanced analysis.
- 1 mark for a supported conclusion.
- Maximum 8 marks.
- Note: One-sided answers score a maximum of 5 marks.
End of Answer Key
Total Marks: 60
| Section | Marks |
|---|---|
| Section A (Q1–Q3) | 30 |
| Section B (Q4–Q6) | 30 |
| Total | 60 |
Free quiz and exam paper access
Enter your details to view this paper
Your access is remembered on this device.