From Real Exams Exam Paper
A Level H1 Geography Practice Paper 5
Free A Level H1 Geography Practice Paper 5, LongCat Exam version, with questions, answers, and A Level-style practice for Singapore students.
These static practice materials are generated from the site's syllabus and paper-generation workflow, with source and model context shown so students and parents can evaluate the material before use.
Questions
TuitionGoWhere Practice Paper - Geography H1 A-Level
TuitionGoWhere Secondary School (AI)
| Subject: | Geography |
| Level: | A-Level H1 |
| Paper: | Practice Paper (Resources & Sustainability) |
| Version: | 5 of 5 |
| Duration: | 1 hour 30 minutes |
| Total Marks: | 60 |
| Name: | ________________________ |
| Class: | ________________________ |
| Date: | ________________________ |
Instructions to Candidates:
- Write your name, class, and date in the spaces provided above.
- Answer ALL questions in Section A and Section B.
- Write your answers in the spaces provided.
- Begin each section on a fresh page.
- The number of marks for each question or part-question is shown in brackets [ ].
- You are advised to spend approximately 45 minutes on Section A and 45 minutes on Section B.
- Credit will be given for the use of relevant examples and case studies.
Section A: Source-Based Questions (30 marks)
Answer ALL questions in this section.
Question 1
Study Resource A below, which shows the global water stress index for selected countries in 2023.
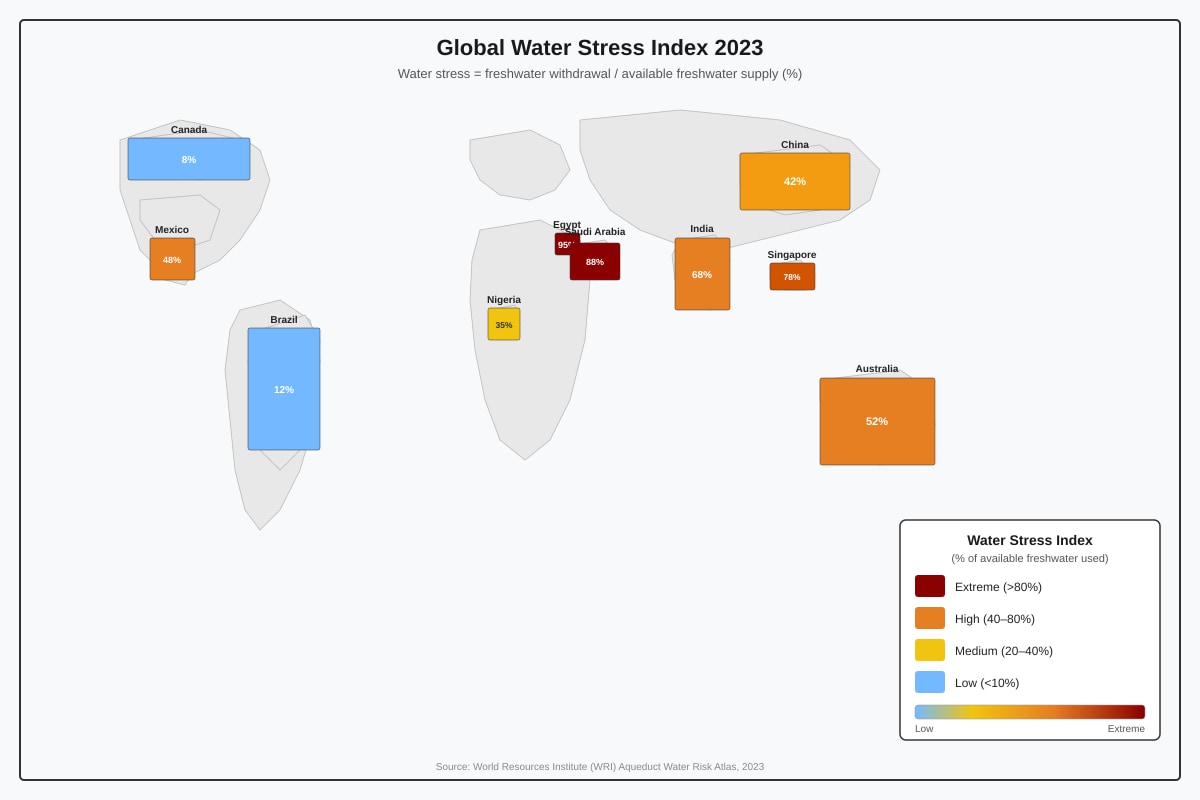
Generated map for Q1.
(a) Describe the global pattern of water stress shown in Resource A. [4]
.......................................................................................................................
.......................................................................................................................
.......................................................................................................................
.......................................................................................................................
.......................................................................................................................
.......................................................................................................................
(b) Explain two possible reasons why Singapore experiences high water stress despite being a high-income country. [4]
.......................................................................................................................
.......................................................................................................................
.......................................................................................................................
.......................................................................................................................
.......................................................................................................................
.......................................................................................................................
(c) Suggest two strategies that a country with extreme water stress, such as Egypt, could adopt to improve its water sustainability. For each strategy, explain how it would help. [6]
.......................................................................................................................
.......................................................................................................................
.......................................................................................................................
.......................................................................................................................
.......................................................................................................................
.......................................................................................................................
.......................................................................................................................
.......................................................................................................................
.......................................................................................................................
.......................................................................................................................
.......................................................................................................................
.......................................................................................................................
Question 2
Study Resource B below, which shows data on food waste and food insecurity in selected regions in 2022.
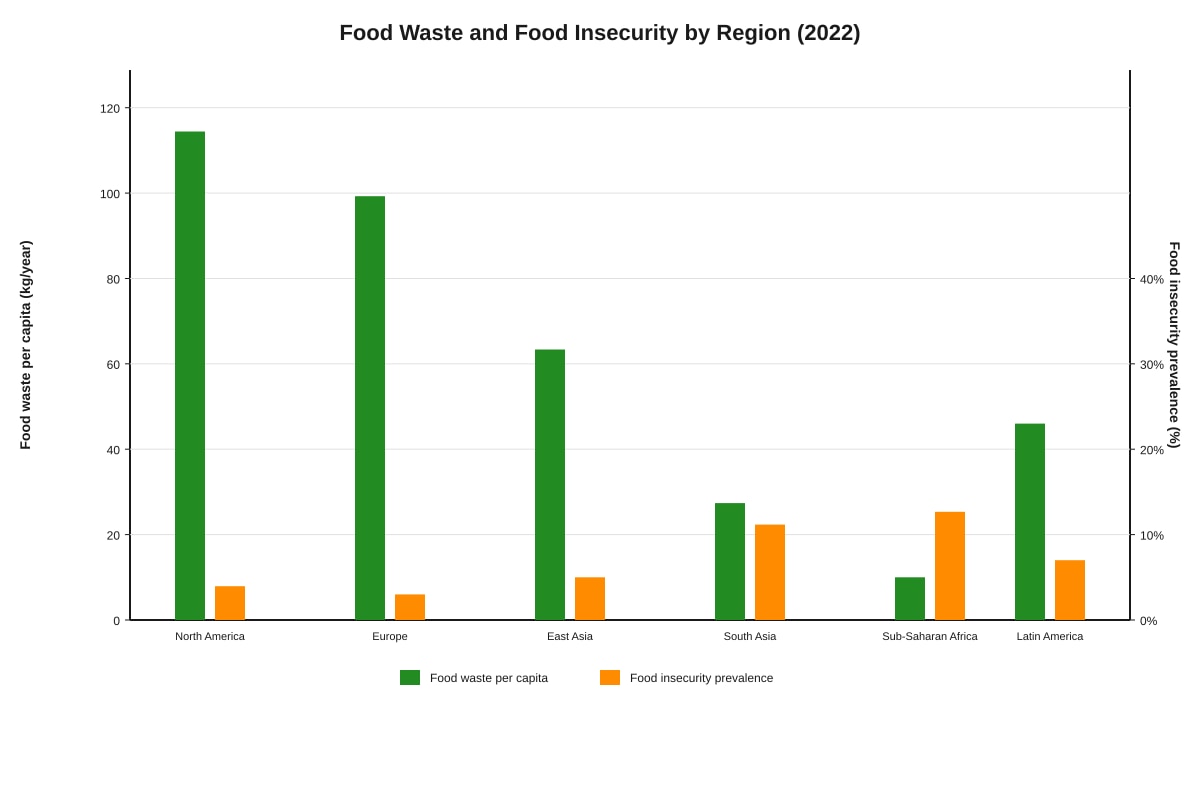
Generated chart for Q2.
(a) Compare the levels of food waste and food insecurity between North America and Sub-Saharan Africa as shown in Resource B. [3]
.......................................................................................................................
.......................................................................................................................
.......................................................................................................................
.......................................................................................................................
.......................................................................................................................
(b) Account for the relationship between food waste and food insecurity shown in Resource B. [5]
.......................................................................................................................
.......................................................................................................................
.......................................................................................................................
.......................................................................................................................
.......................................................................................................................
.......................................................................................................................
.......................................................................................................................
.......................................................................................................................
.......................................................................................................................
(c) To what extent can reducing food waste alone solve the problem of food insecurity? Discuss with reference to examples. [8]
.......................................................................................................................
.......................................................................................................................
.......................................................................................................................
.......................................................................................................................
.......................................................................................................................
.......................................................................................................................
.......................................................................................................................
.......................................................................................................................
.......................................................................................................................
.......................................................................................................................
.......................................................................................................................
.......................................................................................................................
.......................................................................................................................
.......................................................................................................................
.......................................................................................................................
.......................................................................................................................
Section B: Structured and Essay Questions (30 marks)
Answer ALL questions in this section.
Question 3
(a) Define the term sustainable development. [2]
.......................................................................................................................
.......................................................................................................................
(b) Explain why achieving resource sustainability is more challenging for developing countries than for developed countries. [6]
.......................................................................................................................
.......................................................................................................................
.......................................................................................................................
.......................................................................................................................
.......................................................................................................................
.......................................................................................................................
.......................................................................................................................
.......................................................................................................................
.......................................................................................................................
.......................................................................................................................
.......................................................................................................................
.......................................................................................................................
(c) "Technological innovation is the most effective way to achieve resource sustainability." How far do you agree with this statement? Discuss with reference to examples. [10]
.......................................................................................................................
.......................................................................................................................
.......................................................................................................................
.......................................................................................................................
.......................................................................................................................
.......................................................................................................................
.......................................................................................................................
.......................................................................................................................
.......................................................................................................................
.......................................................................................................................
.......................................................................................................................
.......................................................................................................................
.......................................................................................................................
.......................................................................................................................
.......................................................................................................................
.......................................................................................................................
.......................................................................................................................
.......................................................................................................................
.......................................................................................................................
.......................................................................................................................
.......................................................................................................................
.......................................................................................................................
.......................................................................................................................
.......................................................................................................................
.......................................................................................................................
.......................................................................................................................
.......................................................................................................................
.......................................................................................................................
.......................................................................................................................
Question 4
Study Resource C below, which shows the change in energy mix for Country X between 2000 and 2023.
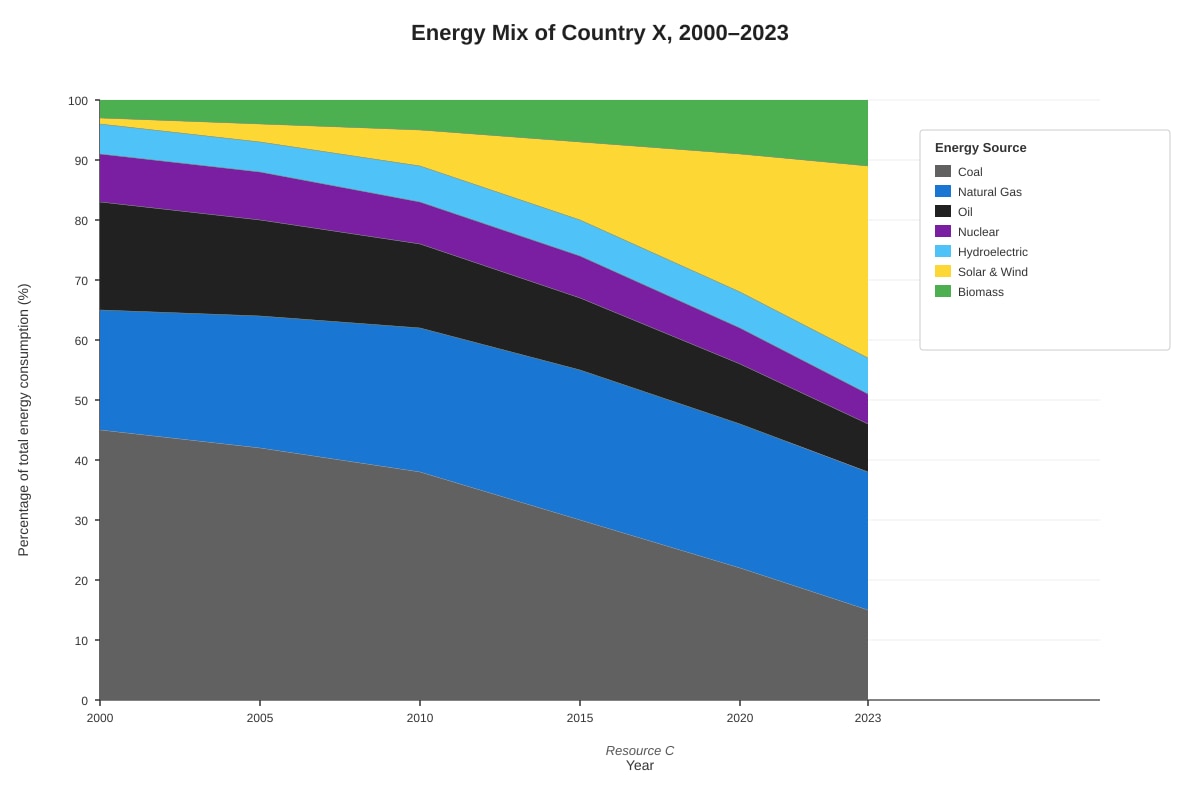
Generated chart for Q4.
(a) Describe the changes in Country X's energy mix between 2000 and 2023 as shown in Resource C. [4]
.......................................................................................................................
.......................................................................................................................
.......................................................................................................................
.......................................................................................................................
.......................................................................................................................
.......................................................................................................................
.......................................................................................................................
.......................................................................................................................
(b) Explain three factors that could have contributed to the changes in Country X's energy mix. [6]
.......................................................................................................................
.......................................................................................................................
.......................................................................................................................
.......................................................................................................................
.......................................................................................................................
.......................................................................................................................
.......................................................................................................................
.......................................................................................................................
.......................................................................................................................
.......................................................................................................................
.......................................................................................................................
.......................................................................................................................
.......................................................................................................................
.......................................................................................................................
.......................................................................................................................
.......................................................................................................................
.......................................................................................................................
.......................................................................................................................
(c) Evaluate the effectiveness of transitioning to renewable energy sources as a strategy for achieving resource sustainability. [6]
.......................................................................................................................
.......................................................................................................................
.......................................................................................................................
.......................................................................................................................
.......................................................................................................................
.......................................................................................................................
.......................................................................................................................
.......................................................................................................................
.......................................................................................................................
.......................................................................................................................
.......................................................................................................................
.......................................................................................................................
End of Paper
Total Marks: 60
| Section | Marks |
|---|---|
| Section A: Q1(a) | 4 |
| Section A: Q1(b) | 4 |
| Section A: Q1(c) | 6 |
| Section A: Q2(a) | 3 |
| Section A: Q2(b) | 5 |
| Section A: Q2(c) | 8 |
| Section B: Q3(a) | 2 |
| Section B: Q3(b) | 6 |
| Section B: Q3(c) | 10 |
| Section B: Q4(a) | 4 |
| Section B: Q4(b) | 6 |
| Section B: Q4(c) | 6 |
| Total | 60 |
Answers
TuitionGoWhere Practice Paper - Geography H1 A-Level
Answer Key & Marking Scheme
Paper: Practice Paper (Resources & Sustainability) — Version 5 of 5
Section A: Source-Based Questions
Question 1(a) [4 marks]
Question: Describe the global pattern of water stress shown in Resource A.
Marking Scheme:
| Marks | Descriptor |
|---|---|
| 1–2 | Basic description identifying one or two countries/regions with limited attempt at a global pattern. May list values without organising spatially. |
| 3–4 | Clear description of the global pattern with reference to specific data from the resource. Organised spatially (e.g., by region or development level). |
Expected Answer:
Countries in North Africa and the Middle East experience the most extreme water stress, with Egypt (95%) and Saudi Arabia (88%) recording the highest levels. Parts of Asia also face high stress, with Singapore at 78% and India at 68%. In contrast, countries in South America (Brazil at 12%) and North America (Canada at 8%) experience relatively low water stress. Australia (52%) and Mexico (48%) fall in the medium-to-high range. There is a general trend where arid/semi-arid regions and densely populated small states face higher water stress, while countries with abundant freshwater resources and lower population densities face lower stress.
Teaching Notes:
- Water stress measures the ratio of total water withdrawals to available renewable water supplies. A value above 80% indicates extreme stress, meaning demand is dangerously close to (or exceeding) supply.
- When describing patterns on a world map, students should group observations spatially rather than simply listing countries. Use directional or regional language (e.g., "North Africa and the Middle East," "parts of South America").
- Always quote specific data from the resource to support the description. This is a "describe" question, so explanation is not required—only identification of the pattern.
Common Mistakes:
- Explaining why patterns exist instead of just describing them (this wastes time as no marks are awarded for explanation in a "describe" question).
- Failing to reference specific values from the resource.
Question 1(b) [4 marks]
Question: Explain two possible reasons why Singapore experiences high water stress despite being a high-income country.
Marking Scheme:
| Marks | Descriptor |
|---|---|
| 1–2 | One reason explained clearly, or two reasons stated but not well developed. |
| 3–4 | Two well-explained reasons with clear causal chains linking each reason to water stress in Singapore. |
Expected Answer:
Reason 1: Limited land area for water catchment. Singapore is a small island city-state with a land area of only approximately 730 km². Despite having two-thirds of its land designated as water catchment, the total volume of freshwater that can be collected is inherently limited by its physical size. This constrains the natural supply of freshwater, contributing to high water stress.
Reason 2: High per capita water demand driven by dense population and economic activity. Singapore has a population density of over 7,800 people per km², one of the highest in the world. Combined with significant industrial and commercial water use, total demand is very high relative to the available supply. Daily water consumption is approximately 430 million gallons per day, placing enormous pressure on existing water resources.
Teaching Notes:
- Singapore is an excellent case study for understanding that water stress is not solely a function of income or development level. Physical geography (limited land, no major rivers or aquifers) and demographic factors (high population density) are equally important.
- Singapore addresses this through the "Four National Taps" strategy: local catchment, imported water (from Malaysia), NEWater (recycled water), and desalination.
Common Mistakes:
- Assuming high-income countries automatically have low water stress (wealth helps with technology but does not overcome physical constraints).
- Not linking the reason specifically to Singapore's context.
Question 1(c) [6 marks]
Question: Suggest two strategies that a country with extreme water stress, such as Egypt, could adopt to improve its water sustainability. For each strategy, explain how it would help.
Marking Scheme:
| Marks | Descriptor |
|---|---|
| 1–2 | One strategy suggested with limited explanation, or two strategies listed without clear explanation of how they help. |
| 3–4 | Two strategies suggested with adequate explanation of how each would improve water sustainability. |
| 5–6 | Two well-developed strategies with clear, detailed explanations showing strong understanding of water sustainability principles. Specific reference to Egypt's context where relevant. |
Expected Answer:
Strategy 1: Investment in desalination plants. Egypt could expand its desalination capacity, particularly along its Mediterranean and Red Sea coastlines. Desalination converts seawater into freshwater, providing an additional source that is independent of rainfall and Nile River flows. This would reduce Egypt's dependence on the Nile, which currently supplies over 90% of its freshwater, and provide a climate-resilient supply. However, desalination is energy-intensive and expensive, so Egypt would need to invest in renewable energy to power these plants sustainably.
Strategy 2: Modernisation of irrigation systems in agriculture. Agriculture accounts for approximately 80% of Egypt's water consumption, much of which is used inefficiently through traditional flood irrigation. By transitioning to drip irrigation and sprinkler systems, Egypt could significantly reduce water wastage. Drip irrigation delivers water directly to plant roots, reducing evaporation and runoff. This would free up water for domestic and industrial use, improving overall water sustainability without reducing agricultural output.
Teaching Notes:
- Water sustainability means meeting current water needs without compromising the ability of future generations to meet theirs. Strategies should address either increasing supply (e.g., desalination, water recycling) or reducing demand (e.g., efficiency improvements, conservation).
- Egypt is heavily dependent on the Nile River, and the Grand Ethiopian Renaissance Dam (GERD) poses a significant threat to its water security, making diversification of water sources critical.
Common Mistakes:
- Suggesting strategies that are not feasible for Egypt's context (e.g., "increase rainfall" — not possible).
- Stating strategies without explaining how they improve sustainability.
Question 2(a) [3 marks]
Question: Compare the levels of food waste and food insecurity between North America and Sub-Saharan Africa as shown in Resource B.
Marking Scheme:
| Marks | Descriptor |
|---|---|
| 1 | Basic comparison with limited or no data reference. |
| 2 | Clear comparison with some data reference. |
| 3 | Detailed, accurate comparison with full data reference for both regions and both variables. |
Expected Answer:
North America has very high food waste per capita at 115 kg/year but very low food insecurity at only 8% of the population. In contrast, Sub-Saharan Africa has very low food waste per capita at only 18 kg/year but extremely high food insecurity at 33% of the population. This shows an inverse relationship: the region that wastes the most food has the least food insecurity, while the region that wastes the least food has the highest food insecurity. North America wastes over six times more food per capita than Sub-Saharan Africa, yet Sub-Saharan Africa's food insecurity rate is over four times higher.
Teaching Notes:
- A "compare" question requires students to identify both similarities and differences. In this case, the key comparison is the inverse relationship between food waste and food insecurity.
- Always use specific data values from the resource. Vague statements like "North America wastes more food" without quoting "115 kg/year" will not score full marks.
Common Mistakes:
- Only describing one region without comparing it to the other.
- Not using specific data values from the resource.
Question 2(b) [5 marks]
Question: Account for the relationship between food waste and food insecurity shown in Resource B.
Marking Scheme:
| Marks | Descriptor |
|---|---|
| 1–2 | Basic explanation with limited reference to the resource. May only address one side of the relationship. |
| 3–4 | Good explanation of the inverse relationship with reference to the resource and some understanding of underlying causes. |
| 5 | Well-developed explanation with clear causal reasoning, reference to the resource, and understanding of the structural factors driving the relationship. |
Expected Answer:
The data shows an inverse relationship: regions with high food waste tend to have low food insecurity, and vice versa. This can be accounted for by several factors:
In high-income regions (North America, Europe): High levels of food waste occur at the consumer and retail stages due to over-purchasing, aesthetic standards for produce, and "best before" date confusion. However, high incomes, well-developed food distribution systems, and strong social safety nets mean that food insecurity remains low. Food is abundant and affordable relative to incomes, so waste occurs not from scarcity but from surplus and consumer behaviour.
In low-income regions (Sub-Saharan Africa, South Asia): Food waste is low at the consumer level because food is scarce and valuable. However, food insecurity is high due to poverty (people cannot afford sufficient food), inadequate storage and transport infrastructure (post-harvest losses occur but are not counted as "waste" in the same way), conflict, and climate-related crop failures. The food that is produced does not always reach those who need it due to distributional inefficiencies and economic barriers.
Teaching Notes:
- "Account for" means explain the reasons behind the pattern or relationship shown. Students must go beyond description to provide causal explanations.
- The key insight is that food waste and food insecurity are driven by different factors at different stages of the food supply chain. In wealthy countries, waste is a consumption-side problem; in poor countries, food insecurity is a production- and distribution-side problem.
Common Mistakes:
- Simply restating the data without explaining why the relationship exists.
- Confusing food waste with food loss (food loss occurs earlier in the supply chain, especially in developing countries, due to poor storage and transport).
Question 2(c) [8 marks]
Question: To what extent can reducing food waste alone solve the problem of food insecurity? Discuss with reference to examples.
Marking Scheme:
| Marks | Descriptor |
|---|---|
| 1–3 | Basic response with limited understanding. May only address one side of the argument. Little or no reference to examples. |
| 4–6 | Reasonable discussion with some balance. Reference to at least one example. Some attempt at evaluation. |
| 7–8 | Well-balanced, well-structured discussion with clear evaluation. Reference to specific examples. Strong understanding that food waste reduction is necessary but not sufficient. |
Expected Answer:
Introduction: Reducing food waste can contribute to reducing food insecurity, but it alone cannot fully solve the problem because food insecurity is driven by multiple interconnected factors including poverty, conflict, climate change, and inadequate infrastructure.
How reducing food waste can help:
- The UN FAO estimates that one-third of all food produced globally is wasted. If this waste were reduced, more food would be available for consumption without increasing production. For example, France introduced a law in 2016 requiring supermarkets to donate unsold food to charities, redirecting approximately 46,000 tonnes of food annually to people in need.
- Reducing consumer-level waste in wealthy countries could free up food for redistribution. In the UK, the WRAP (Waste and Resources Action Programme) campaign "Love Food Hate Waste" helped reduce household food waste by 21% between 2007 and 2012, freeing up food resources.
Why reducing food waste alone is insufficient:
- Poverty is the primary driver of food insecurity. Even if food is available, people cannot access it if they cannot afford it. In Sub-Saharan Africa, 33% of the population is food insecure, but this is largely due to low incomes and food prices relative to wages, not a lack of food globally.
- Conflict and political instability disrupt food production and distribution. In Yemen, ongoing civil war has created the world's worst food crisis, with 17 million people food insecure. Reducing food waste elsewhere would not address the root cause.
- Climate change is reducing agricultural productivity in vulnerable regions. Droughts in the Horn of Africa have caused repeated crop failures. Addressing food insecurity requires climate adaptation strategies, not just waste reduction.
- Infrastructure deficits in developing countries mean that food often cannot reach markets. In India, an estimated 40% of fruit and vegetables are lost post-harvest due to cold chain deficiencies. Reducing consumer waste in wealthy countries does not address these supply chain losses.
Conclusion: Reducing food waste is a valuable and necessary strategy that can make more food available and reduce environmental pressures from agriculture. However, it cannot alone solve food insecurity because the root causes—poverty, conflict, climate change, and infrastructure—require targeted, systemic interventions. A multi-pronged approach combining waste reduction, poverty alleviation, climate adaptation, and infrastructure investment is needed.
Teaching Notes:
- "To what extent" questions require evaluation. Students must present both sides of the argument and reach a reasoned conclusion.
- Strong answers use specific, named examples (countries, policies, organisations) rather than vague references.
- The conclusion should directly answer the question: reducing food waste helps but is not sufficient alone.
Common Mistakes:
- Writing a one-sided answer that only argues food waste reduction is effective (or ineffective) without balance.
- Using vague examples like "some countries" instead of naming specific cases.
- Not reaching a clear conclusion.
Question 3(a) [2 marks]
Question: Define the term sustainable development.
Marking Scheme:
| Marks | Descriptor |
|---|---|
| 0 | Incorrect or no definition. |
| 1 | Partial definition capturing some elements. |
| 2 | Clear, accurate definition. |
Expected Answer:
Sustainable development is development that meets the needs of the present without compromising the ability of future generations to meet their own needs. (Brundtland Commission, 1987.) It involves balancing economic growth, social equity, and environmental protection to ensure long-term viability of resources and human well-being.
Teaching Notes:
- The Brundtland definition is the most widely accepted and should be memorised. Students should also understand the three pillars: economic, social, and environmental sustainability.
- Resource sustainability is a subset of sustainable development, focusing specifically on the management of natural resources (water, energy, food, minerals) to ensure their availability for future use.
Question 3(b) [6 marks]
Question: Explain why achieving resource sustainability is more challenging for developing countries than for developed countries.
Marking Scheme:
| Marks | Descriptor |
|---|---|
| 1–2 | One or two basic points with limited development. |
| 3–4 | Several relevant points with reasonable explanation. |
| 5–6 | Well-developed explanation with multiple clearly explained reasons and, where relevant, reference to examples. |
Expected Answer:
1. Poverty and immediate survival needs: Developing countries often face pressing short-term needs such as food security, clean water access, and energy for basic services. This makes it difficult to prioritise long-term sustainability. For example, in rural India, communities may rely on cutting down forests for fuel wood because they cannot afford alternative energy sources, even though this leads to deforestation and soil degradation.
2. Limited financial resources and technology: Sustainable resource management often requires significant investment in technology and infrastructure (e.g., renewable energy systems, water treatment plants, modern irrigation). Developing countries may lack the capital and technical expertise to implement these solutions. For instance, sub-Saharan African countries have abundant solar resources but limited funds to install solar panels at scale.
3. Rapid population growth and urbanisation: Many developing countries are experiencing rapid population growth and urbanisation, which increases demand for resources. For example, Lagos, Nigeria, is growing at approximately 3% per year, placing enormous pressure on water, energy, and waste management systems. This rapid growth makes it difficult to plan and implement sustainable resource management.
4. Weak governance and institutional capacity: Effective resource sustainability requires strong regulatory frameworks, enforcement, and long-term planning. Developing countries may have weaker institutions, corruption, or political instability that undermines sustainable management. For example, illegal logging persists in parts of Southeast Asia due to weak enforcement of forestry regulations.
5. Dependence on primary resource extraction: Many developing countries rely heavily on extracting and exporting natural resources (e.g., oil, minerals, timber) for economic growth. This creates a tension between economic development and sustainability. For example, the Democratic Republic of Congo depends on cobalt mining for export revenue, but mining causes environmental degradation and social problems.
Teaching Notes:
- This question requires students to compare developing and developed countries. Strong answers explicitly contrast the two (e.g., "while developed countries can afford to invest in renewable energy, developing countries may not have the financial capacity").
- Students should aim for 3–4 well-developed reasons rather than many superficial points.
Common Mistakes:
- Only discussing developing countries without contrasting with developed countries.
- Being too vague (e.g., "developing countries are poor" without explaining how poverty specifically hinders sustainability).
Question 3(c) [10 marks]
Question: "Technological innovation is the most effective way to achieve resource sustainability." How far do you agree with this statement? Discuss with reference to examples.
Marking Scheme:
| Marks | Descriptor |
|---|---|
| 1–3 | Basic response with limited understanding. One-sided argument. Few or no examples. |
| 4–6 | Reasonable discussion with some balance. At least one example. Some evaluation but may lack depth. |
| 7–8 | Good discussion with clear balance. Multiple examples. Sound evaluation. |
| 9–10 | Excellent, well-structured discussion with strong evaluation. Multiple specific examples. Clear, reasoned conclusion directly addressing the question. |
Expected Answer:
Introduction: Technological innovation plays a crucial role in advancing resource sustainability, but claiming it is the most effective way is an overstatement. Achieving resource sustainability requires a combination of technological, behavioural, policy, and institutional approaches. Technology alone cannot address the root causes of resource depletion, which are often social, economic, and political in nature.
Arguments supporting the importance of technological innovation:
-
Renewable energy technology has dramatically reduced the cost of solar and wind power. The cost of solar photovoltaic (PV) panels has fallen by over 90% since 2010, making solar energy cost-competitive with fossil fuels in many regions. Countries like Germany have used feed-in tariffs and technological investment to generate over 40% of their electricity from renewables, significantly reducing carbon emissions and fossil fuel dependence.
-
Agricultural technology such as precision farming, genetically modified crops, and drip irrigation has increased food production while reducing resource use. In Israel, drip irrigation technology has enabled the country to achieve agricultural self-sufficiency despite being 60% desert, using 50% less water per unit of crop produced compared to traditional flood irrigation.
-
Water recycling and desalination technology has allowed water-scarce countries to diversify their water supply. Singapore's NEWater programme uses advanced membrane technology and ultraviolet disinfection to recycle wastewater into potable water, meeting up to 40% of the nation's water demand.
Arguments against technology being the most effective approach:
-
Behavioural and cultural change is often more impactful and cost-effective than technology. For example, Japan's "Cool Biz" campaign, which encouraged office workers to dress lightly and set air conditioning to 28°C, reduced electricity consumption by approximately 2% nationally—a significant saving achieved through behaviour change rather than new technology. Similarly, reducing food waste at the consumer level requires changes in shopping habits, meal planning, and attitudes toward "imperfect" produce.
-
Policy and governance are essential for creating the framework within which technology can be deployed effectively. The Paris Agreement (2015) has driven global climate action through international cooperation and national commitments, creating market conditions that incentivise clean technology adoption. Without policy frameworks, technology alone may not be adopted at scale.
-
Technology can create new problems. The production of solar panels requires rare earth minerals, the mining of which causes environmental damage. Electric vehicle batteries require lithium and cobalt, often mined in developing countries under poor labour and environmental conditions. This is known as the "rebound effect" or "problem shifting"—solving one sustainability problem while creating another.
-
Technology is not equally accessible. Developing countries may lack the financial resources, infrastructure, and technical expertise to adopt advanced technologies. For example, while desalination is effective for wealthy Gulf states, it is prohibitively expensive for many water-stressed developing countries in sub-Saharan Africa.
Conclusion: Technological innovation is a vital and powerful tool for achieving resource sustainability, and in some contexts (e.g., renewable energy, water recycling), it may be the most impactful single intervention. However, it is not universally the most effective approach. Behavioural change, policy reform, and institutional strengthening are equally important, and the most effective strategies combine multiple approaches. The "most effective" approach depends on the specific resource, context, and scale of the problem.
Teaching Notes:
- This is a 10-mark essay question requiring a structured argument with a clear introduction, balanced body, and conclusion.
- Students must address "most effective"—this requires comparing technology with other approaches, not just listing its benefits.
- Specific, named examples (countries, policies, technologies) are essential for top marks.
- The conclusion must directly answer the question and be supported by the arguments presented.
Common Mistakes:
- Writing a one-sided answer that only discusses the benefits of technology.
- Using vague examples ("some countries have used solar panels").
- Not reaching a clear conclusion that addresses "most effective."
- Writing in continuous paragraphs without clear structure.
Question 4(a) [4 marks]
Question: Describe the changes in Country X's energy mix between 2000 and 2023 as shown in Resource C.
Marking Scheme:
| Marks | Descriptor |
|---|---|
| 1–2 | Basic description identifying one or two changes with limited data reference. |
| 3–4 | Clear, detailed description of multiple changes with specific data reference. Organised chronologically or by energy source. |
Expected Answer:
Country X's energy mix has undergone significant changes between 2000 and 2023. Coal has declined dramatically from 45% to 15% of total energy consumption, a decrease of 30 percentage points. Oil has also fallen from 18% to 8%. In contrast, renewable energy sources have grown substantially: solar and wind combined have increased from just 1% to 32%, making them the largest single source by 2023. Biomass has grown from 3% to 11%. Natural gas has remained relatively stable, increasing slightly from 20% to 23%. Nuclear and hydroelectric have remained largely unchanged at around 5–6% each. Overall, the energy mix has shifted from being dominated by fossil fuels (coal, oil, gas = 83% in 2000) to a more diversified mix with renewables playing a major role (solar/wind/biomass/hydro = 49% in 2023).
Teaching Notes:
- "Describe the changes" requires students to identify trends (increase/decrease/stability) and support them with specific data from the resource.
- Students should organise their answer logically—either by energy source or chronologically.
- Use precise language: "declined from X% to Y%" rather than "went down."
Common Mistakes:
- Only describing one or two changes instead of providing a comprehensive overview.
- Not using specific percentage values from the resource.
Question 4(b) [6 marks]
Question: Explain three factors that could have contributed to the changes in Country X's energy mix.
Marking Scheme:
| Marks | Descriptor |
|---|---|
| 1–2 | One factor explained, or three factors listed without adequate explanation. |
| 3–4 | Two to three factors with reasonable explanation. |
| 5–6 | Three well-explained factors with clear causal reasoning. |
Expected Answer:
Factor 1: Government policy and climate commitments. Country X may have implemented policies to reduce greenhouse gas emissions in line with international agreements such as the Paris Agreement. Carbon taxes, renewable energy subsidies, and coal phase-out mandates could have driven the shift away from coal and toward renewables. For example, many countries have introduced feed-in tariffs or renewable portfolio standards that guarantee prices for renewable energy producers, making investment in solar and wind more attractive.
Factor 2: Declining costs of renewable energy technology. The cost of solar PV and wind turbines has fallen dramatically over the past two decades due to technological improvements, economies of scale, and manufacturing efficiencies (particularly in China). Solar PV costs have decreased by over 90% since 2000, making renewables cost-competitive with or cheaper than fossil fuels in many markets. This economic factor would have encouraged both government and private sector investment in renewables.
Factor 3: Growing public awareness and demand for clean energy. Increasing public concern about climate change, air pollution, and environmental degradation has created political and market pressure for cleaner energy. Consumer demand for green energy, corporate sustainability commitments, and divestment campaigns against fossil fuel companies have all contributed to the shift. For example, many corporations have committed to 100% renewable energy targets (e.g., RE100 initiative), driving demand for solar and wind power.
Teaching Notes:
- Students should aim for three distinct factors covering different dimensions: policy/economic/social or technological.
- Each factor should be explained with a clear causal chain: factor → mechanism → effect on energy mix.
Common Mistakes:
- Listing factors without explaining how they contributed to the changes.
- Repeating the same factor in different words.
Question 4(c) [6 marks]
Question: Evaluate the effectiveness of transitioning to renewable energy sources as a strategy for achieving resource sustainability.
Marking Scheme:
| Marks | Descriptor |
|---|---|
| 1–2 | Basic response with limited evaluation. May only discuss advantages or disadvantages. |
| 3–4 | Reasonable evaluation with some balance. Some reference to context or examples. |
| 5–6 | Well-balanced evaluation with clear advantages and disadvantages. Reference to specific contexts or examples. Clear conclusion on effectiveness. |
Expected Answer:
Advantages (why it is effective):
-
Reduces greenhouse gas emissions. Renewable energy sources such as solar, wind, and hydroelectric produce little to no direct carbon emissions during operation. Transitioning from fossil fuels to renewables is one of the most effective ways to mitigate climate change, which is a major threat to long-term resource sustainability. For example, Denmark now generates over 50% of its electricity from wind power and has reduced its carbon emissions by 40% since 1990.
-
Inexhaustible supply. Unlike fossil fuels, which are finite and depleting, renewable energy sources are essentially unlimited. Solar energy alone provides more energy to Earth in one hour than humanity uses in a year. This makes renewables inherently sustainable in the long term.
-
Reduces air pollution and health impacts. Burning fossil fuels causes air pollution, which leads to respiratory diseases and premature deaths. Transitioning to renewables improves public health and reduces healthcare costs, contributing to social sustainability.
Limitations (why it has challenges):
-
Intermittency and storage challenges. Solar and wind energy are intermittent—they only produce electricity when the sun shines or the wind blows. This creates challenges for grid stability and reliability. Battery storage technology is improving but remains expensive. For example, South Australia experienced a statewide blackout in 2016 partly due to the variability of wind power and insufficient backup capacity.
-
Land use and environmental impacts. Large-scale solar and wind farms require significant land areas, which can conflict with agriculture, biodiversity conservation, and community interests. Hydroelectric dams can disrupt river ecosystems and displace communities. For example, the Three Gorges Dam in China displaced over 1.3 million people and caused significant ecological damage.
-
Resource requirements for manufacturing. Renewable energy infrastructure requires significant amounts of raw materials, including rare earth elements, lithium, and cobalt. Mining these materials can cause environmental degradation and human rights concerns. The DRC produces 70% of the world's cobalt, often using child labour in artisanal mines.
Conclusion: Transitioning to renewable energy is a highly effective strategy for achieving resource sustainability, particularly in terms of reducing emissions and ensuring long-term energy supply. However, it is not without challenges, including intermittency, land use conflicts, and resource extraction impacts. To be fully effective, the transition must be accompanied by investment in energy storage, grid infrastructure, responsible mining practices, and complementary strategies such as energy efficiency and demand management.
Teaching Notes:
- "Evaluate" requires students to weigh both the strengths and limitations of the strategy and reach a judgement.
- Strong answers use specific examples and acknowledge that effectiveness depends on context.
- Students should avoid a simple list of pros and cons; instead, they should develop each point with explanation and evidence.
Common Mistakes:
- Only discussing advantages without acknowledging limitations (or vice versa).
- Not reaching a clear evaluative conclusion.
- Being too vague (e.g., "renewables are good for the environment" without specific explanation).
Summary of Marks
| Question | Part | Marks |
|---|---|---|
| 1 | (a) | 4 |
| 1 | (b) | 4 |
| 1 | (c) | 6 |
| 2 | (a) | 3 |
| 2 | (b) | 5 |
| 2 | (c) | 8 |
| 3 | (a) | 2 |
| 3 | (b) | 6 |
| 3 | (c) | 10 |
| 4 | (a) | 4 |
| 4 | (b) | 6 |
| 4 | (c) | 6 |
| Total | 60 |
Free quiz and exam paper access
Enter your details to view this paper
Your access is remembered on this device.