From Real Exams Exam Paper
A Level H1 Geography Practice Paper 5
Free A Level H1 Geography Practice Paper 5, HY3 Exam version, with questions, answers, and A Level-style practice for Singapore students.
These static practice materials are generated from the site's syllabus and paper-generation workflow, with source and model context shown so students and parents can evaluate the material before use.
Questions
TuitionGoWhere Practice Paper - Geography H1 A-Level (Version 5)
School: TuitionGoWhere Exam Practice (AI)
Subject: Geography H1
Level: A-Level
Paper: Practice Paper (Cluster 1: Resources & Sustainability)
Version: 5 of 5
Duration: 75 minutes
Total Marks: 70
Name: ___________________________
Class: ___________________________
Date: ___________________________
Instructions
- This practice paper contains 20 questions across three sections.
- Section A: Short structured questions (1–8). Section B: Data-based questions (9–14). Section C: Extended response (15–20).
- Answer all questions.
- Use the provided resources and your own knowledge.
- Write clearly and support arguments with evidence.
Section A: Short Structured Questions (22 marks)
Answer all questions. Each question carries the stated mark.
1. [2] Define the term "sustainable development" in the context of urban resource use.
2. [2] State two reasons why cities consume more resources per capita than rural areas.
(i) ______________________________________________________
(ii) ______________________________________________________
3. [3] Explain one environmental impact of poor non-hazardous solid waste management in a low-income city.
4. [3] Identify and explain one social factor that reduces liveability for elderly residents in high-density urban neighbourhoods.
5. [3] Account for the growth of slums in a rapidly urbanising country at an intermediate level of development.
6. [3] State one economic reason for urban reimaging and one environmental risk it may create.
Economic: _________________________________________________
Environmental: _____________________________________________
7. [3] Using the concept of scale, explain why a waste strategy successful in a city-state may face challenges in a large federal country.
8. [3] Describe one way gender inequality can reduce access to urban services such as sanitation.
Section B: Data-Based Questions (28 marks)
9. [5] Resource 1 shows the percentage of households with piped water and regular electricity in Kampong Baru (a peri-urban settlement near Kuala Lumpur) in 2008 and 2023.
| Service | 2008 (%) | 2023 (%) |
|---|---|---|
| Piped water | 41 | 88 |
| Regular electricity | 53 | 94 |
Account for the changes in service provision in Kampong Baru as shown in Resource 1.
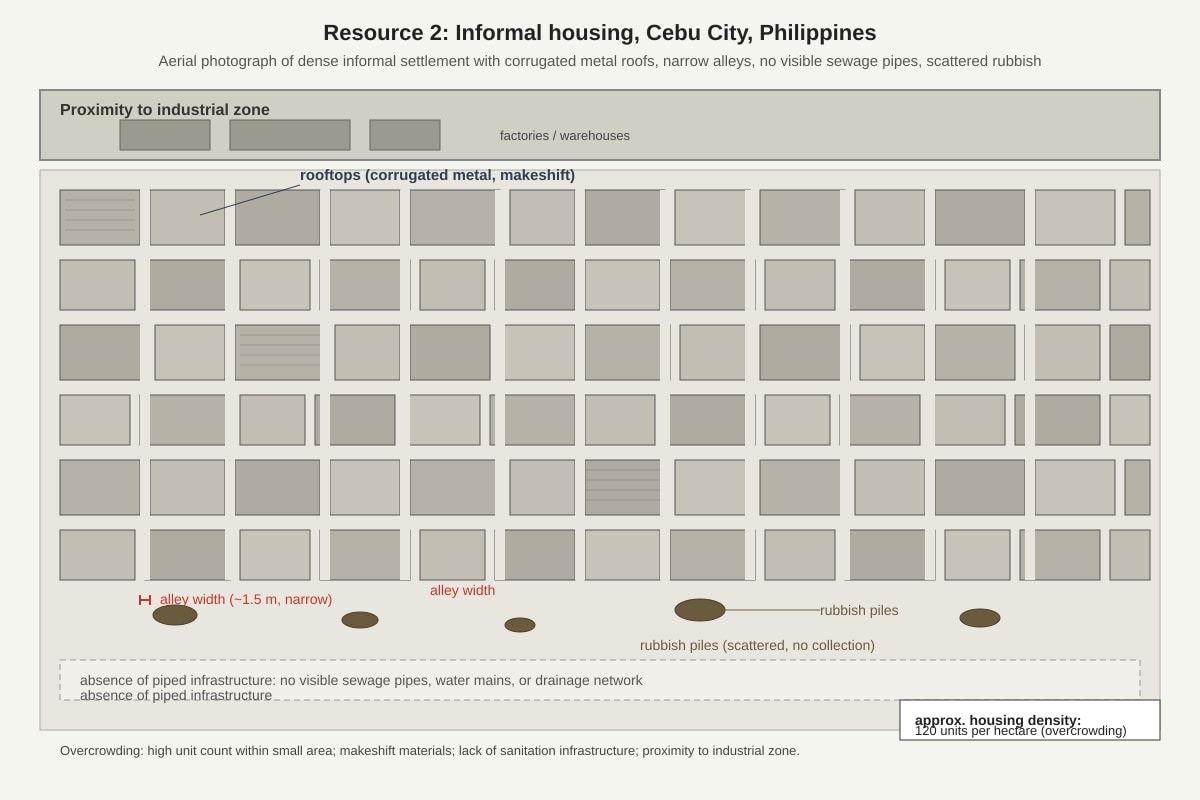
10. [5] Resource 2 is a photograph of informal housing in Cebu City, Philippines.
Image pending generation: source_image for Q10.
Explain the characteristics of the informal settlement as seen in Resource 2.
11. [5] Resource 3 gives municipal solid waste (tonnes/day) for two cities:
| City | 2010 | 2020 |
|---|---|---|
| Hanoi | 1800 | 3600 |
| Singapore | 8400 | 9300 |
Describe the trend and account for the difference in growth rate between the two cities.
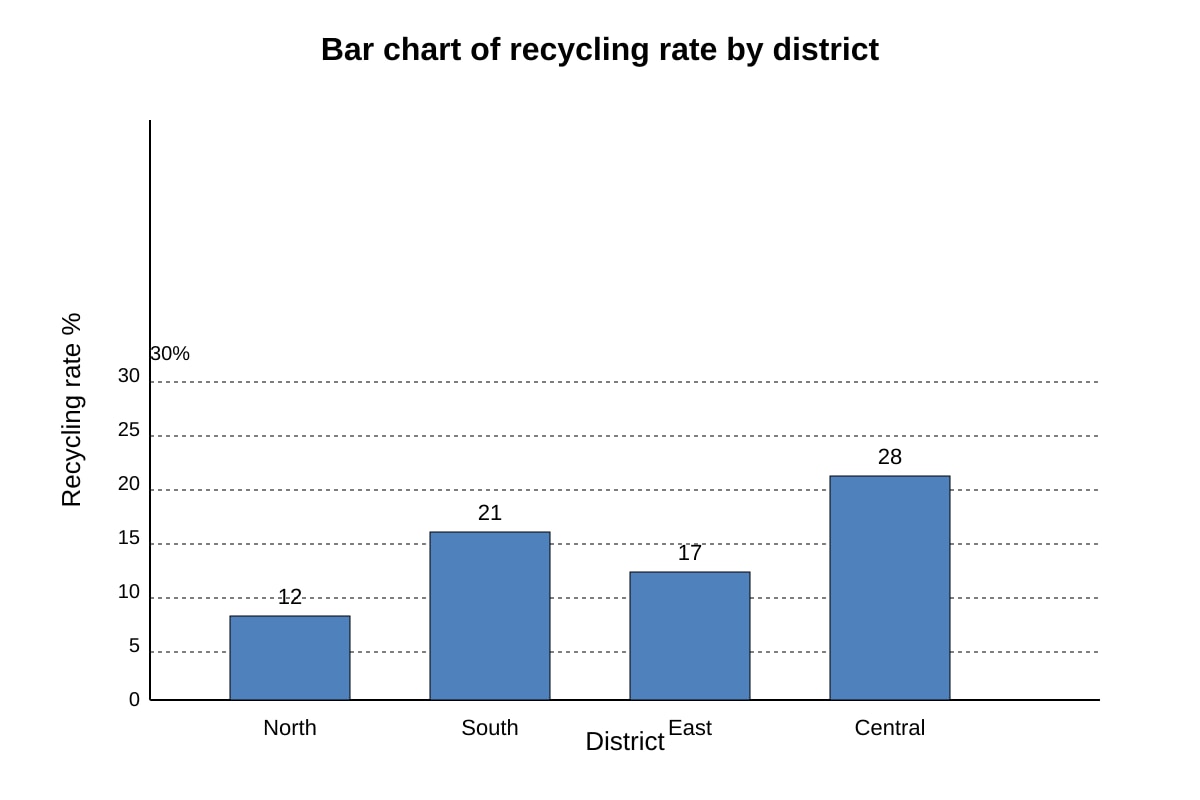
12. [4] Resource 4 is a bar chart of recycling rates (%) in four districts of Jakarta (2022): North 12, South 21, East 17, Central 28.
Image pending generation: chart for Q12.
Suggest two reasons why Central district has the highest recycling rate.
(i) ______________________________________________________
(ii) ______________________________________________________
13. [4] Resource 5 shows a state-led liveability programme in Suzhou, China, including new bus routes and elderly day-care centres. Evaluate the usefulness of Resource 5 in understanding the impacts of state-led efforts to improve urban liveability.
14. [5] Resource 6 and Resource 7 show urban green space per capita (m²) and air particulate (PM2.5) levels for Bangkok and Manila.
| City | Green space (m²/person) | PM2.5 (µg/m³) |
|---|---|---|
| Bangkok | 6.2 | 34 |
| Manila | 4.1 | 41 |
Evaluate the usefulness of Resource 6 and Resource 7 in helping to understand the relationship between urban sustainability and environmental quality.
Section C: Extended Response (20 marks)
15. [4] To what extent is effective waste management more critical for sustainable development in low-income cities than in high-income cities? (Essay plan not required; write full response.)
16. [3] Explain how urban reimaging can create tension between sustainability and liveability.
17. [4] Evaluate the success of slum upgrading strategies in improving lives of dwellers across different development contexts.
18. [3] Discuss one challenge in creating liveable cities for women in rapidly growing Asian megacities.
19. [3] Assess the role of age as an identity marker in shaping experience of urban liveability.
20. [3] To what extent can complementary policies address the tension between economic reimaging and environmental sustainability?
End of Paper — Total Marks: 22 + 28 + 20 = 70
Answers
TuitionGoWhere Practice Paper - Geography H1 A-Level (Version 5) Answer Key
Total Marks: 70
Section A: 22 marks | Section B: 28 marks | Section C: 20 marks
Section A Answers (22 marks)
Q1 [2] Sustainable development = meeting present needs without compromising future generations' ability to meet theirs, within ecological limits.
Marking: 1 mark definition of intergenerational equity, 1 mark reference to resource/environmental limits.
Q2 [2] (i) Higher population density raises absolute demand for water, energy, food. (ii) Concentration of industry/commerce increases per-capita throughput.
Marking: 1 mark each, accept any two valid.
Q3 [3] E.g., open dumping contaminates soil and groundwater (1), harming local agriculture and drinking supply (1), causing health risks in nearby low-income communities (1).
Marking: identify impact + explain mechanism + affected group.
Q4 [3] Social isolation (1) due to limited mobility and lack of age-friendly public spaces (1), reducing psychological well-being and community participation (1).
Marking: factor + explanation + consequence.
Q5 [3] Rural–urban migration exceeds formal housing supply (1), informal land occupation occurs (1), lack of planning at intermediate development stage worsens multiple deprivations (1).
Marking: push-pull + informal response + state capacity.
Q6 [3] Economic: attract investment/tourism (1.5). Environmental risk: gentrification displaces green spaces or increases construction emissions (1.5).
Marking: one each, clear link.
Q7 [3] City-state has centralized governance enabling uniform policy (1); large federal country has sub-national jurisdiction causing uneven implementation (1); spatial scale differences alter logistics cost (1).
Marking: scale concept applied twice.
Q8 [3] Women may face unsafe public sanitation due to poor lighting (1), cultural norms restrict solo use (1), leading to lower access vs men (1).
Marking: identify + explain + outcome.
Section B Answers (28 marks)
Q9 [5] Changes: piped water +47 pts, electricity +41 pts (1). Caused by: (a) municipal infrastructure extension under national water policy (2); (b) grid expansion with affordable tariffs (2). Use data to show scale.
Marking: 1 identify, 2x2 explain with evidence.
Q10 [5] Characteristics: overcrowding (density 120/ha) from influx (1+1); makeshift materials show poverty (1+1); no sewage = service deficit (1+1). Cap 5.
Marking: 2–3 traits each with evidence link.
Q11 [5] Hanoi doubled (1) due to rapid urbanisation/industrialisation (2); Singapore slow growth (1) due to mature infrastructure and stable pop (2).
Marking: trend + contrast explanation.
Q12 [4] (i) Higher income & education in Central (2); (ii) Better collection infrastructure (2).
Marking: 2 valid reasons.
Q13 [4] Useful: shows concrete state intervention (2); limited: no outcome data, single city (2). Balanced judgment.
Marking: strength + limitation.
Q14 [5] Useful: shows inverse link green space/PM2.5 (2); limited: no causality, missing other pollutants (3). Conclude moderate usefulness.
Marking: 2 evidence, 3 limits.
Section C Answers (20 marks)
Q15 [4] Argue low-income cities face acute health/spillover (2), but high-income need circular economy (2). Conclusion with extent.
Descriptors: L2 3–4 balanced evaluation.
Q16 [3] Reimaging boosts liveability via amenities (1) but raises costs harming sustainability (2).
Marking: tension explained.
Q17 [4] Success varies: Brazil upgrading vs African partial (2+2).
Marking: cross-context eval.
Q18 [3] Safety in transit limits women's access (3).
Marking: one challenge developed.
Q19 [3] Elderly need proximity/services shape experience (3).
Marking: age marker applied.
Q20 [3] Green bonds / zoning can align (3).
Marking: policy synergy.
End of Answer Key
Free quiz and exam paper access
Enter your details to view this paper
Your access is remembered on this device.