From Real Exams Exam Paper
A Level H1 Geography Practice Paper 5
Free A Level H1 Geography Practice Paper 5, DeepSeek Exam version, with questions, answers, and A Level-style practice for Singapore students.
These static practice materials are generated from the site's syllabus and paper-generation workflow, with source and model context shown so students and parents can evaluate the material before use.
Questions
TuitionGoWhere Practice Paper - Geography H1 A-Level
TuitionGoWhere Exam Practice (AI)
Subject: Geography H1 (8834) Level: A-Level Paper: Practice Paper 1 – Themes in Geography Version: 5 of 5 Duration: 3 hours Total Marks: 100
Name: _________________________ Class: _________________________ Date: _________________________
Instructions to Candidates
- This paper consists of two compulsory sections.
- Section A tests Theme 1: Climate Change and Flooding.
- Section B tests Theme 2: Urban Change.
- Answer all questions in both sections.
- Write your answers in the spaces provided.
- You are advised to spend approximately 1 hour 30 minutes on each section.
- The number of marks is given in brackets [ ] at the end of each question or part question.
- You should use appropriate case studies and examples to support your answers where relevant.
Section A: Climate Change and Flooding
[50 marks]
Answer all questions in this section.
Question 1: Tropical Cyclone Distribution and Development
Study Resources 1A and 1B, which show information about tropical cyclone activity.
Resource 1A: Global Tropical Cyclone Tracks, 1980–2020
| Ocean Basin | Total Cyclones (1980–2020) | Category 4–5 Cyclones | Peak Season |
|---|---|---|---|
| Western North Pacific | 850 | 310 | July–October |
| Eastern North Pacific | 490 | 120 | July–September |
| North Atlantic | 450 | 95 | August–October |
| South Indian Ocean | 380 | 85 | January–March |
| South Pacific | 280 | 65 | January–March |
| North Indian Ocean | 120 | 15 | May–June, October–November |
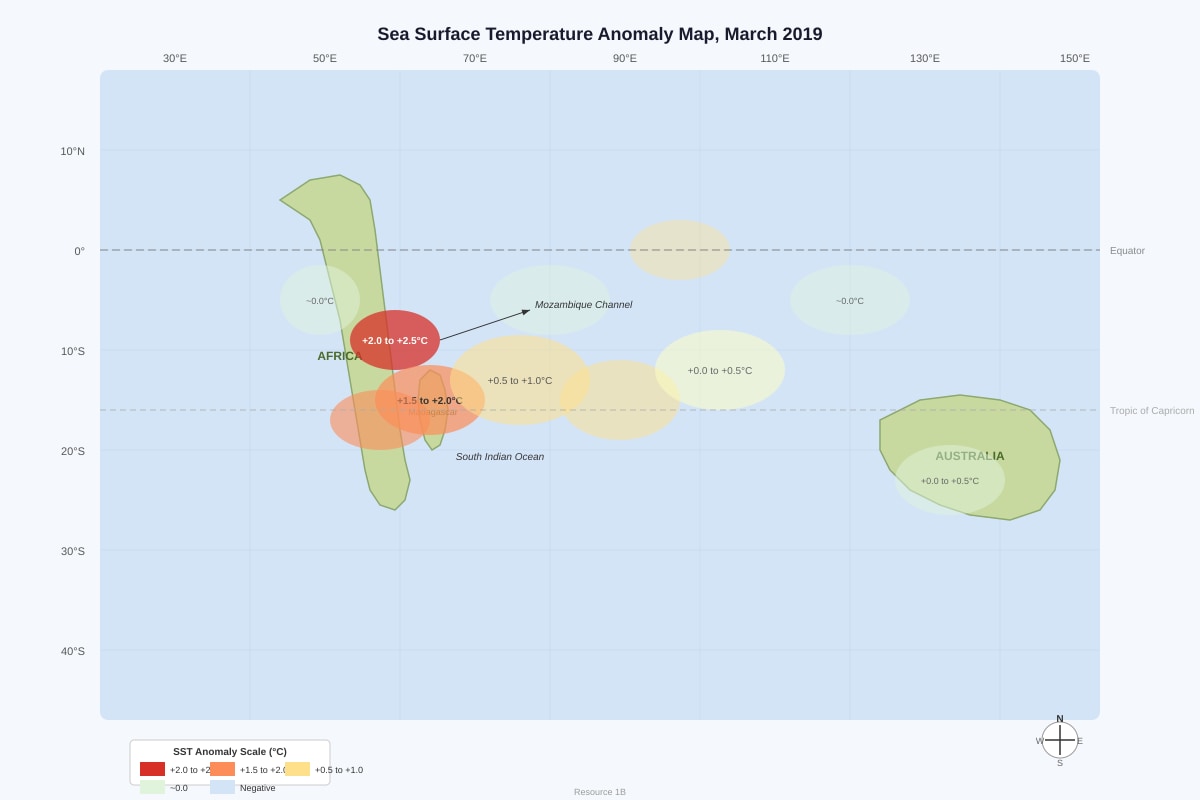
Resource 1B: Sea Surface Temperature Anomaly Map, March 2019
Generated map for this question.
(a) Describe the spatial and temporal distribution of tropical cyclones from 1980 to 2020 as shown in Resource 1A. [4]
(b) With reference to Resources 1A and 1B, explain the development of Tropical Cyclone Idai in the Mozambique Channel in March 2019. [6]
(c) Explain two impacts caused by the floods associated with Tropical Cyclone Idai in Mozambique. [4]
Question 2: Climate Change Evidence and Responses
Study Resources 2A and 2B.
Resource 2A: Global CO₂ Concentrations and Temperature Anomaly, 1880–2020
| Year | CO₂ (ppm) | Temperature Anomaly (°C) |
|---|---|---|
| 1880 | 290 | -0.16 |
| 1920 | 303 | -0.27 |
| 1960 | 317 | -0.03 |
| 1980 | 339 | +0.26 |
| 2000 | 370 | +0.42 |
| 2020 | 414 | +0.98 |
Resource 2B: Extract from IPCC Sixth Assessment Report (2021)
"It is unequivocal that human influence has warmed the atmosphere, ocean and land. Widespread and rapid changes in the atmosphere, ocean, cryosphere and biosphere have occurred. The scale of recent changes across the climate system as a whole and the present state of many aspects of the climate system are unprecedented over many centuries to many thousands of years."
(a) Using Resource 2A, describe the relationship between CO₂ concentrations and global temperature anomaly from 1880 to 2020. Support your answer with data. [4]
(b) With reference to Resource 2B, explain two pieces of evidence, other than rising temperatures, that indicate climate change is occurring. [6]
(c) Evaluate the usefulness of Resource 2A and Resource 2B in helping to understand the causes of contemporary climate change. [8]
Question 3: Climate Change Mitigation Essay
"'Alternative energy sources hold the key for an effective response to climate change.' Evaluate the validity of this statement."
Write an extended response to this question. You should use specific case studies and examples to support your arguments. [16]
Section B: Urban Change
[50 marks]
Answer all questions in this section.
Question 4: Slum Characteristics and Service Provision
Study Resources 4A and 4B.
Resource 4A: Photograph of Kibera informal settlement, Nairobi, Kenya (2022)
[Photograph shows densely packed corrugated iron structures with narrow unpaved pathways. Overhead electricity wires are visible, but there is no visible piped water infrastructure. Open drainage channels run alongside dwellings.]
Resource 4B: Access to Basic Services in Selected Informal Settlements, 2020
| Settlement | City | Population (est.) | Access to Piped Water (%) | Access to Electricity (%) | Access to Improved Sanitation (%) |
|---|---|---|---|---|---|
| Kibera | Nairobi | 250,000 | 20 | 45 | 15 |
| Dharavi | Mumbai | 700,000 | 35 | 80 | 30 |
| Rocinha | Rio de Janeiro | 70,000 | 85 | 98 | 65 |
| Orangi Town | Karachi | 1,500,000 | 40 | 75 | 25 |
(a) Explain the characteristics of Kibera as seen in Resource 4A. [5]
(b) Account for the changes in service provision that might occur as an informal settlement transitions from conditions similar to Kibera to conditions similar to Rocinha, as suggested by Resource 4B. [5]
Question 5: Urban Liveability Investigation
A group of 24 eighteen-year-old students from Tampines Junior College in Singapore wanted to examine liveability for elderly residents in the Tampines neighbourhood. They had access to selected demographic data showing that 15% of Tampines residents were aged 65 and above. The students decided to conduct their investigation at two sites: Site A (Tampines Central, near the MRT station and bus interchange) and Site B (Tampines North, a newer residential extension with fewer amenities).
The students proposed the following methods:
- Land use survey at both sites
- Questionnaire survey with 50 elderly residents at each site
- Pedestrian count at three time periods (morning, afternoon, evening)
(a) State a suitable hypothesis for this investigation. [2]
(b) Explain how the students could minimise the impact of their investigation differently at Site A and Site B. [4]
(c) Evaluate the usefulness of the proposed investigation in understanding the impacts of recent state-led efforts to improve urban liveability for the elderly in Singapore. [8]
Question 6: Slums and Sustainable Urban Development Essay
"'Slums are the greatest impediment confronting cities in achieving sustainable urban development.' How far do you agree with this statement?"
Write an extended response to this question. You should use specific case studies and examples to support your arguments. [16]
END OF PAPER
Copyright © TuitionGoWhere Exam Practice (AI). This is a practice paper generated for educational purposes.
Answers
TuitionGoWhere Practice Paper - Geography H1 A-Level
Answer Key and Marking Scheme
Version: 5 of 5 Total Marks: 100
Section A: Climate Change and Flooding (50 marks)
Question 1: Tropical Cyclone Distribution and Development
(a) Describe the spatial and temporal distribution of tropical cyclones from 1980 to 2020 as shown in Resource 1A. [4]
Answer/Marking Notes:
Award 1 mark for each valid spatial or temporal description supported by data from the resource. Maximum 4 marks.
Spatial distribution (award up to 2 marks):
- Tropical cyclones are concentrated in the Northern Hemisphere, with the Western North Pacific recording the highest number (850 cyclones) [1]
- The North Indian Ocean has the fewest cyclones (120), indicating lower cyclone activity near the equator [1]
- Cyclone activity is highest in the western Pacific and lowest in the northern Indian Ocean [1]
- Accept any valid spatial comparison with data support
Temporal distribution (award up to 2 marks):
- In the Northern Hemisphere, peak cyclone season occurs between July and October (Western North Pacific, Eastern North Pacific, North Atlantic) [1]
- In the Southern Hemisphere (South Indian Ocean, South Pacific), peak season occurs between January and March, reflecting the austral summer [1]
- Cyclone activity shows clear seasonal patterns linked to hemispheric summer/autumn periods [1]
- Accept any valid temporal description with data support
(b) With reference to Resources 1A and 1B, explain the development of Tropical Cyclone Idai in the Mozambique Channel in March 2019. [6]
Answer/Marking Notes:
Award marks for explaining the conditions and mechanisms of cyclone development, with specific reference to both resources. Maximum 6 marks.
Level 3 (5–6 marks): Detailed explanation linking atmospheric conditions from both resources to cyclone development mechanisms. Clear reference to specific data.
Level 2 (3–4 marks): Some explanation of development with partial reference to resources. May describe conditions without fully explaining mechanisms.
Level 1 (1–2 marks): Basic description of cyclone conditions with limited explanation or resource reference.
Expected content:
- Resource 1B shows positive SST anomalies of +1.5°C to +2.5°C in the Mozambique Channel, providing sea surface temperatures well above the 26.5°C threshold required for cyclone formation [1]
- The warm ocean water provides energy through evaporation, creating warm, moist air that rises, leading to low atmospheric pressure at the surface [1]
- Resource 1A confirms that March falls within the peak cyclone season (January–March) for the South Indian Ocean basin, indicating favourable seasonal conditions [1]
- At the latitude of the Mozambique Channel (approximately 15–20°S), the Coriolis force is sufficient to initiate rotation of the developing low-pressure system [1]
- The combination of high SST, low pressure, sufficient Coriolis force, and low vertical wind shear (implied by the sustained anomalies) enabled rapid intensification of Idai [1]
- The Mozambique Channel's geography funnels and concentrates cyclone energy, contributing to Idai's development into a Category 4 equivalent storm [1]
(c) Explain two impacts caused by the floods associated with Tropical Cyclone Idai in Mozambique. [4]
Answer/Marking Notes:
Award 2 marks for each well-explained impact (1 mark for identification, 1 mark for explanation/elaboration). Maximum 4 marks.
Possible impacts:
-
Loss of life and displacement: Flooding from Idai caused over 600 deaths in Mozambique and displaced approximately 146,000 people. The storm surge and heavy rainfall overwhelmed low-lying coastal communities, destroying homes and forcing residents to seek shelter in temporary accommodation. [2]
-
Destruction of agricultural land and food insecurity: Floodwaters inundated over 700,000 hectares of cropland immediately before harvest, destroying staple crops such as maize. This led to acute food shortages affecting approximately 1.85 million people and long-term economic impacts on subsistence farmers. [2]
-
Damage to infrastructure: Flooding destroyed roads, bridges, and health facilities, isolating communities and hampering relief efforts. The port city of Beira sustained catastrophic damage, with 90% of the city reported destroyed, disrupting regional trade and aid delivery. [2]
-
Waterborne disease outbreaks: Stagnant floodwaters combined with damaged sanitation infrastructure led to cholera outbreaks, with over 4,000 cases reported. The contamination of water sources increased the risk of diarrhoeal diseases, particularly affecting children and vulnerable populations. [2]
Accept any two valid impacts with explanation. Award partial credit (1 mark) for identification without explanation.
Question 2: Climate Change Evidence and Responses
(a) Using Resource 2A, describe the relationship between CO₂ concentrations and global temperature anomaly from 1880 to 2020. Support your answer with data. [4]
Answer/Marking Notes:
Award up to 4 marks for describing the relationship with specific data support.
Expected response:
- There is a strong positive correlation between CO₂ concentrations and global temperature anomaly [1]
- As CO₂ increased from 290 ppm in 1880 to 414 ppm in 2020 (an increase of 124 ppm or 43%), the temperature anomaly rose from -0.16°C to +0.98°C [1]
- The relationship shows acceleration in the later period: between 1960 and 2020, CO₂ increased by 97 ppm and temperature rose by 1.01°C, indicating a more rapid warming trend in recent decades [1]
- The data suggests that rising atmospheric CO₂ concentrations are closely associated with global temperature increases, consistent with the greenhouse effect mechanism [1]
Accept any valid description with specific data reference. Award marks for identifying the positive correlation, providing comparative data, noting the acceleration, and linking to the greenhouse effect.
(b) With reference to Resource 2B, explain two pieces of evidence, other than rising temperatures, that indicate climate change is occurring. [6]
Answer/Marking Notes:
Award up to 3 marks for each piece of evidence (1 mark for identification, up to 2 marks for explanation with reference to Resource 2B). Maximum 6 marks.
Expected evidence (any two):
-
Ocean warming: Resource 2B states that "human influence has warmed the... ocean." Ocean heat content has increased significantly, with the upper 700m of the ocean absorbing more than 90% of excess heat since 1971. This warming causes thermal expansion, contributing to sea level rise, and affects marine ecosystems through coral bleaching and species migration. [3]
-
Cryosphere changes: Resource 2B refers to "widespread and rapid changes in the... cryosphere." This includes accelerating ice sheet mass loss in Greenland and Antarctica, retreat of mountain glaciers worldwide, and reductions in Arctic sea ice extent (declining at approximately 13% per decade since 1979). These changes provide visible evidence of a warming climate system. [3]
-
Biosphere changes: Resource 2B mentions changes in the "biosphere." This includes shifts in species distributions (poleward and upward migration), changes in phenology (earlier spring events such as flowering and bird migration), and alterations in ecosystem structure. These biological responses are consistent with climate warming trends. [3]
-
Sea level rise: While not explicitly stated in Resource 2B, the reference to "widespread and rapid changes" encompasses sea level rise. Global mean sea level has risen approximately 20 cm since 1900, with the rate accelerating to about 3.3 mm/year in recent decades, driven by thermal expansion and ice melt. [3]
Award marks for clear explanation linking the evidence to climate change mechanisms and referencing the IPCC extract.
(c) Evaluate the usefulness of Resource 2A and Resource 2B in helping to understand the causes of contemporary climate change. [8]
Answer/Marking Notes:
Award marks using the following level descriptors. Maximum 8 marks.
Level 4 (7–8 marks): Comprehensive evaluation of both resources, identifying specific strengths and limitations. Clear judgment on overall usefulness with balanced assessment. Explicit reference to resource content.
Level 3 (5–6 marks): Good evaluation of both resources with some strengths and limitations identified. May be slightly unbalanced or lack explicit judgment.
Level 2 (3–4 marks): Basic evaluation, mainly describing resource content rather than assessing usefulness. Limited identification of strengths and limitations.
Level 1 (1–2 marks): Descriptive response with minimal evaluation. May only reference one resource.
Expected content:
Resource 2A evaluation:
- Strengths: Provides quantitative, long-term data (140 years) showing the correlation between CO₂ and temperature; allows identification of temporal trends and acceleration; data is measurable and comparable across time periods; supports the greenhouse gas theory of climate change causation [2]
- Limitations: Correlation does not prove causation; does not account for other climate forcings (solar variability, volcanic activity, aerosols); data is aggregated globally, masking regional variations; does not explain the mechanism by which CO₂ causes warming; limited to two variables [2]
Resource 2B evaluation:
- Strengths: Authoritative source (IPCC) representing scientific consensus; provides qualitative attribution statement ("unequivocal that human influence has warmed"); references multiple climate system components (atmosphere, ocean, cryosphere, biosphere); places changes in long-term context ("unprecedented over many centuries to many thousands of years") [2]
- Limitations: Lacks specific quantitative data; does not detail the mechanisms of human influence (e.g., greenhouse gas emissions, land use change); is a summary statement without detailed evidence; does not differentiate between natural and anthropogenic forcings explicitly [2]
Overall judgment:
- Together, the resources are useful: Resource 2A provides empirical evidence of the CO₂-temperature relationship, while Resource 2B provides authoritative attribution to human influence [1]
- However, neither resource fully explains the causal mechanisms (greenhouse effect, radiative forcing) or addresses alternative explanations, limiting their standalone usefulness for understanding causes [1]
Question 3: Climate Change Mitigation Essay
"'Alternative energy sources hold the key for an effective response to climate change.' Evaluate the validity of this statement." [16]
Answer/Marking Notes:
Use the following level descriptors for the 16-mark essay.
Level 4 (13–16 marks):
- Comprehensive evaluation of the statement, presenting a balanced argument
- Excellent use of specific case studies and examples to support points
- Clear structure with introduction, developed paragraphs, and conclusion
- Demonstrates critical understanding of mitigation strategies
- Acknowledges limitations of alternative energy and considers complementary approaches
- Sophisticated geographical terminology and conceptual understanding
Level 3 (9–12 marks):
- Good evaluation with some balance between agreement and disagreement
- Relevant case studies and examples used, though may lack detail
- Clear structure with identifiable argument
- Understands both potential and limitations of alternative energy
- Appropriate geographical terminology
Level 2 (5–8 marks):
- Some evaluation but may be one-sided or descriptive
- Limited or generic examples
- Basic structure with some relevant points
- Partial understanding of mitigation strategies
- Some geographical terminology used
Level 1 (1–4 marks):
- Descriptive rather than evaluative
- Few or no examples
- Weak structure
- Limited understanding of climate change mitigation
- Basic terminology
Indicative content:
Arguments supporting the statement:
- Renewable energy (solar, wind, hydro, geothermal) directly reduces greenhouse gas emissions by displacing fossil fuel combustion
- Case study: Costa Rica generated 98% of its electricity from renewable sources in 2020, demonstrating feasibility of transition
- Case study: China's massive investment in solar and wind capacity (over 1,200 GW combined by 2023) shows scalability
- Technological improvements have dramatically reduced costs: solar PV costs fell 85% between 2010 and 2020
- Energy sector accounts for approximately 73% of global GHG emissions, so decarbonising energy has maximum impact
- Alternative energy enables other sectors (transport, industry) to decarbonise through electrification
Arguments challenging the statement:
- Alternative energy alone cannot address non-energy emissions (agriculture, deforestation, industrial processes)
- Intermittency challenges require energy storage solutions and grid modernisation, which are costly and technically complex
- Case study: Germany's Energiewende has faced challenges with grid stability and continued reliance on coal during transition
- Political and economic barriers: fossil fuel subsidies ($5.9 trillion in 2020 according to IMF), vested interests, and developing nations' need for affordable energy
- Resource requirements for renewable infrastructure (rare earth minerals, land use) create new environmental challenges
- Mitigation requires complementary strategies: energy efficiency, carbon pricing, reforestation, behavioural change
Synthesis and conclusion:
- Alternative energy is a necessary but not sufficient component of climate change response
- Effective mitigation requires a portfolio approach combining technological, policy, economic, and behavioural interventions
- The "key" metaphor is partially valid: alternative energy unlocks significant emission reductions, but multiple keys are needed
- Success depends on political will, international cooperation, and equitable transition pathways
Section B: Urban Change (50 marks)
Question 4: Slum Characteristics and Service Provision
(a) Explain the characteristics of Kibera as seen in Resource 4A. [5]
Answer/Marking Notes:
Award 1 mark for each valid characteristic identified and explained with reference to the photograph. Maximum 5 marks.
Expected characteristics:
-
High-density housing: The photograph shows structures built at very close proximity with minimal spacing between dwellings. This reflects the intense pressure on land in informal settlements where population density can exceed 50,000 people per km². [1]
-
Poor quality building materials: Structures are constructed from corrugated iron sheets and other temporary materials, indicating insecure tenure and limited investment in housing quality. These materials provide inadequate protection from weather extremes. [1]
-
Inadequate infrastructure: The absence of visible piped water infrastructure and presence of open drainage channels indicates limited formal service provision. Residents likely rely on informal water vendors or communal standpipes. [1]
-
Narrow, unpaved pathways: The photograph shows unpaved access routes between dwellings, which become impassable during heavy rain, limiting mobility and emergency service access. [1]
-
Overhead electricity wires: While some electricity access is visible (informal connections), the wiring appears haphazard, suggesting illegal or unsafe connections that pose fire and electrocution risks. [1]
Accept any five valid characteristics with explanation. Award partial credit (0.5 marks) for identification without explanation.
(b) Account for the changes in service provision that might occur as an informal settlement transitions from conditions similar to Kibera to conditions similar to Rocinha, as suggested by Resource 4B. [5]
Answer/Marking Notes:
Award marks for explaining the reasons behind service provision improvements. Maximum 5 marks.
Expected response:
-
Resource 4B shows that Rocinha (Rio de Janeiro) has significantly higher service access than Kibera (Nairobi): piped water (85% vs 20%), electricity (98% vs 45%), and improved sanitation (65% vs 15%) [1]
-
Government recognition and investment: Rocinha has benefited from Brazil's Favela-Bairro programme and PAC (Growth Acceleration Programme), which invested in formalising land tenure and extending municipal services. Government recognition enables legal service connections that informal status prevents. [1]
-
Length of settlement existence: Rocinha was established in the 1940s, allowing decades for incremental service improvements and community organisation. Older settlements often accumulate infrastructure through resident investment and political negotiation. [1]
-
Political incorporation: As favelas grew to house significant voting populations, political parties had incentives to extend services in exchange for electoral support. This political dynamic drives service improvements that purely informal settlements cannot access. [1]
-
Economic development context: Brazil's higher GDP per capita and stronger municipal capacity compared to Kenya enables greater public investment in slum upgrading. The transition reflects broader national development differences rather than settlement characteristics alone. [1]
Accept any valid explanations for the service provision differences. Award marks for linking specific data from Resource 4B to explanatory factors.
Question 5: Urban Liveability Investigation
(a) State a suitable hypothesis for this investigation. [2]
Answer/Marking Notes:
Award 2 marks for a clear, testable hypothesis that links the two sites to elderly liveability. Award 1 mark for a partially suitable hypothesis.
Example hypotheses (any one):
-
"Elderly liveability is higher at Site A (Tampines Central) than at Site B (Tampines North) due to greater accessibility to amenities and transport." [2]
-
"The availability of age-friendly infrastructure and services is greater at Tampines Central compared to Tampines North, resulting in higher perceived liveability among elderly residents." [2]
-
"Elderly residents at Tampines Central report higher satisfaction with neighbourhood liveability than those at Tampines North." [2]
The hypothesis must:
- Be testable using the proposed methods
- Compare the two sites
- Relate to elderly liveability
- Be clearly stated as a prediction
(b) Explain how the students could minimise the impact of their investigation differently at Site A and Site B. [4]
Answer/Marking Notes:
Award up to 2 marks for each site. Maximum 4 marks.
Site A (Tampines Central – high-traffic area):
- Conduct pedestrian counts from a fixed, unobtrusive position (e.g., seated at a bench or café) to avoid obstructing pedestrian flow in this busy transport hub [1]
- Schedule questionnaire surveys during off-peak hours (mid-morning or mid-afternoon) to minimise disruption to commuters and avoid the rush hour crush at the MRT/bus interchange [1]
- Obtain permission from mall management or relevant authorities before conducting surveys near commercial areas [1]
Site B (Tampines North – residential area):
- Approach elderly residents in common areas (void decks, community gardens, senior activity centres) rather than door-to-door to respect privacy in this quieter residential setting [1]
- Conduct surveys at times when elderly residents are typically outdoors (early morning exercise, late afternoon) to avoid disturbing them during rest periods [1]
- Ensure questionnaire administration does not create noise or gathering that might disturb residents in this lower-density area [1]
Award marks for site-specific considerations that demonstrate understanding of different contexts.
(c) Evaluate the usefulness of the proposed investigation in understanding the impacts of recent state-led efforts to improve urban liveability for the elderly in Singapore. [8]
Answer/Marking Notes:
Award marks using level descriptors. Maximum 8 marks.
Level 4 (7–8 marks): Comprehensive evaluation identifying specific strengths and limitations of the investigation design. Clear judgment on overall usefulness with reference to state-led efforts. Explicit links between methods and research aim.
Level 3 (5–6 marks): Good evaluation with some strengths and limitations identified. May lack explicit connection to state-led efforts or be slightly unbalanced.
Level 2 (3–4 marks): Basic evaluation, mainly describing methods rather than assessing usefulness. Limited identification of strengths and limitations.
Level 1 (1–2 marks): Descriptive response with minimal evaluation.
Expected content:
Strengths of the investigation:
- The two-site comparison (established central area vs. newer extension) enables assessment of whether recent development has achieved comparable liveability standards, directly addressing state-led planning efforts [1]
- Mixed methods (land use survey, questionnaire, pedestrian count) provide both objective infrastructure data and subjective resident perceptions, capturing multiple dimensions of liveability [1]
- Focus on elderly residents (15% of population) addresses a specific demographic targeted by Singapore's Age-Friendly City initiatives and the Action Plan for Successful Ageing [1]
- Temporal sampling (morning, afternoon, evening) captures variations in elderly activity patterns and accessibility throughout the day [1]
Limitations of the investigation:
- The investigation captures current conditions but cannot establish causation or attribute improvements specifically to state-led efforts without baseline data or longitudinal comparison [1]
- Sample size (50 per site) may not be representative of the elderly population, particularly if response rates vary by health status or mobility [1]
- The investigation does not include interviews with policymakers or analysis of planning documents, limiting understanding of the intentions and mechanisms behind state-led efforts [1]
- Confounding variables (length of residence, socio-economic status, health) may influence liveability perceptions independently of state interventions [1]
Overall judgment:
- The investigation provides useful insights into spatial variations in elderly liveability that may reflect the success of state-led planning, but its cross-sectional design limits causal attribution [1]
- To strengthen usefulness, the investigation could be supplemented with historical data on infrastructure provision, policy analysis, and interviews with urban planners [1]
Question 6: Slums and Sustainable Urban Development Essay
"'Slums are the greatest impediment confronting cities in achieving sustainable urban development.' How far do you agree with this statement?" [16]
Answer/Marking Notes:
Use level descriptors as for Question 3. Maximum 16 marks.
Indicative content:
Arguments supporting the statement:
- Slums concentrate multiple sustainability deficits: environmental (lack of sanitation, pollution), social (poverty, health risks, crime), and economic (informal employment, low productivity)
- Case study: Kibera (Nairobi) – 250,000 residents with 20% piped water access and 15% improved sanitation creates public health crises (cholera, typhoid) that strain city resources
- Slums occupy hazard-prone land (floodplains, steep slopes), increasing vulnerability to climate change and natural disasters
- Case study: Mumbai's slums – Dharavi's 700,000 residents on low-lying land face recurrent flooding that disrupts city-wide economic activity
- Informal settlements complicate urban planning, infrastructure provision, and tax collection, undermining municipal capacity
- The scale of slum populations (approximately 1 billion globally) makes sustainable development goals unattainable without addressing slum conditions
Arguments challenging the statement:
- Slums are symptoms of broader structural failures (inequitable development, inadequate housing policy, rural-urban migration) rather than the primary impediment
- Slums provide essential functions: affordable housing for low-income workers, entry points for rural-urban migrants, and informal economic opportunities
- Case study: Dharavi's recycling industry processes 80% of Mumbai's plastic waste, contributing to urban sustainability through circular economy functions
- Other impediments may be equally or more significant: carbon-intensive urban sprawl, private vehicle dependence, industrial pollution, consumption patterns of affluent residents
- Case study: Singapore's approach – eliminating slums through comprehensive public housing (HDB) demonstrates that slums are a solvable policy challenge rather than an inherent impediment
- Framing slums as the "greatest impediment" risks justifying clearance and displacement rather than upgrading and integration
Synthesis and conclusion:
- Slums present significant challenges to sustainable urban development across all three pillars (environmental, social, economic)
- However, they are more accurately understood as manifestations of unsustainable development patterns rather than the root impediment
- The greatest impediment may be the political and economic systems that produce and perpetuate inequality, of which slums are a visible symptom
- Sustainable urban development requires addressing structural causes (land markets, housing finance, inclusive planning) rather than focusing solely on slum conditions
- Balanced conclusion: "To a significant extent, slums impede sustainable urban development, but they are a consequence of deeper failures in urban governance and development models. Addressing these root causes is essential for meaningful progress."
END OF ANSWER KEY
Marking notes: Where multiple valid answers are possible, examiners should use professional judgment and reward any response that demonstrates appropriate geographical understanding and meets the assessment objectives.
Free quiz and exam paper access
Enter your details to view this paper
Your access is remembered on this device.