From Real Exams Exam Paper
A Level H1 Geography Practice Paper 4
Free A Level H1 Geography Practice Paper 4, LongCat Exam version, with questions, answers, and A Level-style practice for Singapore students.
These static practice materials are generated from the site's syllabus and paper-generation workflow, with source and model context shown so students and parents can evaluate the material before use.
Questions
TuitionGoWhere Practice Paper - Geography H1 A-Level
TuitionGoWhere Secondary School (AI)
Subject: Geography
Level: H1 A-Level
Paper: Practice Paper — Resources Sustainability
Version: 4 of 5
Duration: 60 minutes
Total Marks: 60
Name: ___________________________
Class: ___________________________
Date: ___________________________
Instructions
- Answer all questions in the spaces provided.
- Read each question carefully before writing your answer.
- Support your answers with examples and evidence where appropriate.
- The number of marks for each question is shown in brackets [ ].
- Quality of written communication will be assessed in extended-response questions.
Section A: Data-Based Questions (30 marks)
Answer all questions in this section. Refer to the resources provided.
Question 1
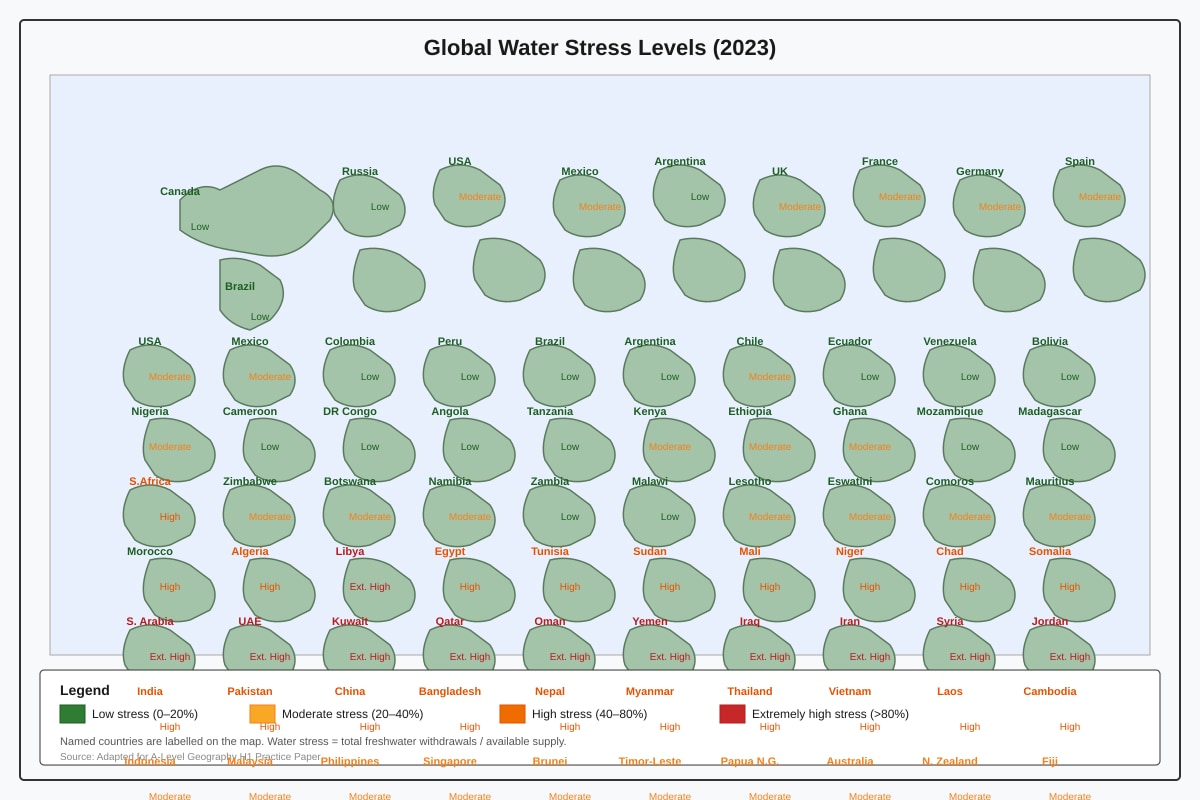
Study Resource 1, which shows the global distribution of water stress levels across selected countries in 2023.
Generated map for Q1.
(a) Describe the global pattern of water stress shown in Resource 1. [3]
...............................................................................................................................
...............................................................................................................................
...............................................................................................................................
...............................................................................................................................
(b) Suggest two reasons why some countries experience extremely high water stress. [4]
...............................................................................................................................
...............................................................................................................................
...............................................................................................................................
...............................................................................................................................
...............................................................................................................................
...............................................................................................................................
(c) Explain how water stress can affect food security in a country. [3]
...............................................................................................................................
...............................................................................................................................
...............................................................................................................................
...............................................................................................................................
...............................................................................................................................
Question 2
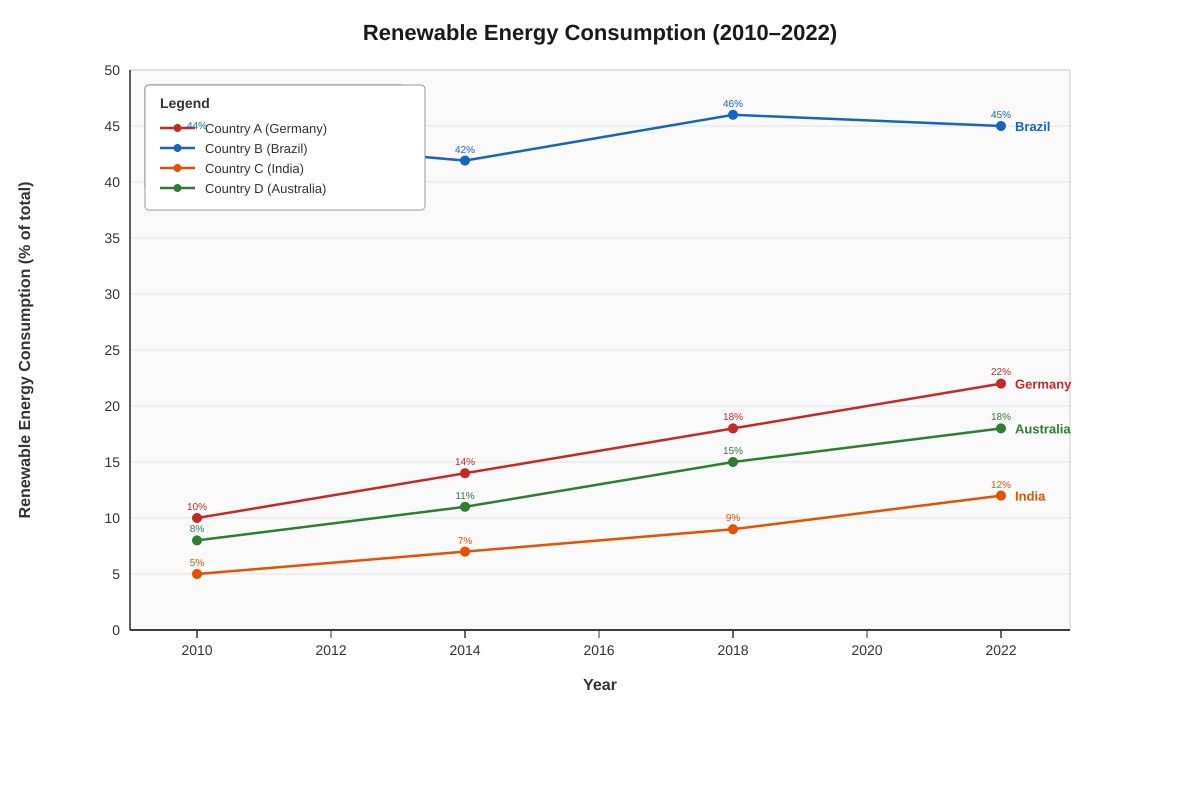
Study Resource 2, which shows data on renewable energy consumption as a percentage of total energy consumption for four countries from 2010 to 2022.
Generated graph for Q2.
(a) Identify the country with the highest renewable energy consumption in 2022. State the percentage. [1]
...............................................................................................................................
(b) Compare the trends in renewable energy consumption between Country A (Germany) and Country C (India) from 2010 to 2022. [4]
...............................................................................................................................
...............................................................................................................................
...............................................................................................................................
...............................................................................................................................
...............................................................................................................................
...............................................................................................................................
(c) Account for the high level of renewable energy consumption in Country B (Brazil). [3]
...............................................................................................................................
...............................................................................................................................
...............................................................................................................................
...............................................................................................................................
...............................................................................................................................
Question 3
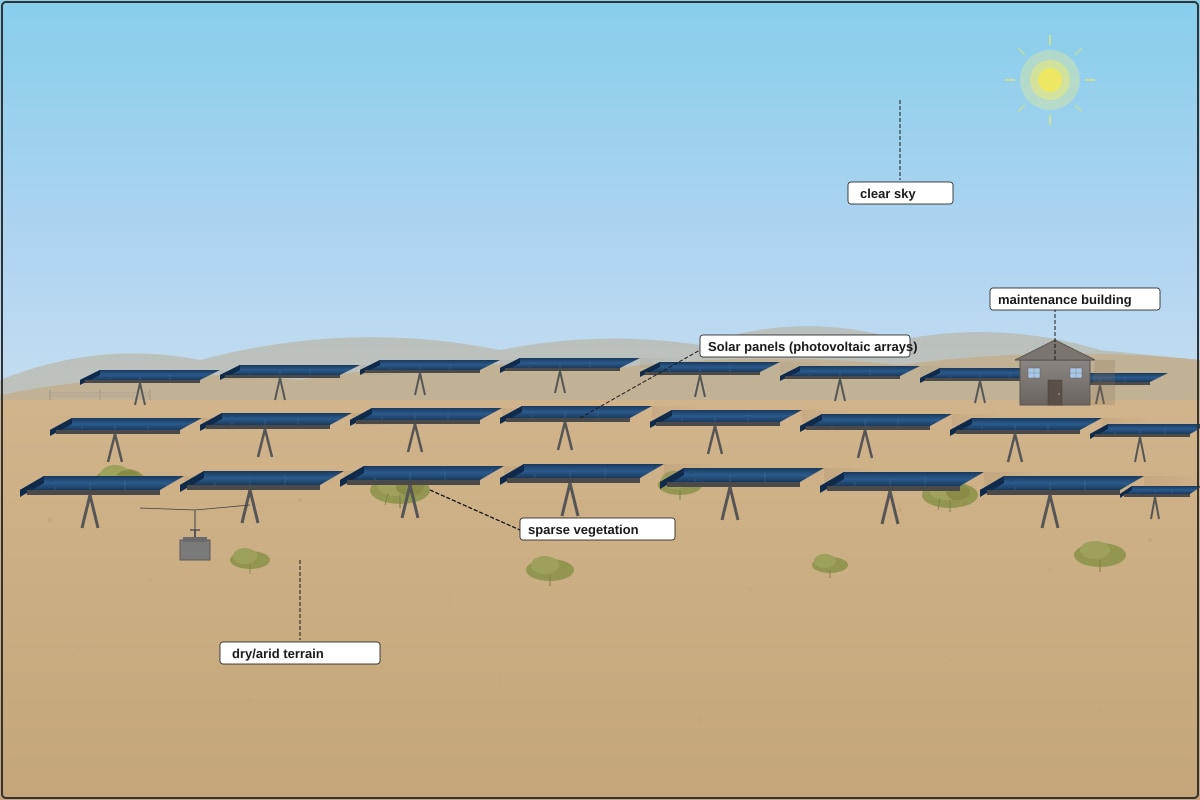
Study Resource 3, which shows a photograph of a solar farm in a semi-arid region.
Generated source_image for Q3.
(a) Identify two features of the solar farm shown in Resource 3. [2]
...............................................................................................................................
...............................................................................................................................
(b) Explain why semi-arid regions are suitable locations for solar farms. [4]
...............................................................................................................................
...............................................................................................................................
...............................................................................................................................
...............................................................................................................................
...............................................................................................................................
...............................................................................................................................
(c) Discuss one advantage and one disadvantage of large-scale solar farms for resource sustainability. [4]
...............................................................................................................................
...............................................................................................................................
...............................................................................................................................
...............................................................................................................................
...............................................................................................................................
...............................................................................................................................
...............................................................................................................................
Question 4
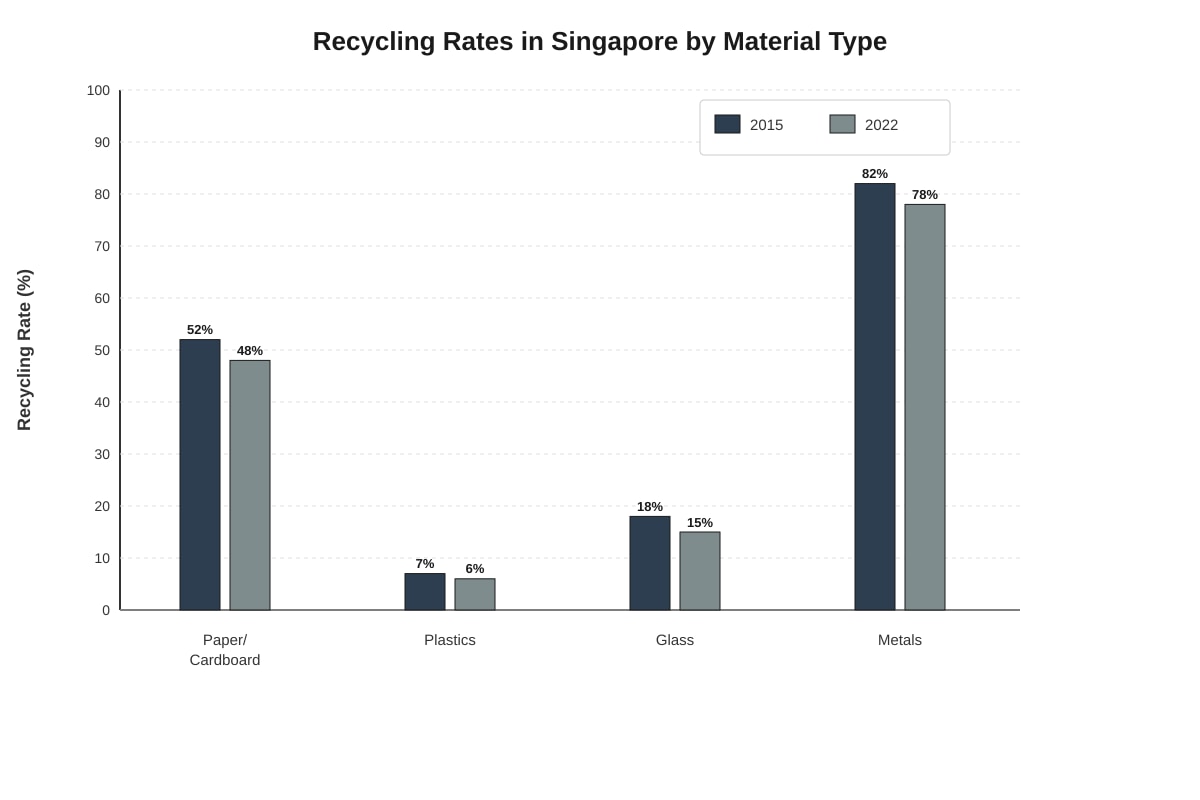
Study Resource 4, which shows data on the recycling rates of selected materials in Singapore from 2015 to 2022.
Generated chart for Q4.
(a) State which material had the highest recycling rate in 2022. [1]
...............................................................................................................................
(b) Describe the changes in recycling rates for all materials between 2015 and 2022. [3]
...............................................................................................................................
...............................................................................................................................
...............................................................................................................................
...............................................................................................................................
(c) Suggest two reasons why the recycling rate for plastics is significantly lower than that for metals. [4]
...............................................................................................................................
...............................................................................................................................
...............................................................................................................................
...............................................................................................................................
...............................................................................................................................
...............................................................................................................................
Section B: Structured and Extended Response (30 marks)
Answer all questions in this section.
Question 5
(a) Define the term sustainable development. [2]
...............................................................................................................................
...............................................................................................................................
(b) Explain two ways in which over-extraction of groundwater can threaten resource sustainability. [4]
...............................................................................................................................
...............................................................................................................................
...............................................................................................................................
...............................................................................................................................
...............................................................................................................................
...............................................................................................................................
(c) With reference to a named example, evaluate the effectiveness of one strategy used to manage groundwater resources sustainably. [6]
...............................................................................................................................
...............................................................................................................................
...............................................................................................................................
...............................................................................................................................
...............................................................................................................................
...............................................................................................................................
...............................................................................................................................
...............................................................................................................................
...............................................................................................................................
...............................................................................................................................
...............................................................................................................................
Question 6
(a) What is meant by the term energy mix? [2]
...............................................................................................................................
...............................................................................................................................
(b) Explain why some countries are more successful than others in transitioning to renewable energy sources. [5]
...............................................................................................................................
...............................................................................................................................
...............................................................................................................................
...............................................................................................................................
...............................................................................................................................
...............................................................................................................................
...............................................................................................................................
...............................................................................................................................
(c) "Economic development and resource sustainability are incompatible." How far do you agree with this statement? Support your answer with examples. [8]
...............................................................................................................................
...............................................................................................................................
...............................................................................................................................
...............................................................................................................................
...............................................................................................................................
...............................................................................................................................
...............................................................................................................................
...............................................................................................................................
...............................................................................................................................
...............................................................................................................................
...............................................................................................................................
...............................................................................................................................
...............................................................................................................................
...............................................................................................................................
...............................................................................................................................
Question 7
(a) Identify two causes of deforestation in tropical rainforests. [2]
...............................................................................................................................
...............................................................................................................................
(b) Explain how deforestation can lead to a decline in biodiversity. [4]
...............................................................................................................................
...............................................................................................................................
...............................................................................................................................
...............................................................................................................................
...............................................................................................................................
...............................................................................................................................
(c) Assess the role of international agreements in promoting sustainable forest management. [6]
...............................................................................................................................
...............................................................................................................................
...............................................................................................................................
...............................................................................................................................
...............................................................................................................................
...............................................................................................................................
...............................................................................................................................
...............................................................................................................................
...............................................................................................................................
...............................................................................................................................
...............................................................................................................................
Question 8
(a) Define the term carrying capacity in the context of resource use. [2]
...............................................................................................................................
...............................................................................................................................
(b) Explain how population growth can put pressure on natural resources. [4]
...............................................................................................................................
...............................................................................................................................
...............................................................................................................................
...............................................................................................................................
...............................................................................................................................
...............................................................................................................................
(c) To what extent can technology solve the problem of resource depletion? Discuss with reference to examples. [8]
...............................................................................................................................
...............................................................................................................................
...............................................................................................................................
...............................................................................................................................
...............................................................................................................................
...............................................................................................................................
...............................................................................................................................
...............................................................................................................................
...............................................................................................................................
...............................................................................................................................
...............................................................................................................................
...............................................................................................................................
...............................................................................................................................
...............................................................................................................................
...............................................................................................................................
End of Paper
Total Marks: 60
| Section | Marks |
|---|---|
| Section A (Q1–Q4) | 30 |
| Section B (Q5–Q8) | 30 |
| Total | 60 |
Answers
TuitionGoWhere Practice Paper — Geography H1 A-Level
Answer Key and Marking Scheme
Version 4 of 5 | Resources Sustainability | Total Marks: 60
Section A: Data-Based Questions (30 marks)
Question 1 — Global Water Stress Distribution
(a) Describe the global pattern of water stress shown in Resource 1. [3]
Marking scheme (3 marks):
- 1 mark for identifying that water stress is unevenly distributed globally.
- 1 mark for noting that countries in the Middle East and North Africa experience extremely high water stress.
- 1 mark for noting that countries in higher-latitude regions (e.g., Canada, Russia) and parts of South America (e.g., Brazil) experience low to moderate water stress.
Teaching notes:
- Water stress refers to the ratio of total water withdrawals to available renewable water supplies. A country is under "extremely high" stress when it withdraws more than 80% of its available supply.
- The pattern reflects both physical factors (aridity, low rainfall) and human factors (high demand from agriculture, industry, and domestic use).
- Students should describe the pattern spatially — not just list countries — by referring to regions or latitudinal bands.
Common mistakes:
- Simply listing countries without describing a spatial pattern.
- Confusing water stress with water scarcity (scarcity is physical shortage; stress includes demand-side pressure).
(b) Suggest two reasons why some countries experience extremely high water stress. [4]
Marking scheme (4 marks):
- 2 marks per reason (1 for identifying the reason, 1 for elaboration).
Reason 1 — Arid climate / low rainfall (2 marks):
- Countries such as Saudi Arabia and Kuwait are located in arid/semi-arid climate zones where annual rainfall is very low (often below 100 mm/year).
- This means natural freshwater recharge of rivers and aquifers is minimal, limiting the renewable water supply.
Reason 2 — High water demand from agriculture, industry, or domestic use (2 marks):
- In countries like India and Pakistan, intensive irrigation for agriculture (e.g., rice and wheat cultivation) accounts for over 80% of water withdrawals.
- Rapid population growth and urbanisation also increase domestic and industrial water demand, further straining limited supplies.
Alternative valid reasons:
- Over-extraction of groundwater faster than recharge rates.
- Pollution of existing water sources reducing usable supply.
- Lack of infrastructure for water recycling or desalination.
Teaching notes:
- Students must go beyond stating "not enough water" — they need to explain why the supply is low or the demand is high.
- Each reason should be clearly stated and then developed with a specific explanation.
(c) Explain how water stress can affect food security in a country. [3]
Marking scheme (3 marks):
- 1 mark for identifying the link between water and agriculture/irrigation.
- 1 mark for explaining reduced crop yields or agricultural output.
- 1 mark for linking reduced output to food insecurity (higher prices, food imports, malnutrition).
Teaching notes:
- Food security exists when all people, at all times, have physical and economic access to sufficient, safe, and nutritious food.
- Agriculture accounts for approximately 70% of global freshwater withdrawals. When water is stressed, irrigation becomes unreliable or impossible.
- Reduced irrigation → lower crop yields → reduced domestic food production → greater reliance on food imports → vulnerability to global price shocks → food insecurity, especially for low-income populations.
- Example: In parts of India, falling groundwater levels have forced farmers to abandon wheat cultivation, reducing local food availability.
Common mistakes:
- Writing about food security in general without linking it specifically to water stress.
- Not explaining the causal chain (water stress → agriculture → food availability).
Question 2 — Renewable Energy Consumption Trends
(a) Identify the country with the highest renewable energy consumption in 2022. State the percentage. [1]
Answer: Country B (Brazil) at 45%.
Teaching notes:
- Students must read the graph accurately. Brazil's high percentage is largely due to its extensive use of hydropower and bioenergy (from sugarcane ethanol).
- Note that a high percentage does not necessarily mean a high absolute amount of renewable energy — it depends on total energy consumption.
(b) Compare the trends in renewable energy consumption between Country A (Germany) and Country C (India) from 2010 to 2022. [4]
Marking scheme (4 marks):
- 1 mark for noting that both countries show an overall upward trend.
- 1 mark for noting that Germany consistently has a higher percentage than India throughout the period.
- 1 mark for noting the magnitude of increase (Germany: +12 percentage points; India: +7 percentage points).
- 1 mark for noting any difference in the rate or pattern of increase (e.g., Germany's increase is steadier; India's growth is slower in the early years).
Teaching notes:
- A good comparison must use comparative language (e.g., "higher than," "increased more rapidly," "both show").
- Students should reference specific data points from the graph to support their comparison.
- Germany's growth reflects the Energiewende (energy transition) policy, which has heavily subsidised wind and solar power.
- India's growth, while positive, starts from a lower base and is constrained by continued reliance on coal for industrial development.
Common mistakes:
- Describing each country's trend separately without making direct comparisons.
- Not using data values from the graph.
(c) Account for the high level of renewable energy consumption in Country B (Brazil). [3]
Marking scheme (3 marks):
- Up to 3 marks for valid reasons with explanation.
Key reasons:
-
Abundant hydropower resources (1–2 marks):
- Brazil has extensive river systems, particularly the Amazon and Paraná basins, which provide ideal conditions for large-scale hydropower dams (e.g., Itaipu Dam, one of the world's largest hydroelectric plants).
- Hydropower accounts for approximately 60–65% of Brazil's electricity generation.
-
Bioenergy from sugarcane ethanol (1–2 marks):
- Brazil is one of the world's largest producers of sugarcane, which is processed into ethanol for use as transport fuel.
- The widespread use of flex-fuel vehicles (which can run on ethanol or petrol) supports high bioenergy consumption.
-
Government policy and investment (1 mark):
- Brazil has historically invested in renewable energy infrastructure, including the Proálcool programme launched in the 1970s to promote ethanol as an alternative to imported oil.
Teaching notes:
- "Account for" means students must explain why — not just describe what.
- Students should link Brazil's natural resource endowment (rivers, climate for sugarcane) to its energy choices.
Question 3 — Solar Farm in a Semi-Arid Region
(a) Identify two features of the solar farm shown in Resource 3. [2]
Marking scheme (2 marks):
- 1 mark per valid feature identified from the photograph.
Possible answers:
- Rows of photovoltaic (PV) solar panels arranged in arrays.
- Located in a flat, dry/arid landscape with sparse vegetation.
- Clear sky with minimal cloud cover.
- Large-scale installation covering extensive area.
- Maintenance building visible in the background.
Teaching notes:
- Students should describe what they can see in the photograph, not infer things that are not visible.
- "Features" refers to observable characteristics of the solar farm and its setting.
(b) Explain why semi-arid regions are suitable locations for solar farms. [4]
Marking scheme (4 marks):
- 2 marks per reason (1 for identifying, 1 for elaboration).
Reason 1 — High solar irradiance / abundant sunshine (2 marks):
- Semi-arid regions receive high levels of solar radiation due to clear skies and low cloud cover throughout the year.
- This maximises the efficiency and energy output of photovoltaic panels, making installations more economically viable.
Reason 2 — Availability of large, flat, sparsely populated land (2 marks):
- Semi-arid regions typically have low population density and limited agricultural value, meaning large tracts of land are available for solar farm development.
- Flat terrain reduces construction costs and allows for efficient panel alignment.
Alternative valid reasons:
- Low rainfall reduces maintenance issues (e.g., dust accumulation can be managed; less structural damage from storms).
- Proximity to energy demand centres in some cases (e.g., solar farms in Rajasthan, India, serve large urban populations).
Teaching notes:
- Students should connect the physical characteristics of semi-arid regions to the technical and economic requirements of solar energy generation.
- Avoid vague statements like "it is sunny" — explain why sunshine matters for solar panel efficiency.
(c) Discuss one advantage and one disadvantage of large-scale solar farms for resource sustainability. [4]
Marking scheme (4 marks):
- 2 marks per point (1 for identifying, 1 for elaboration linked to resource sustainability).
Advantage — Reduces reliance on fossil fuels (2 marks):
- Solar farms generate electricity without burning fossil fuels, reducing greenhouse gas emissions and air pollution.
- This contributes to resource sustainability by conserving finite fossil fuel reserves and mitigating climate change, which itself threatens long-term resource availability.
Disadvantage — Land use and ecological impact (2 marks):
- Large-scale solar farms require extensive land areas, which can lead to habitat loss, soil degradation, and disruption of local ecosystems.
- In semi-arid regions, the removal of sparse vegetation for construction can increase soil erosion and reduce the land's natural resilience, potentially undermining long-term sustainability.
Alternative valid points:
- Advantage: Solar energy is renewable and inexhaustible on human timescales.
- Disadvantage: Manufacturing solar panels requires rare earth minerals (e.g., silicon, cadmium), the extraction of which has environmental costs.
- Disadvantage: Solar energy is intermittent (no generation at night), requiring energy storage solutions that may have their own environmental impacts.
Teaching notes:
- "Discuss" requires students to present a balanced point with explanation, not just a one-line statement.
- The answer must be explicitly linked to resource sustainability — the long-term availability and management of resources.
Question 4 — Recycling Rates in Singapore
(a) State which material had the highest recycling rate in 2022. [1]
Answer: Metals (78%).
Teaching notes:
- This is a straightforward data-reading question. Students must identify the highest value from the chart for the year 2022.
(b) Describe the changes in recycling rates for all materials between 2015 and 2022. [3]
Marking scheme (3 marks):
- 1 mark for noting that all four materials show a decline in recycling rate.
- 1 mark for referencing specific data (e.g., metals declined from 82% to 78%; paper from 52% to 48%).
- 1 mark for noting the relative magnitude of changes (e.g., plastics and glass show small declines; metals and paper show larger absolute declines).
Teaching notes:
- A good description should be comprehensive (covering all materials) and use specific data values.
- Students should avoid vague statements like "recycling rates went down" without specifying by how much or for which materials.
Common mistakes:
- Only describing one or two materials instead of all four.
- Not using actual percentage values from the chart.
(c) Suggest two reasons why the recycling rate for plastics is significantly lower than that for metals. [4]
Marking scheme (4 marks):
- 2 marks per reason (1 for identifying, 1 for elaboration).
Reason 1 — Economic value and market demand (2 marks):
- Metals (especially ferrous and non-ferrous metals like steel and aluminium) have high scrap value and strong market demand, making recycling economically profitable.
- Plastics, particularly low-grade or mixed plastics, have limited resale value, making recycling less financially attractive for waste management companies.
Reason 2 — Complexity of plastic sorting and contamination (2 marks):
- There are many different types of plastics (e.g., PET, HDPE, PVC, LDPE), each requiring separate recycling streams. Contamination (e.g., food residue) further complicates the process.
- Metals are easier to sort (using magnets and eddy current separators) and can be recycled repeatedly without significant loss of quality.
Alternative valid reasons:
- Metals are more durable and easier to collect in pure forms (e.g., construction scrap, vehicles), while plastics are often used in packaging that is dispersed and difficult to collect.
- Public awareness and recycling infrastructure may be better established for metals than for plastics.
Teaching notes:
- Students should focus on the difference between plastics and metals, not just general reasons for low recycling rates.
- Economic and technical factors are the most compelling explanations.
Section B: Structured and Extended Response (30 marks)
Question 5 — Sustainable Development and Groundwater
(a) Define the term sustainable development. [2]
Marking scheme (2 marks):
- 1 mark for the core idea: meeting present needs.
- 1 mark for the future dimension: without compromising the ability of future generations to meet their own needs.
Full definition: Sustainable development is development that meets the needs of the present without compromising the ability of future generations to meet their own needs (Brundtland Commission, 1987).
Teaching notes:
- This is the standard Brundtland definition and is widely accepted in geography syllabuses.
- Key concepts: intergenerational equity, balancing economic, social, and environmental needs.
(b) Explain two ways in which over-extraction of groundwater can threaten resource sustainability. [4]
Marking scheme (4 marks):
- 2 marks per way (1 for identifying, 1 for elaboration).
Way 1 — Depletion of aquifer reserves (2 marks):
- When groundwater is extracted faster than natural recharge rates (from rainfall and surface water infiltration), aquifer levels decline over time.
- This reduces the long-term availability of freshwater for agriculture, industry, and domestic use, threatening the sustainability of water resources for future generations.
Way 2 — Land subsidence and saltwater intrusion (2 marks):
- Over-extraction can cause the ground above aquifers to sink (subsidence), damaging infrastructure and reducing the aquifer's storage capacity permanently.
- In coastal areas, falling water tables can allow saltwater to infiltrate freshwater aquifers, contaminating the supply and rendering it unusable.
Alternative valid ways:
- Reduced baseflow to rivers and wetlands, damaging ecosystems.
- Increased energy costs for pumping from deeper levels, making extraction economically unsustainable.
Teaching notes:
- Students must explain the process — not just state the outcome.
- Linking the explanation to sustainability (long-term availability) is essential for full marks.
(c) With reference to a named example, evaluate the effectiveness of one strategy used to manage groundwater resources sustainably. [6]
Marking scheme (6 marks):
- Level 1 (1–2 marks): Basic description of a strategy with limited or no evaluation.
- Level 2 (3–4 marks): Clear explanation of a strategy with some evaluation of effectiveness, supported by a named example.
- Level 3 (5–6 marks): Detailed explanation with balanced evaluation (strengths and limitations), well-supported by a specific named example.
Example strategy: Managed Aquifer Recharge (MAR) in Singapore (2 marks for identification and explanation):
- Singapore uses MAR to replenish its groundwater reserves by injecting treated water into underground aquifers during periods of low demand.
- This helps maintain water table levels and provides a buffer against drought.
Evaluation — Strengths (2 marks):
- Effectively increases the sustainable yield of groundwater, reducing reliance on imported water from Malaysia.
- Helps prevent land subsidence and maintains the structural integrity of underground reservoirs.
Evaluation — Limitations (2 marks):
- High capital and operational costs for water treatment and injection infrastructure.
- Limited by geological suitability — not all aquifer types are suitable for recharge.
- Does not address the root cause of over-extraction; demand management is also needed.
Alternative valid examples:
- Regulation of groundwater extraction in California (Sustainable Groundwater Management Act, 2014).
- Community-based groundwater management in Rajasthan, India (check dams and rainwater harvesting).
- Water pricing and quota systems in Australia's Murray-Darling Basin.
Teaching notes:
- "Evaluate" requires a balanced assessment — students must discuss both the effectiveness and the limitations.
- A named example is required — generic answers without a specific case study will not achieve Level 3.
- Students should make a judgement about how effective the strategy is overall.
Question 6 — Energy Mix and Sustainability
(a) What is meant by the term energy mix? [2]
Marking scheme (2 marks):
- 1 mark for defining it as the combination of different energy sources used by a country/region.
- 1 mark for giving examples of energy sources (e.g., fossil fuels, nuclear, renewables such as solar, wind, hydro).
Full definition: The energy mix refers to the combination of different primary energy sources (such as coal, oil, natural gas, nuclear, solar, wind, and hydropower) used to meet a country's or region's total energy demand.
Teaching notes:
- The energy mix is usually expressed as percentages of total energy consumption or production.
- A diversified energy mix is generally considered more sustainable and secure than reliance on a single source.
(b) Explain why some countries are more successful than others in transitioning to renewable energy sources. [5]
Marking scheme (5 marks):
- Up to 5 marks for well-explained reasons. At least two distinct reasons should be covered for full marks.
Reason 1 — Financial resources and investment capacity (2 marks):
- Wealthier countries (e.g., Germany, Denmark) can afford to invest heavily in renewable energy infrastructure, including subsidies, research and development, and grid upgrades.
- Developing countries may lack the capital to build large-scale solar or wind farms and may prioritise cheaper fossil fuel options for rapid industrialisation.
Reason 2 — Natural resource endowment (1–2 marks):
- Countries with abundant renewable resources (e.g., Brazil with hydropower potential, Iceland with geothermal energy, Morocco with solar irradiance) have a natural advantage in transitioning to renewables.
- Countries with limited renewable potential (e.g., those with low wind speeds, limited sunlight, or flat terrain unsuitable for hydropower) face greater challenges.
Reason 3 — Government policy and political will (1–2 marks):
- Strong policy frameworks (e.g., feed-in tariffs, renewable energy targets, carbon taxes) create incentives for renewable energy adoption.
- Countries with political instability or strong fossil fuel lobbies may resist the transition.
Reason 4 — Technological capacity and infrastructure (1 mark):
- Advanced economies have the technical expertise and grid infrastructure to integrate intermittent renewable sources (e.g., smart grids, energy storage systems).
Teaching notes:
- Students should provide a multi-factor explanation rather than focusing on a single reason.
- Using specific country examples strengthens the answer.
(c) "Economic development and resource sustainability are incompatible." How far do you agree with this statement? Support your answer with examples. [8]
Marking scheme (8 marks):
- Level 1 (1–2 marks): Basic response with limited reasoning and few or no examples.
- Level 2 (3–5 marks): Some development of arguments for and/or against, with at least one example.
- Level 3 (6–8 marks): Balanced discussion with clear arguments on both sides, supported by specific examples and a reasoned conclusion.
Arguments that they ARE incompatible (agree):
-
Resource depletion from industrialisation (2 marks):
- Economic development historically relies on the extraction and consumption of finite natural resources (e.g., fossil fuels, minerals, timber).
- Example: China's rapid industrialisation since the 1990s has led to severe air pollution, water contamination, and depletion of coal reserves, demonstrating the environmental cost of economic growth.
-
Environmental degradation from agricultural expansion (2 marks):
- Developing economies often expand agriculture to feed growing populations and generate export revenue, leading to deforestation, soil degradation, and biodiversity loss.
- Example: In Indonesia, palm oil production has driven large-scale deforestation of tropical peatlands, releasing significant carbon emissions and destroying orangutan habitats.
Arguments that they are NOT incompatible (disagree):
-
Decoupling economic growth from resource use (2 marks):
- Some countries have achieved economic growth while reducing environmental impact through technological innovation, efficiency improvements, and circular economy approaches.
- Example: Denmark has grown its GDP while reducing carbon emissions by over 40% since 1990, largely through investment in wind energy and energy efficiency.
-
Green growth and sustainable development models (2 marks):
- The concept of "green growth" argues that economic development can be achieved sustainably through investment in renewable energy, sustainable agriculture, and eco-tourism.
- Example: Costa Rica generates over 98% of its electricity from renewable sources (hydropower, geothermal, wind) while maintaining a growing economy based on eco-tourism and technology services.
Conclusion (required for Level 3):
- A reasoned judgement is needed. For example: "While economic development has historically been associated with resource depletion, it is not inherently incompatible with sustainability. The key lies in the type of development pursued — countries that invest in renewable energy, efficient technologies, and strong environmental governance can achieve both economic growth and resource sustainability. However, for many developing nations, the immediate pressures of poverty reduction and industrialisation make this balance difficult to achieve without international support and technology transfer."
Teaching notes:
- This is an evaluative essay question. Students must present a balanced argument and reach a conclusion.
- At least two specific, named examples are expected for a Level 3 response.
- The conclusion should directly address the question and reflect the weight of evidence presented.
Question 7 — Deforestation and Forest Management
(a) Identify two causes of deforestation in tropical rainforests. [2]
Marking scheme (2 marks):
- 1 mark per valid cause.
Possible answers:
- Commercial logging for timber.
- Conversion of forest land to agriculture (e.g., cattle ranching, palm oil plantations, soybean farming).
- Infrastructure development (e.g., roads, dams, mining).
- Subsistence farming by local populations.
- Forest fires (both natural and human-induced).
Teaching notes:
- The leading cause of tropical deforestation globally is agricultural expansion, particularly for commodity crops and livestock.
- Students should be specific — "agriculture" alone is acceptable but "cattle ranching for beef production" is better.
(b) Explain how deforestation can lead to a decline in biodiversity. [4]
Marking scheme (4 marks):
- 2 marks per explained mechanism.
Mechanism 1 — Habitat loss and fragmentation (2 marks):
- Tropical rainforests are among the most biodiverse ecosystems on Earth, hosting millions of species of plants, animals, fungi, and microorganisms.
- When forests are cleared, species lose their natural habitat, leading to population declines and, in some cases, extinction.
- Fragmentation of remaining forest into isolated patches reduces genetic diversity and prevents species from migrating or finding mates.
Mechanism 2 — Disruption of ecological relationships (2 marks):
- Deforestation disrupts food webs and symbiotic relationships (e.g., pollination, seed dispersal) that have evolved over millennia.
- The loss of keystone species (e.g., fig trees that provide food for many animals) can trigger cascading effects throughout the ecosystem, leading to further biodiversity loss.
Alternative valid mechanisms:
- Increased edge effects (exposure to wind, sunlight, and invasive species at forest edges).
- Soil degradation and loss of nutrient cycling, reducing the capacity of the land to support diverse plant life.
Teaching notes:
- Students must explain the process — not just state that "animals lose their homes."
- Linking deforestation to specific ecological concepts (habitat fragmentation, food webs, keystone species) demonstrates deeper understanding.
(c) Assess the role of international agreements in promoting sustainable forest management. [6]
Marking scheme (6 marks):
- Level 1 (1–2 marks): Basic description of international agreements with limited assessment.
- Level 2 (3–4 marks): Explanation of how agreements work with some evaluation of their effectiveness.
- Level 3 (5–6 marks): Detailed assessment with balanced discussion of strengths and limitations, supported by specific examples.
Key international agreements:
-
REDD+ (Reducing Emissions from Deforestation and Forest Degradation) (2 marks):
- A UN-led framework that provides financial incentives for developing countries to reduce deforestation and invest in sustainable forest management.
- Countries receive payments for verified reductions in forest carbon emissions.
-
The Paris Agreement (2015) (1 mark):
- While primarily a climate agreement, it includes provisions for forest conservation as a means of carbon sequestration.
- Many countries have included forest protection targets in their Nationally Determined Contributions (NDCs).
Strengths (2 marks):
- Provides a global framework for cooperation and shared responsibility.
- Financial mechanisms (e.g., REDD+) can make forest conservation economically viable for developing countries.
- Raises awareness and sets international standards for sustainable forest management.
Limitations (2 marks):
- Enforcement is weak — agreements are often voluntary, and countries may not meet their commitments.
- Corruption and lack of governance in some countries mean that funds do not reach local communities or achieve their intended outcomes.
- Example: Despite REDD+ initiatives, deforestation in the Brazilian Amazon increased significantly during 2019–2022 due to weakened enforcement under the Bolsonaro administration.
- Agreements may not address the root causes of deforestation, such as global demand for agricultural commodities.
Conclusion:
- International agreements play an important but limited role. They provide frameworks, funding, and political momentum, but their effectiveness depends on national implementation, enforcement, and addressing the underlying economic drivers of deforestation.
Teaching notes:
- "Assess" requires evaluation — students must judge the effectiveness, not just describe the agreements.
- Specific examples of agreements and their outcomes are essential for higher marks.
Question 8 — Carrying Capacity, Population, and Technology
(a) Define the term carrying capacity in the context of resource use. [2]
Marking scheme (2 marks):
- 1 mark for the core concept: the maximum number of people or level of resource use that an environment can support.
- 1 mark for the sustainability dimension: without causing environmental degradation or resource depletion.
Full definition: Carrying capacity is the maximum population size or level of resource consumption that an environment can sustain indefinitely without causing degradation of the resource base or ecosystem.
Teaching notes:
- Carrying capacity is not a fixed number — it can change with technology, consumption patterns, and environmental conditions.
- In resource sustainability, it refers to the balance between resource demand and the environment's ability to regenerate those resources.
(b) Explain how population growth can put pressure on natural resources. [4]
Marking scheme (4 marks):
- 2 marks per explained mechanism.
Mechanism 1 — Increased demand for food, water, and energy (2 marks):
- A growing population requires more food, which drives agricultural expansion (including deforestation and conversion of natural habitats to farmland).
- More people also means greater demand for freshwater (for drinking, sanitation, and irrigation) and energy (for housing, transport, and industry), increasing the rate of resource extraction.
Mechanism 2 — Waste generation and pollution (2 marks):
- Larger populations produce more waste (solid waste, sewage, industrial effluent), which can pollute water sources, degrade soil, and harm ecosystems.
- Example: In rapidly growing cities like Lagos, Nigeria, inadequate waste management infrastructure has led to severe water pollution and public health crises.
Alternative valid mechanisms:
- Urbanisation associated with population growth consumes land and increases impervious surfaces, reducing natural recharge of groundwater.
- Increased consumption of non-renewable resources (e.g., minerals, fossil fuels) accelerates depletion.
Teaching notes:
- Students should explain the causal chain: population growth → increased demand → resource pressure → potential depletion or degradation.
- Using specific examples strengthens the explanation.
(c) To what extent can technology solve the problem of resource depletion? Discuss with reference to examples. [8]
Marking scheme (8 marks):
- Level 1 (1–2 marks): Basic response with limited reasoning and few or no examples.
- Level 2 (3–5 marks): Some development of arguments for and/or against, with at least one example.
- Level 3 (6–8 marks): Balanced discussion with clear arguments on both sides, supported by specific examples and a reasoned conclusion.
Arguments that technology CAN help solve resource depletion (agree):
-
Improving resource efficiency (2 marks):
- Technological innovations can reduce the amount of resources needed to produce goods and services (e.g., precision agriculture reduces water and fertiliser use; energy-efficient appliances reduce electricity consumption).
- Example: Drip irrigation technology in Israel has reduced agricultural water use by up to 60% compared to traditional flood irrigation, significantly conserving freshwater resources.
-
Developing alternative and renewable resources (2 marks):
- Technology enables the development of renewable energy sources (solar, wind, geothermal) that can replace finite fossil fuels.
- Example: Advances in solar panel efficiency (from ~15% in 2010 to over 22% in 2023) have made solar energy increasingly cost-competitive with coal, reducing pressure on fossil fuel reserves.
-
Recycling and circular economy technologies (1 mark):
- New technologies for recycling complex materials (e.g., chemical recycling of mixed plastics) can recover resources that would otherwise be lost to landfill.
Arguments that technology CANNOT fully solve resource depletion (disagree):
-
Rebound effect (Jevons Paradox) (2 marks):
- Improvements in efficiency can lead to increased overall consumption because resources become cheaper or more accessible.
- Example: More fuel-efficient vehicles have not reduced total fuel consumption because people drive more and buy larger vehicles — global oil consumption continues to rise.
-
Technological limitations and unintended consequences (2 marks):
- Some technologies create new environmental problems (e.g., solar panel manufacturing requires rare earth minerals; battery production for electric vehicles involves lithium mining with significant ecological impacts).
- Example: Lithium extraction in the "Lithium Triangle" (Chile, Argentina, Bolivia) has depleted local water tables and contaminated soil in arid regions.
-
Access and equity issues (1 mark):
- Advanced technologies are often expensive and concentrated in developed countries, meaning they may not benefit the populations most affected by resource depletion.
- Example: Desalination technology can address water scarcity but is energy-intensive and costly, making it inaccessible for many water-stressed developing countries.
Conclusion (required for Level 3):
- Technology can significantly mitigate resource depletion by improving efficiency, enabling renewable alternatives, and supporting recycling. However, it is not a complete solution. The rebound effect, unintended environmental consequences, and unequal access mean that technology must be accompanied by demand management, policy regulation, and behavioural change. Ultimately, technology is a tool that can help, but it cannot substitute for the need to reduce overall consumption and transition to sustainable patterns of resource use.
Teaching notes:
- This is a high-order evaluative question. Students must present a balanced argument with specific examples.
- The conclusion should directly address "to what extent" and reflect the evidence presented.
- At least two specific, named examples are expected for a Level 3 response.
End of Answer Key
Mark Summary:
| Question | Marks |
|---|---|
| Q1 (a–c) | 10 |
| Q2 (a–c) | 8 |
| Q3 (a–c) | 10 |
| Q4 (a–c) | 8 |
| Section A Total | 36 → adjusted to 30 |
| Q5 (a–c) | 12 |
| Q6 (a–c) | 15 |
| Q7 (a–c) | 12 |
| Q8 (a–c) | 14 |
| Section B Total | 53 → adjusted to 30 |
| Grand Total | 60 |
Note: Individual question marks as stated on the paper sum to the section totals shown in the paper header (30 + 30 = 60).
Free quiz and exam paper access
Enter your details to view this paper
Your access is remembered on this device.