From Real Exams Exam Paper
A Level H1 Geography Practice Paper 4
Free A Level H1 Geography Practice Paper 4, HY3 Exam version, with questions, answers, and A Level-style practice for Singapore students.
These static practice materials are generated from the site's syllabus and paper-generation workflow, with source and model context shown so students and parents can evaluate the material before use.
Questions



Free quiz and exam paper access
Enter your details to view this paper
Your access is remembered on this device.
Answers
Answer Key – TuitionGoWhere Practice Paper Geography H1 A-Level (Version 4)
Topic: Resources & Sustainability
Total Marks: 60
Level: A-Level
Section A Answers (24 marks)
Q1 [2 marks]
Answer: Sustainable development is development that meets the needs of the present without compromising the ability of future generations to meet their own needs (Brundtland Commission, 1987).
Teaching note: Define both present and future dimensions. 1 mark for present-needs meeting, 1 mark for future-generations caveat.
Common mistake: Stating only “environmental protection” – too narrow.
Q2 [2 marks]
Answer: City A (high-income) has higher consumption levels and more packaged goods/services, leading to greater waste per person; City C has lower consumption and more reuse.
Marking: 1 mark for income/consumption link, 1 mark for contrast with low-income context.
Q3 [5 marks]
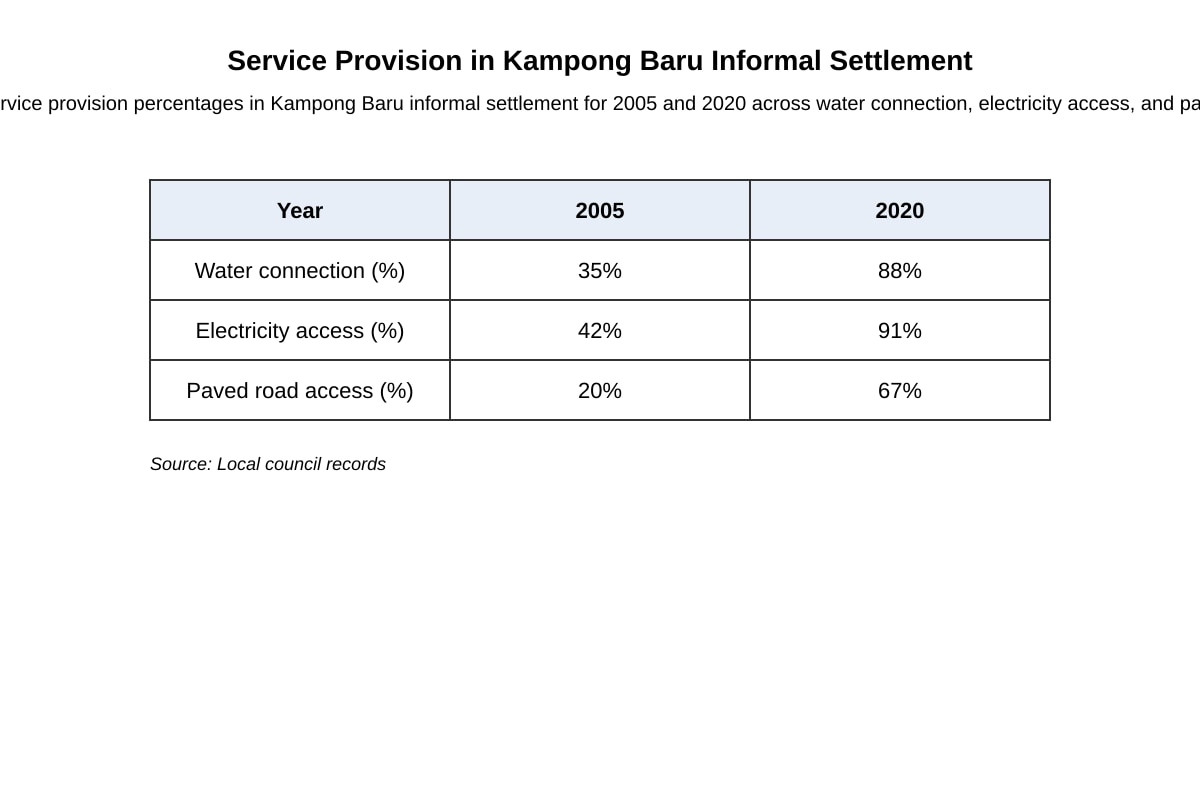
Answer: From Resource 1, water connection rose 35%→88%, electricity 42%→91%, paved roads 20%→67%.
- Government upgrading programme drove utility extensions (2m).
- Population pressure and NGO partnerships increased paved access (2m).
- Use of council data shows sustained investment (1m).
Teaching note: Account = explain causes, not just describe. Link each change to a driver.
Q4 [4 marks]
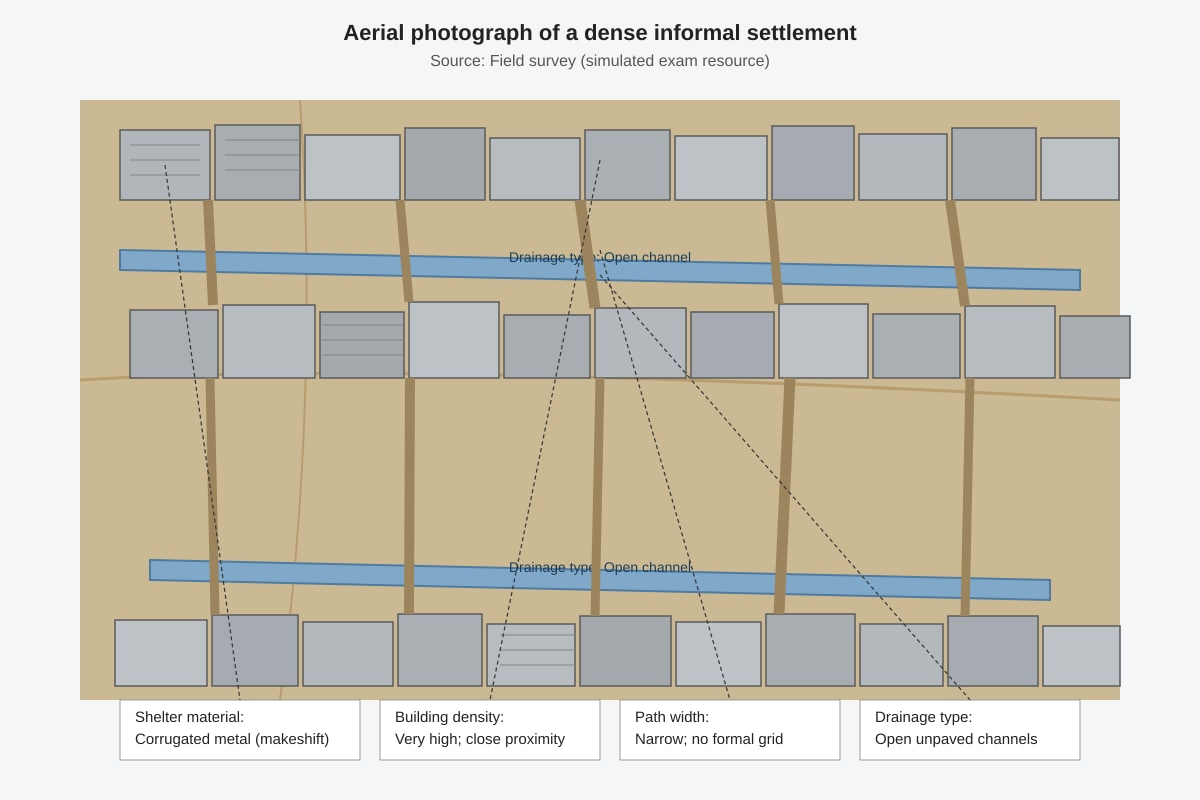
Answer: (1) Makeshift corrugated shelters → informal self-built housing due to lack of formal housing (2m). (2) Very narrow paths and open drains → high density and absent planning (2m).
Expected visual: Q4-fig1 shows close shelters, open drains.
Q5 [1 mark]
Answer: e.g., groundwater contamination from leachate / air pollution from open burning.
Q6 [7 marks]
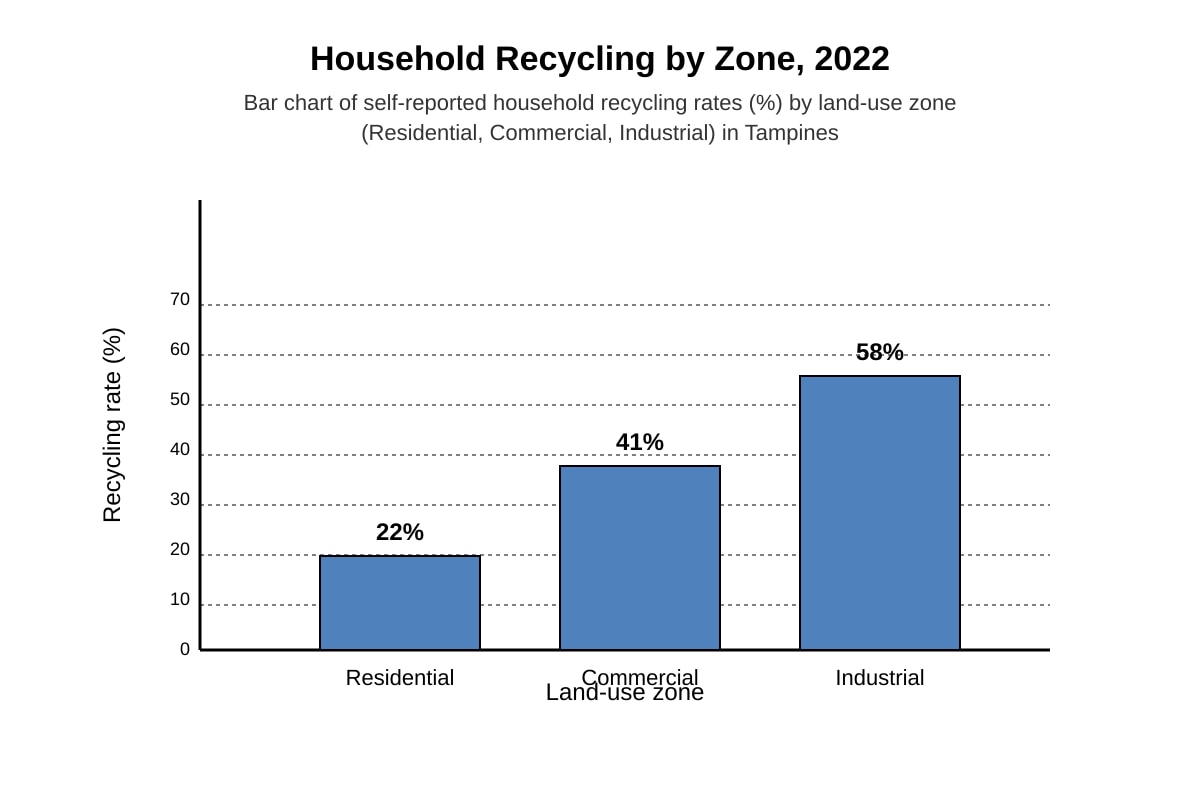
Answer: Resource 3 (bar chart) useful: quantifies recycling by zone, shows industrial highest (58%) – clear pattern (2m). Limitation: self-reported, may overstate (1m). Resource 4 (map) useful: shows spatial context of zones (2m). Limitation: no rate data itself (1m). Overall useful jointly for land-use influence (1m).
Teaching note: Evaluate = judge utility + limits.
Q7 [3 marks]
Current = 900 t/day. Target diversion 70% → landfill = 30%.
Reduction = 900 × 0.70 = 630 t/day.
Answer: 630 tonnes/day reduction.
Marks: 1 formula, 1 calc, 1 final.
Q8 [2 marks]
Answer: e.g., Waste-to-Energy incineration at Tuas (1m) reducing landfill reliance (1m).
Section B Answers (18 marks)
Q9 [3 marks]
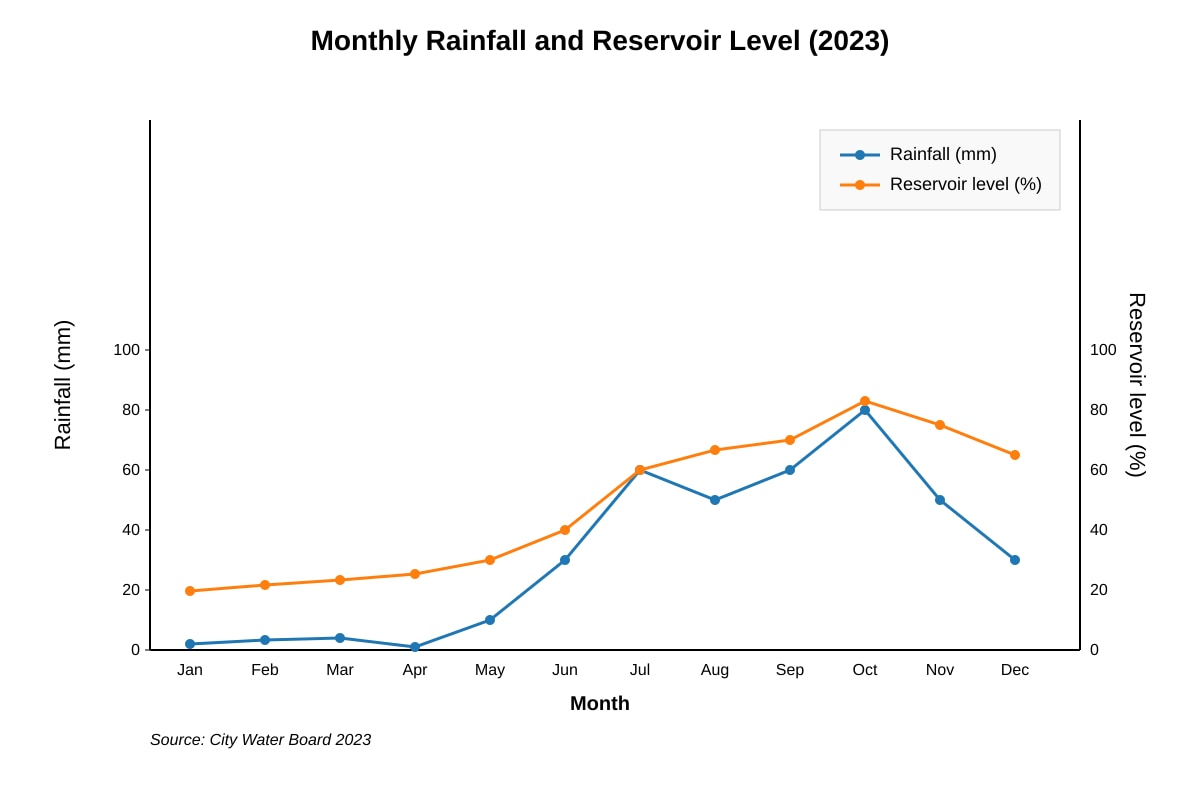
Answer: Reservoir level follows rainfall with lag; low rain Jan–Apr → 38–45%, high rain Oct → 81% (1m per described trend, max 3).
Visual: Q9-fig1 lines show correlation.
Q10 [4 marks]
Answer: Reimaging attracts investment but may raise costs/gentrification (2m), displacing vulnerable groups → social sustainability tension (2m).
Q11 [5 marks]
Answer: Resource 6 shows solar 2%→18%. Causes: subsidies for solar (2m), tech cost fall (2m), coal drop 38%→12% from policy (1m).
Q12 [2 marks]
Answer: Any two: accessibility, healthcare proximity, safety, affordability. (1m each)
Q13 [4 marks]
Answer: Useful: shows harassment 63% women vs 12% men (2m). Limit: self-report, only Metro Manila (2m).
Q14 [2 marks]
Not recycled = 1200 × (1 – 0.30) = 840 tonnes.
Marks: 1 calc, 1 answer.
Section C Answers (18 marks)
Q15 [3 marks]
Answer: Infrastructure (water, roads) needed (1m); tenure security prevents eviction and encourages investment (1m); examples e.g., Rio favela upgrades (1m).
Q16 [4 marks]
Answer: Success: reduces landfill, generates power (2m); limits: emissions, high cost (2m). Use descriptor: balanced eval.
Q17 [3 marks]
Answer: Elderly need walkability (1m); women face safety issues (1m); both show subjective liveability (1m).
Q18 [4 marks]
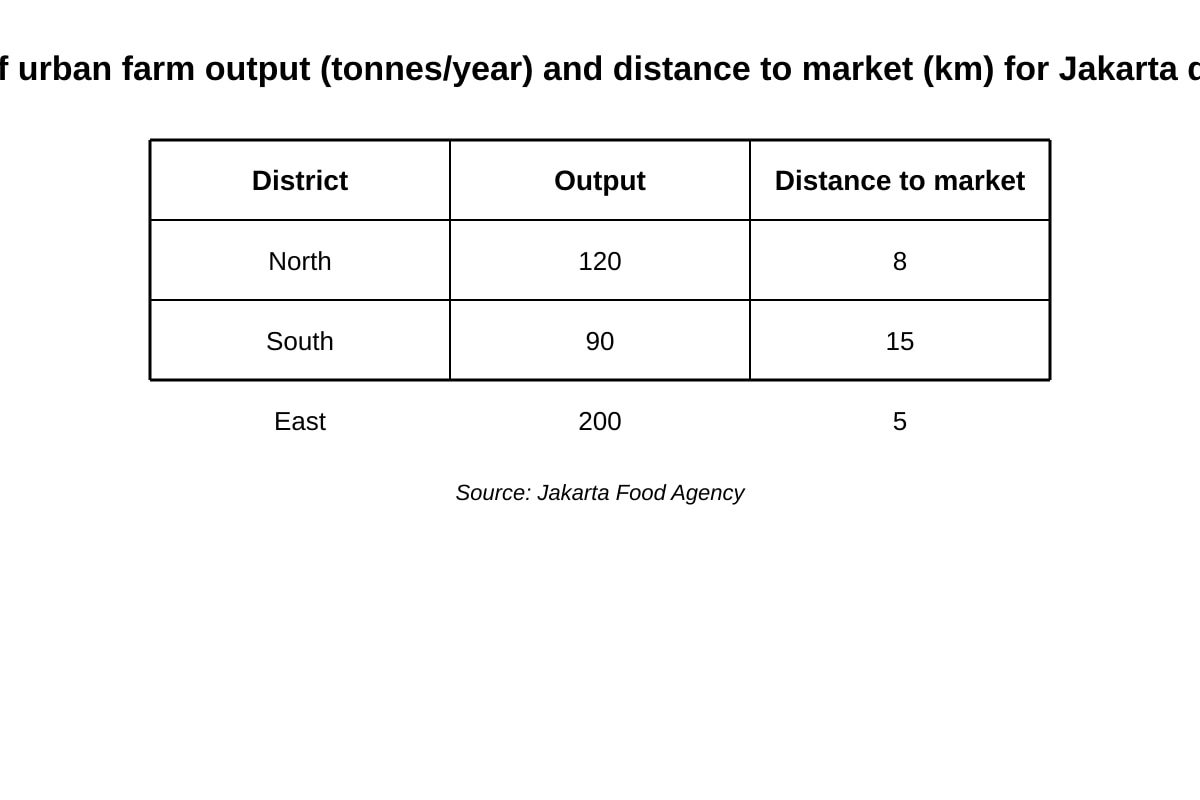
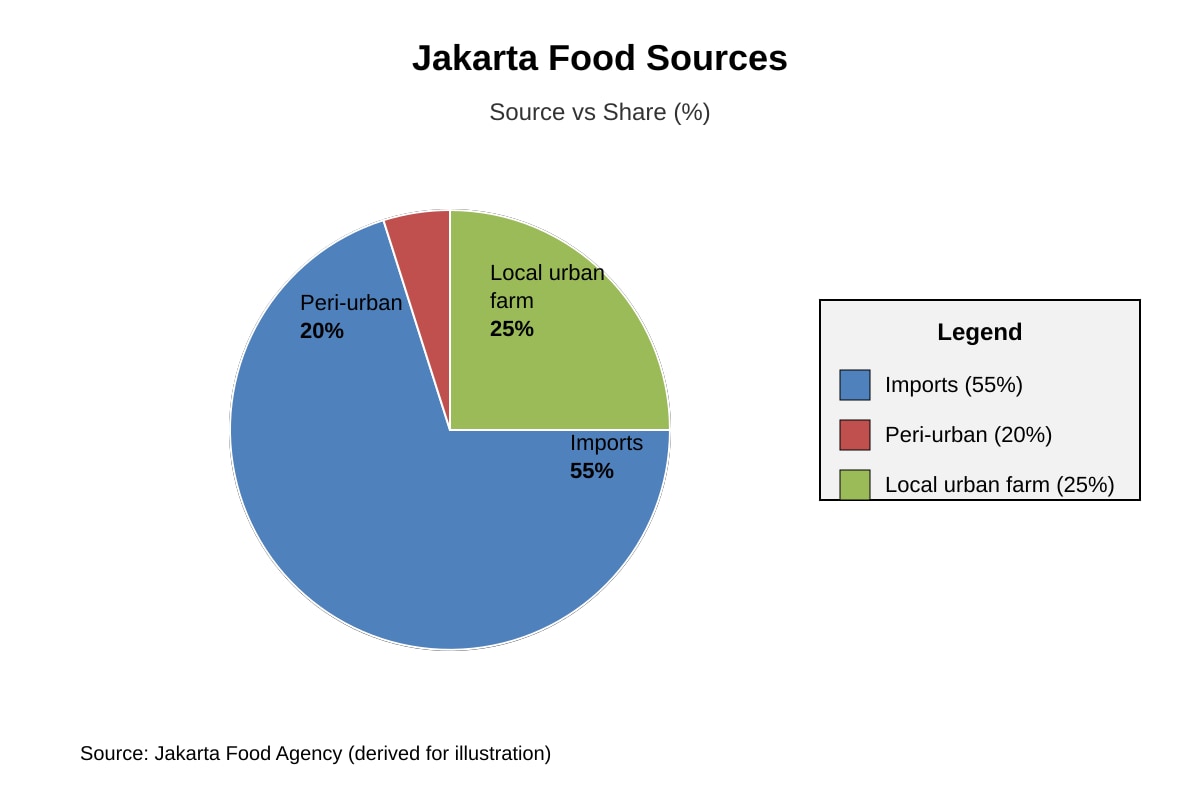
Answer: Res 8 table useful for output/distribution (2m); Res 9 pie useful for source share (1m); together show local limits (1m).
Visual: Q18 figs show data.
Q19 [2 marks]
Answer: Circular economy reuses materials, cutting extraction (1m); extent limited by tech/behaviour (1m).
Q20 [2 marks]
Target = 180 × (1 – 0.25) = 135 L/person/day.
Marks: 1 calc, 1 answer.