From Real Exams Exam Paper
A Level H1 Geography Practice Paper 3
Free A Level H1 Geography Practice Paper 3, LongCat Exam version, with questions, answers, and A Level-style practice for Singapore students.
These static practice materials are generated from the site's syllabus and paper-generation workflow, with source and model context shown so students and parents can evaluate the material before use.
Questions
TuitionGoWhere Practice Paper - Geography H1 A-Level
TuitionGoWhere Secondary School (AI)
| Subject: | Geography |
| Level: | A-Level H1 |
| Paper: | Practice Paper (Resources & Sustainability) |
| Version: | 3 of 5 |
| Duration: | 1 hour 30 minutes |
| Total Marks: | 60 |
| Name: | ______________________________ |
| Class: | ______________________________ |
| Date: | ______________________________ |
Instructions to Candidates
- Write your name, class, and date in the spaces provided above.
- Answer ALL questions in Section A and Section B.
- Write your answers in the spaces provided on the question paper.
- The number of marks for each question or part-question is shown in brackets [ ].
- Begin each section on a fresh page.
- You are advised to spend approximately 45 minutes on Section A and 45 minutes on Section B.
- The total marks for this paper is 60 marks.
Section A: Source-Based Questions (30 marks)
Answer ALL questions in this section.
Question 1
Resource 1 shows the global distribution of water stress levels across selected countries in 2023.
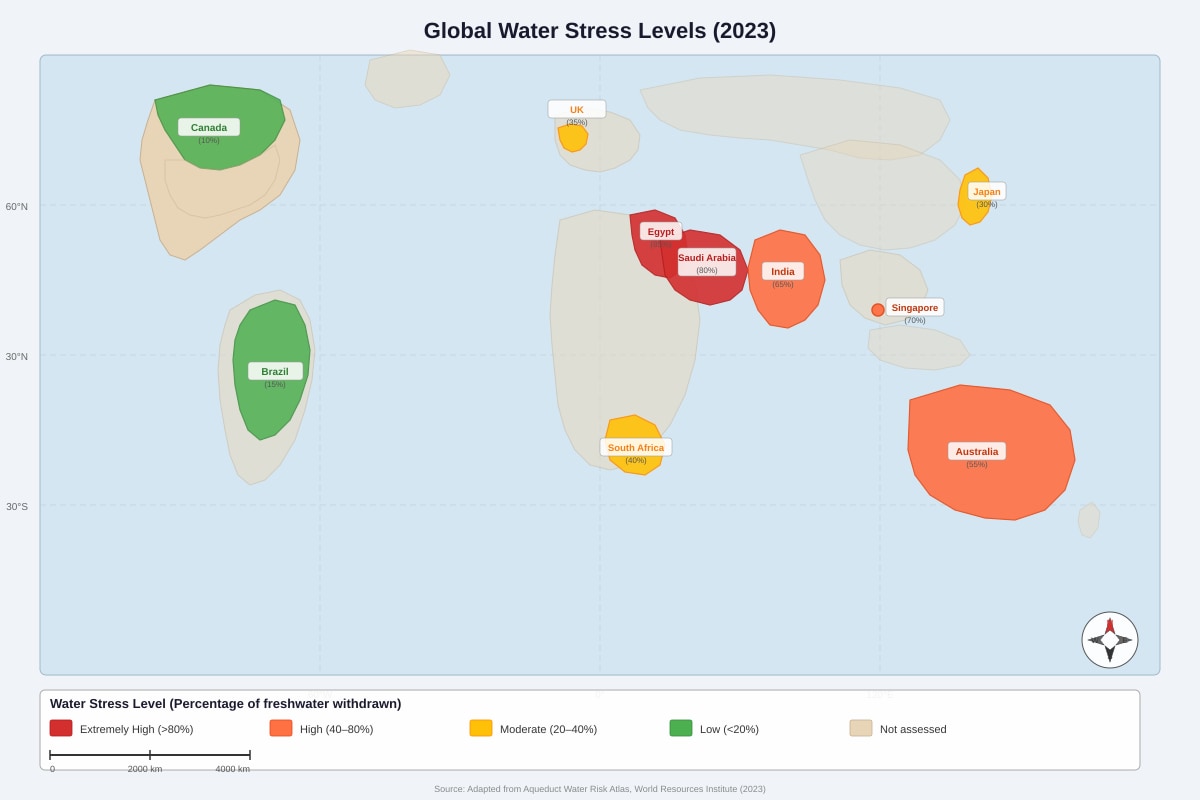
Generated map for Q1.
(a) Describe the pattern of water stress shown in Resource 1. [3]
(b) Suggest two reasons why some countries experience extremely high water stress. [4]
(c) Explain how water stress can affect economic development in a country. [3]
[Total: 10 marks]
Question 2
Resource 2 shows data on food production and population growth for Country X between 2000 and 2023.
| Year | Index of Food Production (2000 = 100) | Population (millions) |
|---|---|---|
| 2000 | 100 | 45.2 |
| 2005 | 108 | 48.1 |
| 2010 | 119 | 51.3 |
| 2015 | 127 | 54.8 |
| 2020 | 138 | 58.6 |
| 2023 | 142 | 60.9 |
(a) Calculate the percentage change in food production index from 2000 to 2023. Show your working. [2]
(b) Compare the trends in food production and population growth shown in Resource 2. [3]
(c) Account for the changes in food production in Country X between 2000 and 2023. [4]
(d) Evaluate the extent to which Country X can achieve food security by 2030. [4]
[Total: 13 marks]
Question 3
Resource 3 is an extract about energy transitions in Southeast Asia.
"Southeast Asian nations are increasingly investing in renewable energy sources to reduce dependence on fossil fuels. Vietnam has rapidly expanded its solar photovoltaic capacity from near zero in 2018 to over 16 GW by 2023. Thailand has invested heavily in biomass and solar energy, while Indonesia continues to rely on coal for over 60% of its electricity generation. The ASEAN Plan of Action for Energy Cooperation targets 23% renewable energy in the primary energy mix by 2025. However, challenges remain, including grid infrastructure limitations, financing constraints, and the need to balance economic growth with environmental sustainability. Singapore, despite limited land area, has deployed over 800 MW of solar capacity, primarily through rooftop installations and floating solar farms on reservoirs."
(a) Using Resource 3, identify two challenges faced by Southeast Asian countries in transitioning to renewable energy. [2]
(b) Explain why Indonesia continues to rely heavily on coal for electricity generation. [3]
(c) To what extent can Singapore's approach to solar energy deployment be considered a model for other land-scarce countries? [5]
[Total: 10 marks]
Section B: Structured Response Questions (30 marks)
Answer ALL questions in this section.
Question 4
(a) Define the term sustainable development. [2]
(b) Explain three strategies that governments can use to manage natural resources sustainably. [6]
(c) Discuss the view that economic growth is incompatible with resource sustainability. [7]
[Total: 15 marks]
Question 5
(a) Describe two ways in which climate change can affect water resources. [4]
(b) Explain how a named country or region has attempted to manage its water resources sustainably. In your answer, refer to specific strategies, their effectiveness, and any challenges faced. [8]
(c) Assess the role of technology in improving resource sustainability. [3]
[Total: 15 marks]
END OF PAPER
Total Marks: 60
| Section | Marks |
|---|---|
| Section A (Q1) | 10 |
| Section A (Q2) | 13 |
| Section A (Q3) | 10 |
| Section B (Q4) | 15 |
| Section B (Q5) | 15 |
| Total | 63 |
Note: Section A = 33 marks, Section B = 30 marks. Total = 63 marks.
BLANK PAGE
BLANK PAGE
Answers
TuitionGoWhere Practice Paper - Geography H1 A-Level
Answer Key & Marking Scheme
Subject: Geography (H1) | Paper: Practice Paper (Resources & Sustainability) | Version: 3 of 5
Section A: Source-Based Questions
Question 1 (10 marks)
(a) Describe the pattern of water stress shown in Resource 1. [3]
Marking Scheme:
| Marks | Descriptor |
|---|---|
| 1 | Identifies that water stress varies globally / some countries have higher stress than others (basic observation, no specific reference to resource) |
| 2 | Describes the pattern with reference to specific countries or regions from the resource (e.g., countries in the Middle East such as Saudi Arabia and Egypt experience extremely high water stress, while countries in South America such as Brazil and Canada in North America have low water stress) |
| 3 | Provides a detailed, well-structured description with accurate reference to multiple countries and categories from the resource, noting that arid/semi-arid regions tend to experience higher water stress while tropical and temperate regions with higher rainfall tend to experience lower water stress |
Teaching Notes:
- Water stress refers to the ratio of total water withdrawals to available renewable water supplies. Students should describe spatial patterns, not explain them (that comes in part b).
- Common mistake: Students explain why patterns exist instead of describing what the map shows. "Describe" questions require observation and reference to the resource, not causation.
- A strong answer would note: "Countries in arid regions such as Saudi Arabia and Egypt experience extremely high water stress (over 80%), while tropical countries with abundant rainfall such as Brazil experience low water stress. Moderate water stress is seen in countries like the United Kingdom and Japan. Singapore, despite being in a tropical region, experiences high water stress due to its limited land area for water catchment."
(b) Suggest two reasons why some countries experience extremely high water stress. [4]
Marking Scheme:
| Marks | Descriptor |
|---|---|
| 1–2 | One valid reason identified and briefly explained (1 mark per reason, up to 2) |
| 3–4 | Two valid reasons, each clearly explained with development and/or linkage to water stress |
Expected Answers (any two, 2 marks each):
-
Arid/semi-arid climate with low rainfall – Countries like Saudi Arabia and Egypt are located in desert or semi-desert regions where annual precipitation is very low (often below 250 mm/year). This limits the natural replenishment of freshwater sources such as rivers, lakes, and groundwater aquifers, leading to extremely high water stress as demand far exceeds renewable supply.
-
High population density and water demand – Rapid population growth and urbanisation increase domestic, agricultural, and industrial water demand. In countries like Singapore, the high population density (over 7,800 people per km²) creates enormous demand relative to the limited natural water resources available within national boundaries.
-
Over-extraction of groundwater – Excessive pumping of groundwater for agriculture (e.g., irrigation in India) can deplete aquifers faster than they are naturally replenished, reducing available freshwater and increasing water stress over time.
-
Limited natural freshwater sources – Some countries lack major rivers, lakes, or significant groundwater reserves. Island nations or small states may have limited catchment areas and depend heavily on rainfall or imported water.
Teaching Notes:
- "Suggest" means students can use their own knowledge alongside the resource. They do not need to have studied the specific countries.
- Each reason should be a distinct point with a clear explanation linking the cause to water stress. Award 1 mark for identifying the reason and 1 mark for explaining how it leads to water stress.
- Common mistake: Students state reasons without explaining the causal link (e.g., "because of hot weather" without connecting it to low rainfall and high evaporation).
(c) Explain how water stress can affect economic development in a country. [3]
Marking Scheme:
| Marks | Descriptor |
|---|---|
| 1 | Identifies one relevant impact on economic development with limited explanation |
| 2 | Explains one impact in detail OR two impacts with limited development |
| 3 | Provides a well-developed explanation of at least two ways water stress affects economic development, with clear causal chains |
Expected Answers:
-
Reduced agricultural productivity – Water stress limits the availability of water for irrigation, reducing crop yields and livestock output. This can lead to food shortages, increased food import costs, and loss of income for farming communities, slowing overall economic growth. In countries where agriculture is a significant part of GDP, this impact is particularly severe.
-
Increased costs for industrial production – Industries that depend on water (e.g., manufacturing, mining, energy production) face higher operational costs when water is scarce. Companies may need to invest in water recycling, desalination, or water-efficient technologies, reducing profit margins and potentially deterring foreign investment.
-
Health and social costs – Water stress can lead to inadequate sanitation and clean drinking water, increasing the prevalence of waterborne diseases. This reduces workforce productivity due to illness and increases healthcare expenditure, diverting government funds from development projects.
-
Energy production constraints – Many energy generation methods (e.g., hydroelectric power, thermal power plant cooling) require significant water. Water stress can limit energy production, leading to power shortages that disrupt economic activity.
Teaching Notes:
- Students should demonstrate cause-and-effect reasoning: water stress → specific consequence → impact on economic development.
- Award marks for the quality of explanation, not just the number of points. A single well-developed point can score 2 marks.
- Common mistake: Students describe water stress impacts on people's daily lives without linking to economic development (GDP, productivity, investment, etc.).
Question 2 (13 marks)
(a) Calculate the percentage change in food production index from 2000 to 2023. Show your working. [2]
Answer:
Percentage change=Value in 2000Value in 2023−Value in 2000×100%
=100142−100×100%
=10042×100%
=42%
Marking Scheme:
| Marks | Descriptor |
|---|---|
| 1 | Correct method/formula shown but calculation error, OR correct answer without working |
| 2 | Correct method and correct answer (42%) |
Teaching Notes:
- Students must show working to receive full marks. The formula for percentage change is fundamental and should be memorised.
- Common mistake: Dividing by the final value (142) instead of the initial value (100), giving 29.6% instead of 42%.
(b) Compare the trends in food production and population growth shown in Resource 2. [3]
Marking Scheme:
| Marks | Descriptor |
|---|---|
| 1 | States that both have increased (basic comparison, no data reference) |
| 2 | Compares trends with some reference to data from the resource (e.g., food production increased from 100 to 142 while population increased from 45.2m to 60.9m) |
| 3 | Detailed comparison noting that food production has increased at a faster rate than population growth, with accurate data support and recognition that per capita food production has therefore increased |
Expected Answer:
- Both food production and population increased between 2000 and 2023.
- Food production index rose from 100 to 142 (a 42% increase), while population rose from 45.2 million to 60.9 million (approximately a 35% increase).
- Food production has grown at a faster rate than population, suggesting that per capita food availability has improved over this period.
Teaching Notes:
- "Compare" requires students to identify both similarities and differences. A similarity is that both increased; a difference is the rate of increase.
- Students should use data from the table to support their comparison. Generic statements without data reference score lower.
- Common mistake: Describing each trend separately without making direct comparisons between them.
(c) Account for the changes in food production in Country X between 2000 and 2023. [4]
Marking Scheme:
| Marks | Descriptor |
|---|---|
| 1–2 | Identifies one or two reasons with limited explanation |
| 3–4 | Provides two or more well-developed reasons explaining the increase in food production, with clear causal links |
Expected Answers (any valid reasons, well-developed):
-
Technological advancements in agriculture – The adoption of modern farming technologies such as high-yield crop varieties, precision farming, mechanisation, and improved irrigation systems has increased agricultural productivity. For example, the use of genetically modified crops resistant to pests and drought can significantly boost yields.
-
Government policies and investment – Government subsidies for farmers, investment in agricultural research and development, and policies supporting food self-sufficiency can drive increases in food production. Agricultural extension services that train farmers in modern techniques also contribute.
-
Increased use of fertilisers and agrochemicals – Greater application of chemical fertilisers, pesticides, and herbicides has improved crop yields by enhancing soil fertility and reducing crop losses to pests and weeds.
-
Expansion of cultivated land – Conversion of forests, grasslands, or wetlands into agricultural land increases the total area under cultivation, contributing to higher overall food production.
-
Improved infrastructure – Better transportation networks, storage facilities, and market access reduce post-harvest losses and incentivise farmers to increase production.
Teaching Notes:
- "Account for" means explain the causes/reasons behind the changes. Students should not just describe what changed but explain why.
- Each reason should be developed with a clear explanation of how it leads to increased food production.
- Award 2 marks per well-developed reason (identification + explanation/development).
(d) Evaluate the extent to which Country X can achieve food security by 2030. [4]
Marking Scheme:
| Marks | Descriptor |
|---|---|
| 1 | Makes a simple statement about food security with no development |
| 2 | Provides some explanation but lacks evaluation or balance |
| 3 | Provides a balanced response with some evaluation of the extent to which food security can be achieved |
| 4 | Well-balanced evaluation considering both reasons for optimism and challenges, with a clear judgement about the extent to which food security is achievable |
Expected Answer:
Food security exists when all people, at all times, have physical, social, and economic access to sufficient, safe, and nutritious food (FAO definition).
Arguments that Country X CAN achieve food security:
- The data shows food production has outpaced population growth (42% vs ~35%), suggesting a positive trajectory.
- If current trends continue, per capita food availability will keep improving.
- Technological advancements (e.g., vertical farming, drought-resistant crops) could further boost production.
Arguments that Country X may STRUGGLE to achieve food security:
- Population is still growing, and the rate of food production increase may slow as easily accessible arable land becomes scarce.
- Climate change could disrupt agricultural production through extreme weather events, changing rainfall patterns, and increased temperatures.
- Food security is not just about production – it also requires access, affordability, and nutritional quality. Inequality may prevent equitable food distribution.
- Environmental degradation from intensive farming (soil erosion, water pollution) could undermine long-term production capacity.
Judgement: Country X is likely to make progress towards food security given the positive production trends, but achieving full food security by 2030 is challenging due to population growth pressures, climate change risks, and distributional inequalities. The extent depends on continued investment in sustainable agriculture and equitable food distribution systems.
Teaching Notes:
- "Evaluate" and "to what extent" require students to make a judgement. They should consider both sides and reach a reasoned conclusion.
- Common mistake: Students only discuss one side (either optimistic or pessimistic) without balancing their argument.
- A Level students should demonstrate higher-order thinking by weighing evidence and qualifying their judgement.
Question 3 (10 marks)
(a) Using Resource 3, identify two challenges faced by Southeast Asian countries in transitioning to renewable energy. [2]
Answer:
- Grid infrastructure limitations
- Financing constraints
(Also acceptable: the need to balance economic growth with environmental sustainability)
Marking Scheme: 1 mark per valid challenge identified directly from Resource 3.
Teaching Notes:
- "Using Resource 3" means students must find the answer in the extract, not from their own knowledge.
- This is a straightforward identification/recall question. No explanation is required.
(b) Explain why Indonesia continues to rely heavily on coal for electricity generation. [3]
Marking Scheme:
| Marks | Descriptor |
|---|---|
| 1 | Identifies one relevant reason with limited explanation |
| 2 | Explains one reason in detail OR two reasons with limited development |
| 3 | Provides a well-developed explanation with multiple reasons or one thoroughly explained reason with clear causal chain |
Expected Answers:
-
Abundant domestic coal reserves – Indonesia has large coal deposits, making coal a readily available and relatively cheap domestic energy source. Using domestic coal reduces dependence on imported fuels and supports energy security.
-
Established infrastructure – Indonesia has invested heavily in coal-fired power plants and the associated infrastructure (mining, transportation, grid connections). Transitioning away from coal would require massive new investment and could strand existing assets.
-
Economic development priorities – As a developing nation, Indonesia prioritises affordable and reliable energy to support industrialisation and economic growth. Coal provides a cost-effective baseload power source compared to some renewable alternatives, which may be intermittent or require expensive storage solutions.
-
Employment and political economy – The coal industry provides significant employment in mining regions. Transitioning away from coal could face political resistance due to job losses and economic disruption in coal-dependent communities.
Teaching Notes:
- Students should demonstrate understanding of the economic, political, and infrastructural factors that create path dependency in energy systems.
- Common mistake: Students simply state "coal is cheap" without explaining why it is cheap in Indonesia's context (domestic availability, existing infrastructure).
(c) To what extent can Singapore's approach to solar energy deployment be considered a model for other land-scarce countries? [5]
Marking Scheme:
| Marks | Descriptor |
|---|---|
| 1–2 | Describes Singapore's approach with limited evaluation |
| 3 | Explains Singapore's approach and makes some attempt at evaluation |
| 4 | Well-developed explanation with clear evaluation of the model's applicability |
| 5 | Comprehensive, balanced evaluation with specific reference to Singapore's strategies, clear assessment of transferability, and a well-supported judgement |
Expected Answer:
Singapore's approach (from Resource 3):
- Deployed over 800 MW of solar capacity despite limited land area
- Rooftop solar installations on buildings
- Floating solar farms on reservoirs
Why it CAN be a model:
- Innovative use of limited space – Rooftop and floating solar demonstrate that land scarcity does not have to be a barrier to solar deployment. Other land-scarce countries (e.g., Hong Kong, Maldives, Monaco) could adopt similar approaches.
- Government leadership – Singapore's strong government planning and investment in clean energy provides a replicable framework for policy-driven energy transitions.
- Technological adaptation – Singapore's use of floating solar technology shows how innovation can overcome geographical constraints, inspiring other nations to explore context-specific solutions.
Why it may NOT be a model:
- Unique economic capacity – Singapore is a high-income country with significant financial resources to invest in solar infrastructure. Many land-scarce developing countries (e.g., Bangladesh, Haiti) may lack the capital for similar investments.
- Small scale – Singapore's total energy demand is relatively small compared to larger nations. Scaling up this approach for countries with much larger populations and energy needs may not be feasible.
- Specific geographical features – Singapore's reservoirs provide ideal conditions for floating solar. Not all land-scarce countries have suitable water bodies for this technology.
- Grid and infrastructure – Singapore's advanced grid infrastructure and technical expertise may not be replicable in countries with less developed energy systems.
Judgement: Singapore's approach offers valuable lessons in innovation and policy leadership for land-scarce countries, particularly the principle of maximising underutilised spaces for solar deployment. However, its direct transferability is limited by economic, geographical, and infrastructural differences. It is best considered as an inspirational model rather than a directly replicable blueprint.
Teaching Notes:
- This is an essay-style question requiring evaluation. Students must consider both the strengths and limitations of Singapore as a model.
- Common mistake: Students only describe what Singapore has done without evaluating whether it can be applied elsewhere.
- A strong answer will use specific examples and make a clear, qualified judgement.
Section B: Structured Response Questions
Question 4 (15 marks)
(a) Define the term sustainable development. [2]
Answer: Sustainable development is development that meets the needs of the present without compromising the ability of future generations to meet their own needs (Brundtland Commission, 1987).
Marking Scheme:
| Marks | Descriptor |
|---|---|
| 1 | Partial definition showing some understanding (e.g., "development that doesn't harm the environment") |
| 2 | Complete and accurate definition, ideally referencing present and future generations |
Teaching Notes:
- The Brundtland definition is the standard expected at A-Level. Students should memorise it.
- Common mistake: Confusing sustainable development with environmental protection alone. Sustainable development encompasses economic, social, and environmental dimensions.
(b) Explain three strategies that governments can use to manage natural resources sustainably. [6]
Marking Scheme: 2 marks per strategy (1 for identifying the strategy, 1 for explaining how it promotes sustainable resource management).
Expected Answers (any three):
-
Legislation and regulation – Governments can enact laws that limit resource extraction, set pollution standards, and protect natural habitats. For example, fishing quotas prevent overfishing and allow fish stocks to regenerate. Environmental impact assessments (EIAs) ensure that development projects consider environmental consequences before approval.
-
Economic instruments (taxes, subsidies, tradable permits) – Governments can use market-based tools to incentivise sustainable behaviour. Carbon taxes make polluting activities more expensive, encouraging businesses to reduce emissions. Subsidies for renewable energy make clean technologies more competitive. Tradable pollution permits create a market for emissions, allowing the market to find the most cost-effective reductions.
-
Education and public awareness campaigns – Governments can fund programmes to educate citizens about sustainable resource use, recycling, and conservation. Informed citizens are more likely to make sustainable choices, reduce waste, and support environmental policies. For example, Singapore's National Environment Agency runs campaigns on water conservation and recycling.
-
Investment in research and technology – Government funding for R&D can lead to innovations that improve resource efficiency, such as water recycling technologies, renewable energy systems, and sustainable agricultural practices. Singapore's investment in NEWater (recycled water) technology is an example.
-
International cooperation and agreements – Governments can participate in international treaties and agreements (e.g., the Paris Agreement on climate change, Convention on Biological Diversity) to coordinate global efforts in resource management and environmental protection.
-
Protected areas and conservation zones – Designating national parks, marine reserves, and conservation areas protects biodiversity and natural resources from overexploitation.
Teaching Notes:
- Each strategy must be clearly identified AND explained in terms of how it contributes to sustainable resource management.
- Common mistake: Students list strategies without explaining how they work or why they promote sustainability.
- Real-world examples strengthen answers but are not strictly required for full marks.
(c) Discuss the view that economic growth is incompatible with resource sustainability. [7]
Marking Scheme:
| Marks | Descriptor |
|---|---|
| 1–2 | Describes the relationship between economic growth and resource use with limited discussion |
| 3–4 | Presents arguments for or against the view with some development and examples |
| 5–6 | Balanced discussion with well-developed arguments on both sides, supported by examples |
| 7 | Comprehensive, balanced discussion with a clear, well-supported judgement; demonstrates sophisticated understanding of the relationship between growth and sustainability |
Expected Answer:
Introduction: The relationship between economic growth and resource sustainability is complex. While traditional models of economic growth have often relied on the exploitation of natural resources, there is growing evidence that the two can be reconciled through sustainable practices and technological innovation.
Arguments that economic growth IS incompatible with resource sustainability:
-
Resource depletion – Economic growth typically requires increased extraction and consumption of natural resources (fossil fuels, minerals, water, timber). Finite resources cannot sustain indefinite growth, leading to depletion and environmental degradation. For example, rapid industrialisation in China has led to severe air and water pollution, deforestation, and soil degradation.
-
Pollution and waste – Industrial production and consumption generate pollution and waste that exceed the environment's absorptive capacity. Climate change, driven by greenhouse gas emissions from economic activity, is a prime example of how growth undermines environmental sustainability.
-
Ecological footprint – The global ecological footprint already exceeds the Earth's biocapacity. If all countries developed at the rate of high-income nations, multiple Earths would be needed to sustain resource consumption.
-
Short-term profit vs. long-term sustainability – Market economies often prioritise short-term profits over long-term environmental sustainability, as environmental costs are externalised (not reflected in market prices).
Arguments that economic growth CAN be compatible with resource sustainability:
-
Decoupling – Some countries have demonstrated that GDP growth can be decoupled from resource consumption and environmental degradation through efficiency improvements and structural economic shifts. For example, many European countries have reduced carbon emissions while maintaining economic growth.
-
Green technology and innovation – Technological advances in renewable energy, energy efficiency, circular agriculture, and waste reduction can enable economic growth with reduced environmental impact. The falling cost of solar energy, for instance, shows that clean energy can be economically competitive.
-
Circular economy – Shifting from a linear "take-make-dispose" economic model to a circular model (where materials are reused, recycled, and regenerated) can support growth while minimising resource extraction and waste.
-
Sustainable development frameworks – International frameworks like the UN Sustainable Development Goals (SDGs) explicitly aim to achieve economic growth alongside environmental sustainability, demonstrating that the two are not inherently incompatible.
-
Ecosystem services valuation – Increasingly, governments and businesses are recognising the economic value of ecosystem services (e.g., pollination, water purification, carbon sequestration), creating financial incentives for conservation.
Judgement: While traditional models of economic growth have often been incompatible with resource sustainability, this is not an inherent or inevitable relationship. With appropriate policies, technological innovation, and a shift towards circular economic models, it is possible to achieve economic growth that operates within planetary boundaries. However, this requires fundamental changes in how economies are structured and how success is measured (moving beyond GDP to include environmental and social indicators). The compatibility of growth and sustainability depends on the type of growth pursued – qualitative, resource-efficient growth can be sustainable, while quantitative, resource-intensive growth cannot continue indefinitely.
Teaching Notes:
- "Discuss" requires a balanced argument with a clear judgement. Students should present both sides before reaching a conclusion.
- Common mistake: Students present only one side of the argument or fail to reach a judgement.
- A-Level students are expected to demonstrate critical thinking, use real-world examples, and show understanding of complexity and nuance.
- The concept of "decoupling" and "circular economy" are high-level ideas that can elevate an answer to the top mark band.
Question 5 (15 marks)
(a) Describe two ways in which climate change can affect water resources. [4]
Marking Scheme: 2 marks per way (1 for identifying the way, 1 for describing it clearly).
Expected Answers (any two):
-
Altered precipitation patterns – Climate change is causing shifts in rainfall distribution, with some regions experiencing more intense and frequent droughts while others face increased flooding. Reduced rainfall in already arid regions decreases surface water availability and lowers groundwater recharge rates, exacerbating water scarcity. For example, the Mediterranean region is projected to experience significant reductions in annual precipitation.
-
Glacial melt and reduced snowpack – Rising temperatures are accelerating the melting of glaciers and reducing seasonal snowpack. In the short term, this may increase river flow, but in the long term, the loss of glaciers reduces a critical freshwater source for millions of people. The Himalayan glaciers, which feed major rivers like the Ganges and Indus, are retreating at an alarming rate, threatening water security for over a billion people in South Asia.
-
Increased evapotranspiration – Higher temperatures increase evaporation from water bodies and transpiration from plants, reducing the amount of water available in rivers, lakes, and soils. This intensifies water stress, particularly in tropical and subtropical regions.
-
Sea-level rise and saltwater intrusion – Rising sea levels can cause saltwater to infiltrate coastal freshwater aquifers, contaminating groundwater supplies. This is particularly problematic for low-lying island nations and coastal communities that depend on groundwater for drinking water and irrigation.
-
Increased frequency of extreme weather events – More frequent and intense storms can overwhelm water infrastructure, cause contamination of water supplies through flooding, and damage water treatment facilities.
Teaching Notes:
- "Describe" requires students to explain how climate change affects water resources, not just state that it does.
- Each point should be a distinct mechanism with a clear description of the process.
- Common mistake: Students state vague impacts (e.g., "there will be less water") without explaining the specific mechanism.
(b) Explain how a named country or region has attempted to manage its water resources sustainably. In your answer, refer to specific strategies, their effectiveness, and any challenges faced. [8]
Marking Scheme:
| Marks | Descriptor |
|---|---|
| 1–2 | Identifies a country/region and describes one strategy with limited detail |
| 3–4 | Describes strategies with some explanation of effectiveness but limited discussion of challenges |
| 5–6 | Well-developed explanation of multiple strategies with assessment of effectiveness and some challenges |
| 7–8 | Comprehensive explanation of specific strategies, detailed assessment of effectiveness, and thorough discussion of challenges; well-structured with clear examples |
Expected Answer (using Singapore as the named country):
Singapore – A Water-Scarce Nation's Approach
Singapore faces significant water stress due to its limited land area (733 km²), high population density, and lack of natural freshwater lakes or major rivers. The country has implemented a comprehensive water management strategy known as the "Four National Taps":
Strategy 1: Local Catchment Water
- Singapore has developed an extensive network of reservoirs and drainage systems to capture rainwater. Approximately two-thirds of Singapore's land area serves as water catchment.
- 17 reservoirs have been created, including the Marina Reservoir in the city centre.
- Effectiveness: This provides a significant portion of Singapore's water supply and reduces dependence on imported water. The completion of the Marina and Punggol-Serangoon reservoir schemes increased catchment coverage.
- Challenges: Limited land area constrains further expansion. Climate change may alter rainfall patterns, affecting catchment reliability. Urbanisation can increase runoff pollution.
Strategy 2: Imported Water
- Singapore imports water from Johor, Malaysia, under agreements dating back to 1961 and 1962. The current agreement expires in 2061.
- Effectiveness: Provides a reliable supplementary supply, historically meeting up to 40% of demand.
- Challenges: Geopolitical vulnerability – dependence on Malaysia creates diplomatic tensions. Malaysia has periodically threatened to raise water prices or cut supply. The 2061 expiry creates long-term uncertainty.
Strategy 3: NEWater (Recycled Water)
- NEWater is high-grade reclaimed water produced by purifying treated used water using advanced membrane technology (microfiltration, reverse osmosis) and ultraviolet disinfection.
- Five NEWater plants supply up to 40% of Singapore's current water demand, with plans to increase this to 55% by 2060.
- Effectiveness: Highly effective in diversifying water sources and reducing import dependence. NEWater meets up to 40% of demand and is of a quality that exceeds WHO drinking water standards (though it is primarily used for industrial purposes and blended with reservoir water).
- Challenges: High energy consumption in the treatment process (reverse osmosis requires significant electricity). High capital and operational costs. Public perception – initial resistance to the idea of drinking recycled water (the term "NEWater" was deliberately chosen to rebrand the concept).
Strategy 4: Desalination
- Singapore opened its first desalination plant in 2005 (SingSpring) and has since added the Tuas and Keppel Marina East desalination plants. Desalination currently meets up to 30% of water demand, with plans to increase to 30% by 2060.
- Effectiveness: Provides a climate-independent water source, as it is not reliant on rainfall. Technology has improved, reducing costs.
- Challenges: Energy-intensive process (desalination requires approximately 3.5 kWh per cubic metre of water). Brine discharge can harm marine ecosystems if not properly managed. High operational costs compared to conventional water sources.
Overall Assessment: Singapore's integrated approach to water management is widely regarded as a global model. The diversification across four sources reduces vulnerability to any single supply disruption. The PUB (Public Utilities Board) has set ambitious targets to be self-sufficient by 2061 when the Malaysian import agreement expires. However, challenges remain, including rising energy costs, climate change impacts on rainfall, and the need for continued public support and investment.
Teaching Notes:
- Students can choose any country/region. Other strong examples include: Israel (drip irrigation, desalination, water recycling), Australia (Murray-Darling Basin Plan, water trading), or the Netherlands (integrated water management, flood control).
- The question requires specific strategies, effectiveness, AND challenges. Many students forget to discuss challenges.
- Common mistake: Students describe what a country does without evaluating how well it works or what difficulties remain.
- For 7–8 marks, students need multiple specific strategies with detailed assessment.
(c) Assess the role of technology in improving resource sustainability. [3]
Marking Scheme:
| Marks | Descriptor |
|---|---|
| 1 | Identifies one way technology can help with limited explanation |
| 2 | Explains one way in detail OR two ways with limited development |
| 3 | Provides a balanced assessment of technology's role, acknowledging both its potential and limitations |
Expected Answer:
Technology's positive role:
- Technology can significantly improve resource efficiency and reduce waste. For example, precision agriculture uses GPS, sensors, and data analytics to optimise water, fertiliser, and pesticide use, reducing environmental impact while maintaining yields. Renewable energy technologies (solar, wind) reduce dependence on finite fossil fuels. Water recycling and desalination technologies expand available water resources.
Limitations of technology:
- Technology alone cannot solve sustainability problems – it must be accompanied by appropriate policies, behavioural changes, and economic incentives. Some technologies are expensive and inaccessible to developing countries. Technology can also create new environmental problems (e.g., electronic waste from renewable energy components, energy-intensive desalination). The "rebound effect" means that efficiency gains can be offset by increased consumption (Jevons paradox).
Assessment: Technology is a necessary but not sufficient condition for resource sustainability. It provides powerful tools for improving efficiency, developing alternatives, and monitoring resource use, but must be deployed within a framework of good governance, equitable access, and responsible consumption patterns.
Teaching Notes:
- "Assess" requires students to weigh the importance/effectiveness of technology, not just describe what it does.
- A balanced answer that acknowledges both benefits and limitations scores highest.
- Common mistake: Students only discuss the benefits of technology without acknowledging limitations.
Summary of Marks
| Question | Part | Marks |
|---|---|---|
| Q1 | (a) | 3 |
| Q1 | (b) | 4 |
| Q1 | (c) | 3 |
| Q1 Total | 10 | |
| Q2 | (a) | 2 |
| Q2 | (b) | 3 |
| Q2 | (c) | 4 |
| Q2 | (d) | 4 |
| Q2 Total | 13 | |
| Q3 | (a) | 2 |
| Q3 | (b) | 3 |
| Q3 | (c) | 5 |
| Q3 Total | 10 | |
| Q4 | (a) | 2 |
| Q4 | (b) | 6 |
| Q4 | (c) | 7 |
| Q4 Total | 15 | |
| Q5 | (a) | 4 |
| Q5 | (b) | 8 |
| Q5 | (c) | 3 |
| Q5 Total | 15 | |
| Grand Total | 63 |
Note: Total marks = 63. Section A = 33 marks, Section B = 30 marks.
Free quiz and exam paper access
Enter your details to view this paper
Your access is remembered on this device.