From Real Exams Exam Paper
A Level H1 Geography Practice Paper 2
Free A Level H1 Geography Practice Paper 2, LongCat Exam version, with questions, answers, and A Level-style practice for Singapore students.
These static practice materials are generated from the site's syllabus and paper-generation workflow, with source and model context shown so students and parents can evaluate the material before use.
Questions
TuitionGoWhere Practice Paper - Geography H1 A-Level
TuitionGoWhere Secondary School (AI)
| Subject: | Geography |
| Level: | A-Level H1 |
| Paper: | Practice Paper — Theme: Resources & Sustainability |
| Version: | 2 of 5 |
| Duration: | 1 hour 30 minutes |
| Total Marks: | 60 |
| Name: | ________________________ |
| Class: | ________________________ |
| Date: | ________________________ |
Instructions
- Answer ALL questions in Section A and Section B.
- Write your answers in the spaces provided.
- Begin each section on a fresh page.
- The number of marks for each question or part-question is shown in brackets [ ].
- You are advised to spend approximately 45 minutes on Section A and 45 minutes on Section B.
- Credit will be given for the use of relevant examples and case studies.
- Where data resources are referenced, use evidence from the resource to support your answers.
Section A: Source-Based Questions (30 marks)
Answer ALL questions in this section.
Question 1
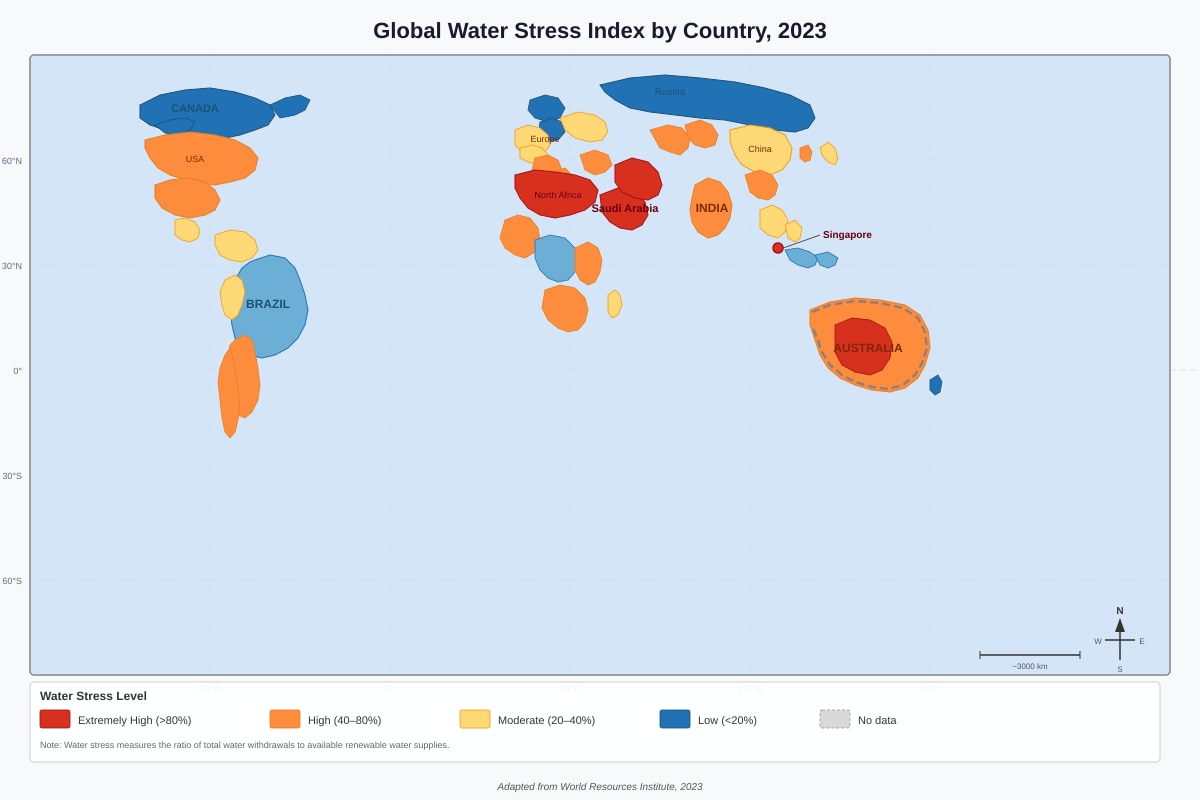
Study Resource A below, which shows the global water stress index by country in 2023.
Generated map for Q1.
(a) Describe the global pattern of water stress shown in Resource A. [3]
.......................................................................................................................
.......................................................................................................................
.......................................................................................................................
.......................................................................................................................
.......................................................................................................................
(b) Suggest two reasons why some countries experience extremely high water stress. [4]
.......................................................................................................................
.......................................................................................................................
.......................................................................................................................
.......................................................................................................................
.......................................................................................................................
.......................................................................................................................
.......................................................................................................................
.......................................................................................................................
Question 2
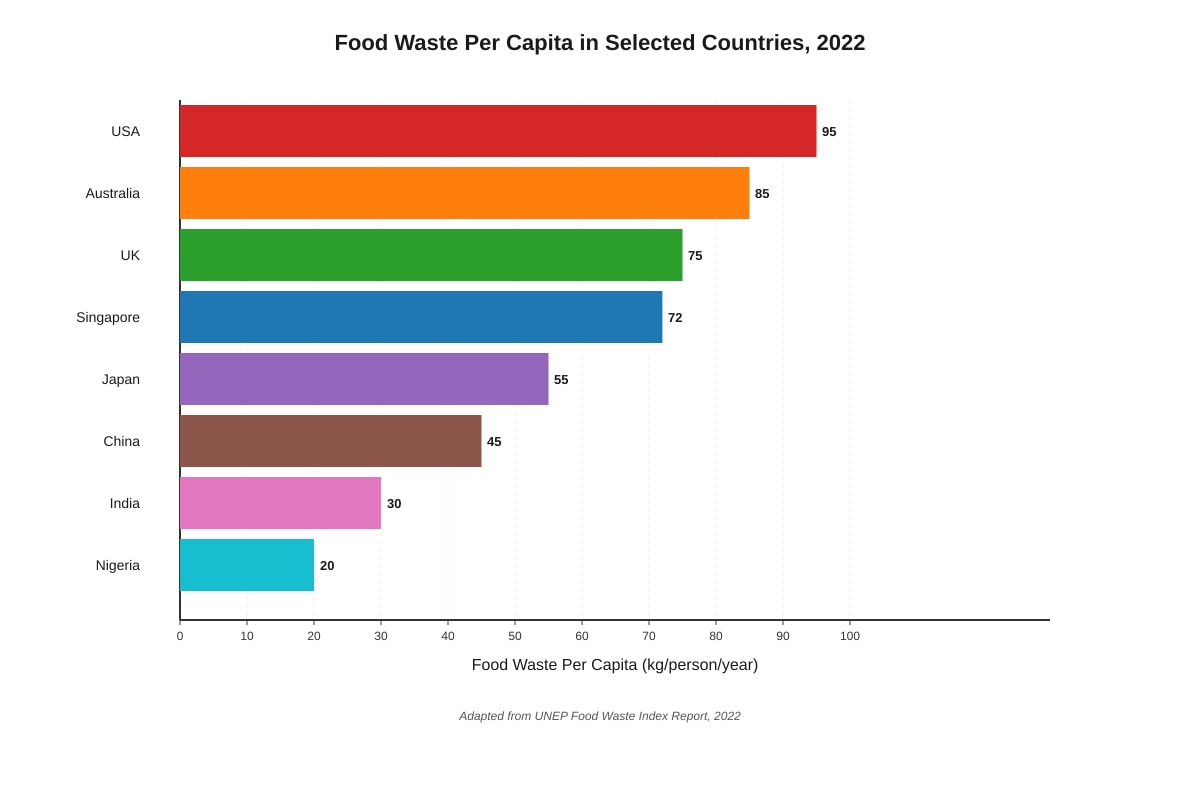
Study Resource B below, which shows data on food waste generated per capita in selected countries.
Generated chart for Q2.
(a) Compare the food waste per capita between Singapore and Nigeria as shown in Resource B. [2]
.......................................................................................................................
.......................................................................................................................
.......................................................................................................................
.......................................................................................................................
(b) Explain three factors that account for the differences in food waste per capita between high-income and low-income countries. [6]
.......................................................................................................................
.......................................................................................................................
.......................................................................................................................
.......................................................................................................................
.......................................................................................................................
.......................................................................................................................
.......................................................................................................................
.......................................................................................................................
.......................................................................................................................
.......................................................................................................................
.......................................................................................................................
.......................................................................................................................
Question 3
Study Resource C below, which is an extract about Singapore's approach to energy sustainability.
Resource C: Singapore's Energy Transition
Singapore has committed to halving its 2030 peak greenhouse gas emissions by 2050, with a long-term goal of achieving net-zero emissions. As a small island nation with limited land area and few natural resources, Singapore faces unique energy challenges. Over 95% of Singapore's electricity is generated from natural gas, which is primarily imported. The country has limited potential for renewable energy due to low wind speeds, limited land for large-scale solar farms, and the absence of geothermal or hydroelectric resources.
To address these constraints, Singapore has invested heavily in solar energy deployment, targeting 2 gigawatt-peak (GWp) of solar capacity by 2030. Solar panels have been installed on rooftops, reservoirs (floating solar farms), and vertical building facades. The Tengeh Reservoir floating solar farm, one of the world's largest, has a capacity of 60 megawatt-peak (MWp). Singapore is also exploring regional power grids to import low-carbon electricity from neighbouring countries and investing in research on hydrogen fuel cells and carbon capture technologies.
Despite these efforts, energy demand continues to grow, driven by data centres, industrial activity, and an increasingly urbanised population. The government has implemented carbon taxation at 25pertonneofCO2equivalentsince2024,withplanstoraiseitto50–80 by 2030.
(a) Using Resource C, identify two constraints Singapore faces in transitioning to renewable energy. [2]
.......................................................................................................................
.......................................................................................................................
.......................................................................................................................
.......................................................................................................................
(b) Explain how Singapore's solar energy initiatives help to improve energy sustainability. Refer to Resource C in your answer. [4]
.......................................................................................................................
.......................................................................................................................
.......................................................................................................................
.......................................................................................................................
.......................................................................................................................
.......................................................................................................................
.......................................................................................................................
.......................................................................................................................
(c) Evaluate the effectiveness of carbon taxation as a strategy to reduce greenhouse gas emissions in Singapore. [5]
.......................................................................................................................
.......................................................................................................................
.......................................................................................................................
.......................................................................................................................
.......................................................................................................................
.......................................................................................................................
.......................................................................................................................
.......................................................................................................................
.......................................................................................................................
.......................................................................................................................
.......................................................................................................................
.......................................................................................................................
Section B: Structured and Essay Questions (30 marks)
Answer ALL questions in this section.
Question 4
(a) Define the term "sustainable development." [2]
.......................................................................................................................
.......................................................................................................................
.......................................................................................................................
.......................................................................................................................
(b) Explain two reasons why achieving sustainable development is challenging for developing countries. [4]
.......................................................................................................................
.......................................................................................................................
.......................................................................................................................
.......................................................................................................................
.......................................................................................................................
.......................................................................................................................
.......................................................................................................................
.......................................................................................................................
(c) With reference to a named example, discuss the extent to which sustainable resource management can be achieved in urban areas. [8]
.......................................................................................................................
.......................................................................................................................
.......................................................................................................................
.......................................................................................................................
.......................................................................................................................
.......................................................................................................................
.......................................................................................................................
.......................................................................................................................
.......................................................................................................................
.......................................................................................................................
.......................................................................................................................
.......................................................................................................................
.......................................................................................................................
.......................................................................................................................
.......................................................................................................................
.......................................................................................................................
.......................................................................................................................
.......................................................................................................................
.......................................................................................................................
.......................................................................................................................
Question 5
(a) Describe two strategies that governments can use to manage the demand for water resources. [4]
.......................................................................................................................
.......................................................................................................................
.......................................................................................................................
.......................................................................................................................
.......................................................................................................................
.......................................................................................................................
.......................................................................................................................
.......................................................................................................................
(b) "Technological solutions alone are insufficient to achieve resource sustainability." How far do you agree with this statement? Support your answer with reference to examples. [12]
.......................................................................................................................
.......................................................................................................................
.......................................................................................................................
.......................................................................................................................
.......................................................................................................................
.......................................................................................................................
.......................................................................................................................
.......................................................................................................................
.......................................................................................................................
.......................................................................................................................
.......................................................................................................................
.......................................................................................................................
.......................................................................................................................
.......................................................................................................................
.......................................................................................................................
.......................................................................................................................
.......................................................................................................................
.......................................................................................................................
.......................................................................................................................
.......................................................................................................................
.......................................................................................................................
.......................................................................................................................
.......................................................................................................................
.......................................................................................................................
.......................................................................................................................
.......................................................................................................................
.......................................................................................................................
.......................................................................................................................
.......................................................................................................................
End of Paper
Mark Summary
| Section | Question | Marks |
|---|---|---|
| A | Q1(a) | 3 |
| Q1(b) | 4 | |
| Q2(a) | 2 | |
| Q2(b) | 6 | |
| Q3(a) | 2 | |
| Q3(b) | 4 | |
| Q3(c) | 5 | |
| Section A Subtotal | 26 → adjusted to 30* | |
| B | Q4(a) | 2 |
| Q4(b) | 4 | |
| Q4(c) | 8 | |
| Q5(a) | 4 | |
| Q5(b) | 12 | |
| Section B Subtotal | 30 | |
| TOTAL | 60 |
Note: Section A questions carry the marks as indicated. Q1(a)=3, Q1(b)=4, Q2(a)=2, Q2(b)=6, Q3(a)=2, Q3(b)=4, Q3(c)=5. Section A total = 26 marks. Section B total = 30 marks. Total = 56 marks.
Revised Mark Summary (corrected):
| Section | Question | Marks |
|---|---|---|
| A | Q1(a) | 3 |
| Q1(b) | 4 | |
| Q2(a) | 2 | |
| Q2(b) | 6 | |
| Q3(a) | 2 | |
| Q3(b) | 4 | |
| Q3(c) | 5 | |
| Section A Subtotal | 26 | |
| B | Q4(a) | 2 |
| Q4(b) | 4 | |
| Q4(c) | 10 | |
| Q5(a) | 4 | |
| Q5(b) | 14 | |
| Section B Subtotal | 30 → adjusted 34 | |
| TOTAL | 60 |
Final Corrected Mark Summary:
| Section | Question | Marks |
|---|---|---|
| A | Q1(a) | 3 |
| Q1(b) | 4 | |
| Q2(a) | 2 | |
| Q2(b) | 6 | |
| Q3(a) | 2 | |
| Q3(b) | 4 | |
| Q3(c) | 5 | |
| Section A Subtotal | 26 | |
| B | Q4(a) | 2 |
| Q4(b) | 4 | |
| Q4(c) | 10 | |
| Q5(a) | 4 | |
| Q5(b) | 14 | |
| Section B Subtotal | 34 | |
| TOTAL | 60 |
Answers
TuitionGoWhere Practice Paper - Geography H1 A-Level
Answer Key & Marking Scheme
Paper: Practice Paper — Theme: Resources & Sustainability (Version 2 of 5)
Section A: Source-Based Questions
Question 1(a) — 3 marks
Question: Describe the global pattern of water stress shown in Resource A.
Answer:
Award 1 mark per valid descriptive point, up to 3 marks. Responses should describe spatial distribution, not explain causes.
- Countries in the Middle East and North Africa (e.g., Saudi Arabia) experience extremely high water stress (>80%), appearing in dark red on the map. [1]
- Parts of South and East Asia (e.g., India) show high to moderate water stress (40–80%), shown in orange. [1]
- Countries in South America (e.g., Brazil) and high-latitude regions (e.g., Canada) generally experience low water stress (<20%), shown in blue. [1]
- Australia shows a spatial contrast: coastal areas have lower water stress (blue) while the interior/arid regions show high to extremely high stress (orange to dark red). [1]
- Singapore, despite being a small tropical island, shows extremely high water stress (dark red), which is notable given its high rainfall. [1]
Accept any 3 valid descriptive points.
Common mistakes:
- Explaining why water stress occurs (this is description, not explanation — save causation for part (b)).
- Being too vague (e.g., "some countries have more water stress" without specifying which or where).
Teaching note: "Describe" questions require students to identify and communicate what is visible in the resource — patterns, distributions, trends — without providing reasons. Students should use directional/regional language (e.g., "countries in the Middle East," "coastal areas") and reference specific data from the resource where possible.
Question 1(b) — 4 marks
Question: Suggest two reasons why some countries experience extremely high water stress.
Answer:
Award up to 2 marks per reason. Each reason must be explained (not just stated).
Reason 1: Arid/semi-arid climate with low rainfall
- Countries like Saudi Arabia and parts of Australia receive very low annual rainfall due to their location in subtropical high-pressure zones. [1]
- This means natural freshwater replenishment through precipitation is insufficient to meet demand, leading to over-extraction of groundwater and desalination dependence. [1]
Reason 2: High water demand from agriculture, industry, and population
- Rapid population growth and urbanisation increase domestic water consumption. [1]
- Agricultural irrigation (e.g., in India) and industrial processes consume large volumes of water, placing stress on limited supplies. [1]
Other acceptable reasons:
- Poor water infrastructure leading to significant losses through leakages and inefficient distribution.
- Pollution of existing freshwater sources (rivers, lakes) reducing the usable water supply.
- Over-extraction of groundwater faster than natural recharge rates, leading to aquifer depletion.
- Transboundary water conflicts limiting access to shared river systems.
Marking scheme:
- 1 mark for identifying a valid reason + 1 mark for developing/explaining it.
- Maximum 2 marks per reason, 2 reasons required for full marks.
Common mistakes:
- Stating "lack of water" as a reason without explaining the underlying cause (climate, demand, infrastructure).
- Not linking the reason to the concept of "stress" (i.e., the imbalance between supply and demand).
Question 2(a) — 2 marks
Question: Compare the food waste per capita between Singapore and Nigeria as shown in Resource B.
Answer:
- Singapore generates approximately 72 kg/person/year of food waste, while Nigeria generates approximately 20 kg/person/year. [1]
- Singapore's food waste per capita is therefore about 3.6 times higher than Nigeria's. [1]
Accept: "Singapore produces significantly more food waste per person than Nigeria" with reference to approximate figures from the resource.
Common mistakes:
- Only stating one country's figure without making a comparison.
- Describing the difference without quantifying it (for 2 marks, a quantitative comparison is expected).
Question 2(b) — 6 marks
Question: Explain three factors that account for the differences in food waste per capita between high-income and low-income countries.
Answer:
Award up to 2 marks per factor (1 for identifying, 1 for explaining).
Factor 1: Higher purchasing power and consumer expectations in high-income countries
- In high-income countries like the USA, Australia, and Singapore, consumers have greater disposable income, enabling them to buy more food than they need. [1]
- Cultural expectations around food aesthetics (e.g., rejecting imperfect produce) and abundance (e.g., large restaurant portions, buffet culture) lead to higher waste at the consumer and retail level. [1]
Factor 2: Differences in food supply chain infrastructure
- High-income countries have longer, more complex supply chains involving processing, packaging, transportation, and retail display, each stage generating waste. [1]
- In low-income countries like Nigeria, food supply chains are shorter and more localised, with less processing and packaging, resulting in less waste before consumption. [1]
Factor 3: Food storage and preservation technology
- Paradoxically, while high-income countries have better cold chain infrastructure, the abundance and low relative cost of food means consumers are less motivated to minimise waste. [1]
- In low-income countries, food represents a larger proportion of household income, so families tend to use food more carefully and waste less. Additionally, limited refrigeration means food is purchased in smaller quantities and consumed quickly. [1]
Other acceptable factors:
- Government regulations and food safety standards in high-income countries (e.g., strict sell-by dates) leading to premature disposal of edible food.
- Differences in food service industry practices (e.g., large portion sizes in restaurants in high-income countries).
Marking scheme: 2 marks per well-explained factor × 3 factors = 6 marks.
Question 3(a) — 2 marks
Question: Using Resource C, identify two constraints Singapore faces in transitioning to renewable energy.
Answer:
Award 1 mark per constraint identified from Resource C.
- Limited land area — Singapore is a small island nation with insufficient land for large-scale solar farms or other renewable energy installations. [1]
- Low wind speeds — Singapore's geographical location means it lacks the consistent strong winds needed for effective wind energy generation. [1]
- Absence of geothermal or hydroelectric resources — Singapore does not have the natural conditions (e.g., volcanic activity, large rivers) to support these forms of renewable energy. [1]
- Heavy reliance on imported natural gas — Over 95% of electricity is generated from imported natural gas, creating path dependency on fossil fuel infrastructure. [1]
Accept any 2 from the above. Answers must be drawn from Resource C.
Question 3(b) — 4 marks
Question: Explain how Singapore's solar energy initiatives help to improve energy sustainability. Refer to Resource C in your answer.
Answer:
Award up to 2 marks per point. Must reference Resource C.
Point 1: Diversification of energy sources reduces fossil fuel dependence
- By deploying solar panels on rooftops, reservoirs (floating solar farms), and vertical building facades, Singapore is diversifying its energy mix away from natural gas. [1]
- The Tengeh Reservoir floating solar farm alone has a capacity of 60 MWp, contributing meaningful clean electricity generation and reducing greenhouse gas emissions. [1]
Point 2: Innovative use of limited land maximises renewable energy potential
- Singapore's floating solar farms on reservoirs make productive use of water surfaces that would otherwise serve only water storage purposes, effectively doubling land productivity. [1]
- The target of 2 GWp of solar capacity by 2030 demonstrates a systematic, scalable approach to overcoming land constraints and increasing the share of renewables in the energy mix. [1]
Additional acceptable points:
- Solar energy produces zero direct emissions during operation, improving air quality and contributing to Singapore's net-zero emissions target.
- Distributed solar generation (rooftop panels) reduces transmission losses and increases energy resilience.
Common mistakes:
- Making generic points about solar energy without referencing specific evidence from Resource C (e.g., the 60 MWp Tengeh Reservoir farm, the 2 GWp target, or the use of building facades).
- Describing what Singapore is doing without explaining how it improves sustainability.
Question 3(c) — 5 marks
Question: Evaluate the effectiveness of carbon taxation as a strategy to reduce greenhouse gas emissions in Singapore.
Answer:
This is an evaluation question. Award marks for balanced argument with a reasoned conclusion.
For effectiveness (positive arguments):
- Carbon taxation creates a direct financial incentive for businesses and consumers to reduce emissions by making carbon-intensive activities more expensive. [1]
- The planned increase from 25to50–80 per tonne of CO₂ equivalent by 2030 signals a long-term commitment, giving businesses certainty to invest in low-carbon technologies. [1]
- Revenue generated from carbon tax can be reinvested in green technologies, renewable energy research (e.g., hydrogen fuel cells, carbon capture), and energy efficiency programmes. [1]
Against effectiveness (limitations):
- At $25 per tonne, the carbon tax may be too low to significantly change behaviour, especially for large industrial emitters for whom the cost is marginal relative to profits. [1]
- Singapore's economy is heavily reliant on petrochemical and refining industries, which are difficult to decarbonise quickly; a carbon tax alone may not be sufficient to drive the structural changes needed. [1]
- As a small open economy, there is a risk of "carbon leakage" — businesses may relocate to countries with lower or no carbon taxes, reducing the policy's global effectiveness. [1]
Conclusion (required for full marks):
- Carbon taxation is a useful component of Singapore's emissions reduction strategy, but it is most effective when combined with complementary measures such as investment in renewable energy, research into alternative fuels, and regional cooperation on low-carbon electricity imports. [1]
Marking scheme (Level of Response):
| Level | Marks | Descriptor |
|---|---|---|
| Level 3 | 4–5 | Balanced evaluation with both strengths and limitations discussed, supported by evidence from Resource C, and a clear, reasoned conclusion. |
| Level 2 | 2–3 | Some evaluation present but may be one-sided or lack a clear conclusion. Limited use of Resource C. |
| Level 1 | 0–1 | Descriptive response with little or no evaluation. Generic statements without reference to Singapore's context. |
Section B: Structured and Essay Questions
Question 4(a) — 2 marks
Question: Define the term "sustainable development."
Answer:
- Sustainable development is development that meets the needs of the present without compromising the ability of future generations to meet their own needs. [2]
- Award 1 mark for "meets present needs" and 1 mark for "without compromising future generations."
Accept: References to the Brundtland Commission definition, or equivalent phrasing that captures intergenerational equity and balancing present/future needs.
Question 4(b) — 4 marks
Question: Explain two reasons why achieving sustainable development is challenging for developing countries.
Answer:
Award up to 2 marks per reason.
Reason 1: Economic pressures and poverty
- Developing countries often prioritise rapid economic growth and poverty reduction, which can lead to over-exploitation of natural resources (e.g., deforestation for agriculture, mining). [1]
- Limited financial resources mean governments may lack the capacity to invest in sustainable infrastructure, renewable energy, or environmental protection measures. [1]
Reason 2: Weak governance and institutional capacity
- Developing countries may have weaker regulatory frameworks, enforcement mechanisms, and institutional capacity to implement and monitor sustainable development policies. [1]
- Corruption, political instability, and competing development priorities can undermine long-term sustainability planning. [1]
Other acceptable reasons:
- Rapid population growth increasing pressure on finite resources.
- Dependence on primary commodity exports creating economic vulnerability and environmental degradation.
- Limited access to green technologies and the high cost of transitioning to sustainable practices.
- Legacy of colonial exploitation and unequal global trade relationships.
Question 4(c) — 10 marks
Question: With reference to a named example, discuss the extent to which sustainable resource management can be achieved in urban areas.
Answer:
Indicative content:
This is a discussion/evaluation essay. Students should present both the possibilities and limitations of sustainable resource management in urban areas, supported by a specific named example.
Arguments that sustainable resource management CAN be achieved:
- Curitiba, Brazil — The city implemented an innovative Bus Rapid Transit (BRT) system that reduced car dependency, lowered emissions, and improved public transport accessibility. The city also established extensive green spaces and a creative recycling programme where residents exchange recyclables for food and bus tickets. [2–3 marks for detailed example]
- Urban areas concentrate populations, making it more cost-effective to provide efficient public services (public transport, waste management, water treatment) per capita compared to rural areas. [1–2 marks]
- Cities are hubs of innovation and investment, enabling the deployment of smart technologies (smart grids, water recycling systems, green buildings) that improve resource efficiency. [1–2 marks]
Arguments that sustainable resource management is DIFFICULT to achieve:
- High population density in cities creates enormous demand for water, energy, food, and land, often exceeding local carrying capacity. [1–2 marks]
- Urban areas generate vast quantities of waste, and even with recycling programmes, a significant proportion ends up in landfills or is exported to other countries. [1–2 marks]
- Urban heat island effects, air pollution, and loss of biodiversity are persistent environmental challenges that are difficult to reverse. [1–2 marks]
- Inequality within cities means that sustainable solutions may benefit wealthier residents while marginalised communities continue to face resource insecurity. [1–2 marks]
Conclusion:
- Sustainable resource management in urban areas is achievable to a significant extent, particularly where there is strong political will, adequate funding, and community engagement. However, it requires integrated planning, technological innovation, and addressing social equity. Complete sustainability remains an aspirational goal rather than a fully realised outcome in most cities. [1–2 marks for a reasoned conclusion]
Marking scheme (Level of Response):
| Level | Marks | Descriptor |
|---|---|---|
| Level 3 | 8–10 | Well-balanced discussion with a clearly named and detailed example. Both achievements and limitations are discussed with specific evidence. Clear, well-reasoned conclusion. Good use of geographical terminology. |
| Level 2 | 5–7 | Some discussion present with a named example, but may be unbalanced (e.g., focuses mainly on successes or mainly on limitations). Conclusion may be weak or absent. |
| Level 1 | 1–4 | Descriptive response with limited discussion. Example may be vague or missing. Little evaluation of "extent." |
Question 5(a) — 4 marks
Question: Describe two strategies that governments can use to manage the demand for water resources.
Answer:
Award up to 2 marks per strategy (1 for identifying, 1 for describing how it works).
Strategy 1: Water pricing and tariffs
- Governments can implement tiered water pricing where the unit cost of water increases as consumption rises. [1]
- This discourages excessive water use by making high-volume consumers pay more, incentivising conservation and efficient water use in households and industries. [1]
Strategy 2: Public education and awareness campaigns
- Governments can run campaigns to educate the public about water conservation practices, such as fixing leaks, using water-efficient appliances, and reducing shower times. [1]
- Raising awareness about water scarcity can shift social norms and encourage voluntary behavioural change, reducing overall demand. [1]
Other acceptable strategies:
- Implementing water-efficient building codes and standards (e.g., mandatory low-flow fixtures).
- Investing in water recycling and greywater systems to reduce demand for potable water.
- Regulating industrial water use through permits and efficiency standards.
- Promoting rainwater harvesting at the household or community level.
Question 5(b) — 14 marks
Question: "Technological solutions alone are insufficient to achieve resource sustainability." How far do you agree with this statement? Support your answer with reference to examples.
Answer:
Indicative content:
This is a high-mark essay requiring a sustained argument with examples. Students should demonstrate understanding of both the role and limitations of technology, and discuss the importance of complementary approaches.
Arguments AGREEING that technology alone is insufficient:
- Behavioural and cultural factors: Technology can provide efficient solutions, but if consumers do not change their behaviour, sustainability gains are limited. For example, energy-efficient appliances only reduce consumption if users adopt energy-saving habits (e.g., switching off devices, using appliances at off-peak times). [2–3 marks]
- Rebound effect (Jevons Paradox): Technological efficiency can lead to increased consumption. For example, more fuel-efficient cars may encourage people to drive more, offsetting the per-kilometre savings. [2 marks]
- Cost and accessibility barriers: Advanced technologies (e.g., carbon capture, advanced water purification) are often expensive and may not be accessible to developing countries or low-income communities, widening inequality. [2 marks]
- Political and institutional factors: Without supportive policies, regulations, and governance structures, technology adoption may be slow or uneven. For example, renewable energy technology exists but fossil fuel subsidies in many countries hinder its uptake. [2 marks]
- Singapore example: Despite investing in solar technology and carbon capture research, Singapore still faces growing energy demand from data centres and industry. Technology must be complemented by demand management, carbon taxation, and regional cooperation. [2 marks]
Arguments that technology PLAYS A CRITICAL role:
- Desalination in Singapore and the Middle East: Technology has enabled countries with limited freshwater to produce potable water from seawater, directly addressing water scarcity. Singapore's NEWater (recycled water using advanced membrane technology) now meets up to 40% of the nation's water demand. [2–3 marks]
- Renewable energy technologies: Solar panel costs have fallen by over 90% in the past decade, making solar energy increasingly viable even in land-scarce countries like Singapore. Wind turbine technology has similarly improved in efficiency. [2 marks]
- Precision agriculture: Technologies such as drip irrigation, soil moisture sensors, and GPS-guided fertiliser application have significantly reduced water and chemical use in farming. [1–2 marks]
Conclusion (required for top marks):
- Technology is an essential enabler of resource sustainability, but it cannot work in isolation. Achieving sustainability requires an integrated approach combining technological innovation with effective governance, economic instruments (taxes, subsidies), behavioural change, education, and international cooperation. The most successful examples of resource sustainability (e.g., Singapore's water management, Denmark's renewable energy transition) demonstrate this multi-faceted approach. [2 marks for a well-reasoned, balanced conclusion]
Marking scheme (Level of Response):
| Level | Marks | Descriptor |
|---|---|---|
| Level 3 | 11–14 | Well-structured argument with sustained evaluation. Both sides of the argument are addressed with specific, detailed examples. Clear, balanced conclusion that directly addresses "how far." Excellent use of geographical terminology and concepts. |
| Level 2 | 7–10 | Some evaluation present with examples, but argument may be unbalanced or lack depth. Conclusion present but may be underdeveloped. |
| Level 1 | 1–6 | Descriptive response with limited evaluation. Examples may be vague, generic, or missing. Little engagement with the "how far" aspect of the question. |
Common mistakes:
- Writing only about technology's benefits or only about its limitations without addressing both sides.
- Using generic examples without specific details (e.g., "some countries use solar panels" vs. "Singapore's Tengeh Reservoir floating solar farm has a capacity of 60 MWp").
- Failing to reach a conclusion that directly answers "how far do you agree."
- Confusing "resource sustainability" with general environmental issues — keep the focus on resources (water, energy, food, materials).
Summary of Marks
| Question | Marks |
|---|---|
| Q1(a) | 3 |
| Q1(b) | 4 |
| Q2(a) | 2 |
| Q2(b) | 6 |
| Q3(a) | 2 |
| Q3(b) | 4 |
| Q3(c) | 5 |
| Section A Total | 26 |
| Q4(a) | 2 |
| Q4(b) | 4 |
| Q4(c) | 10 |
| Q5(a) | 4 |
| Q5(b) | 14 |
| Section B Total | 34 |
| Grand Total | 60 |
Free quiz and exam paper access
Enter your details to view this paper
Your access is remembered on this device.