From Real Exams Exam Paper
A Level H1 Geography Practice Paper 2
Free A Level H1 Geography Practice Paper 2, HY3 Exam version, with questions, answers, and A Level-style practice for Singapore students.
These static practice materials are generated from the site's syllabus and paper-generation workflow, with source and model context shown so students and parents can evaluate the material before use.
Questions
TuitionGoWhere Practice Paper - Geography H1 A-Level (Version 2)
School: TuitionGoWhere Exam Practice (AI)
Subject: Geography H1
Level: A-Level
Paper: Practice Paper (Cluster 1: Resources & Sustainability)
Duration: 75 minutes
Total Marks: 60
Name: ___________________________
Class: ___________________________
Date: ___________________________
Instructions:
- This practice paper contains 3 sections with a total of 20 questions focused on Resources & Sustainability.
- Answer all questions in the spaces provided.
- Use the resources, data, and extracts provided to support your answers where required.
- Marks for each question are shown in brackets [ ].
- Section totals and question marks add up exactly to 60 marks.
Section A: Data-Based Short Response (Questions 1–8) [24 marks]
1. Study the table below showing municipal solid waste (MSW) generation per capita in three cities at different development levels for 2015 and 2022.
| City | Development Level | MSW per capita 2015 (kg/day) | MSW per capita 2022 (kg/day) |
|---|---|---|---|
| City A | High-income | 1.9 | 2.1 |
| City B | Upper-middle | 0.8 | 1.3 |
| City C | Lower-middle | 0.4 | 0.7 |
Describe two trends in MSW generation shown in the table. [2]
2. Using the data in Q1, suggest one reason why City C's MSW per capita increased between 2015 and 2022. [1]
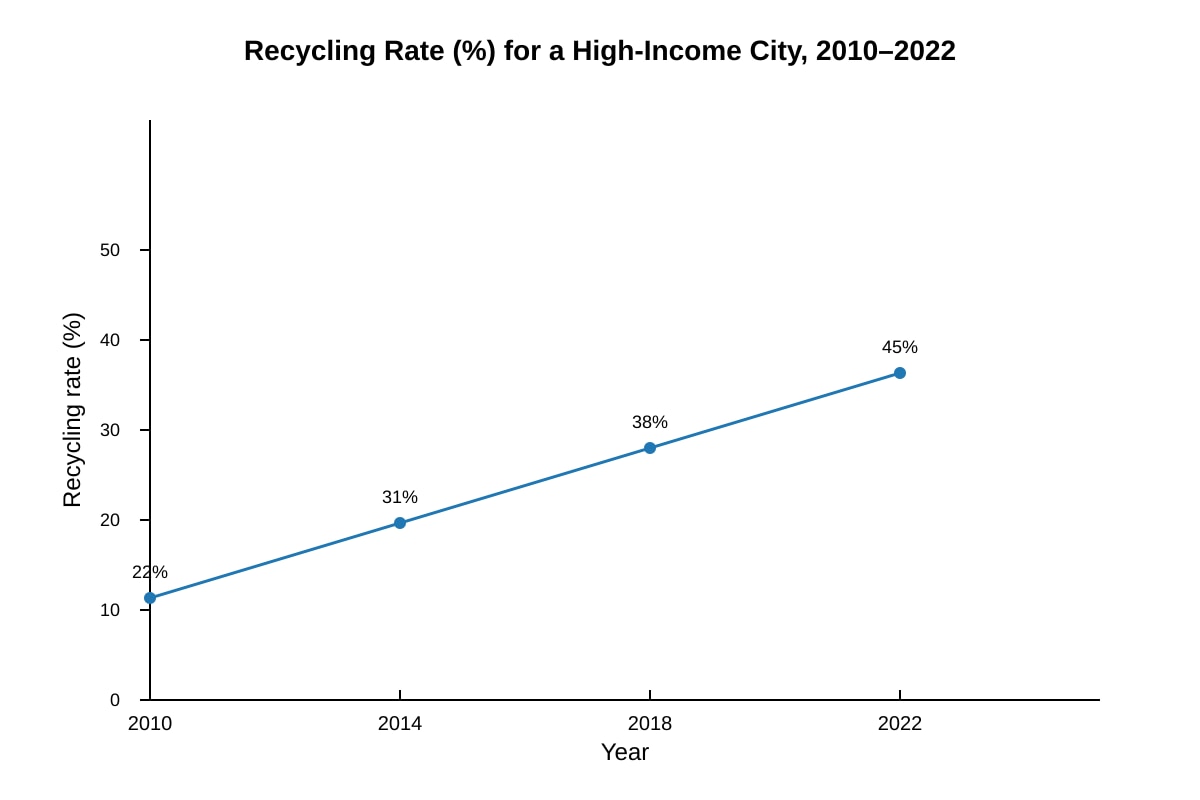
3.
Image pending generation: graph for Q3.
Based on Resource Q3-fig1, explain one factor that could account for the rise in recycling rate in the city. [2]
4. Define the term "sustainable development" as used in urban geography. [2]
5. Explain why effective waste management is important for sustainable urban development in lower-middle-income cities. [3]
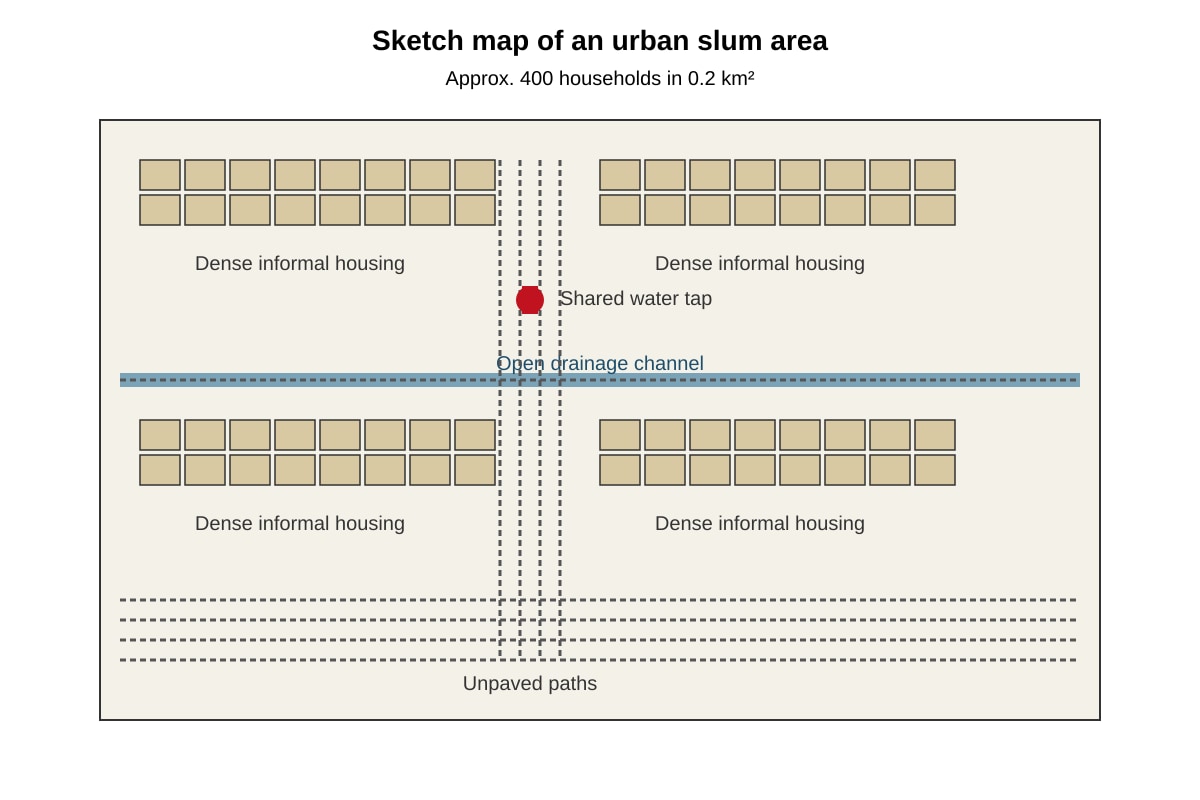
6.
Image pending generation: map for Q6.
Using Resource Q6-fig1, describe two characteristics of the slum settlement. [2]
7. Account for the development of slums in rapidly urbanising countries. [4]
8. Evaluate the usefulness of Resource Q6-fig1 in understanding the living conditions of slum dwellers. [4]
Section B: Structured Questions (Questions 9–14) [20 marks]
9. A group of 20 eighteen-year-old students from TuitionGoWhere JC wanted to examine community waste disposal habits in Taman Jurong, Singapore. They conducted face-to-face questionnaire surveys with 60 residents aged 50+.
(a) Suggest one reason why the students used face-to-face questionnaire surveys. [2]
(b) Identify one risk in this fieldwork and how to mitigate it. [2]
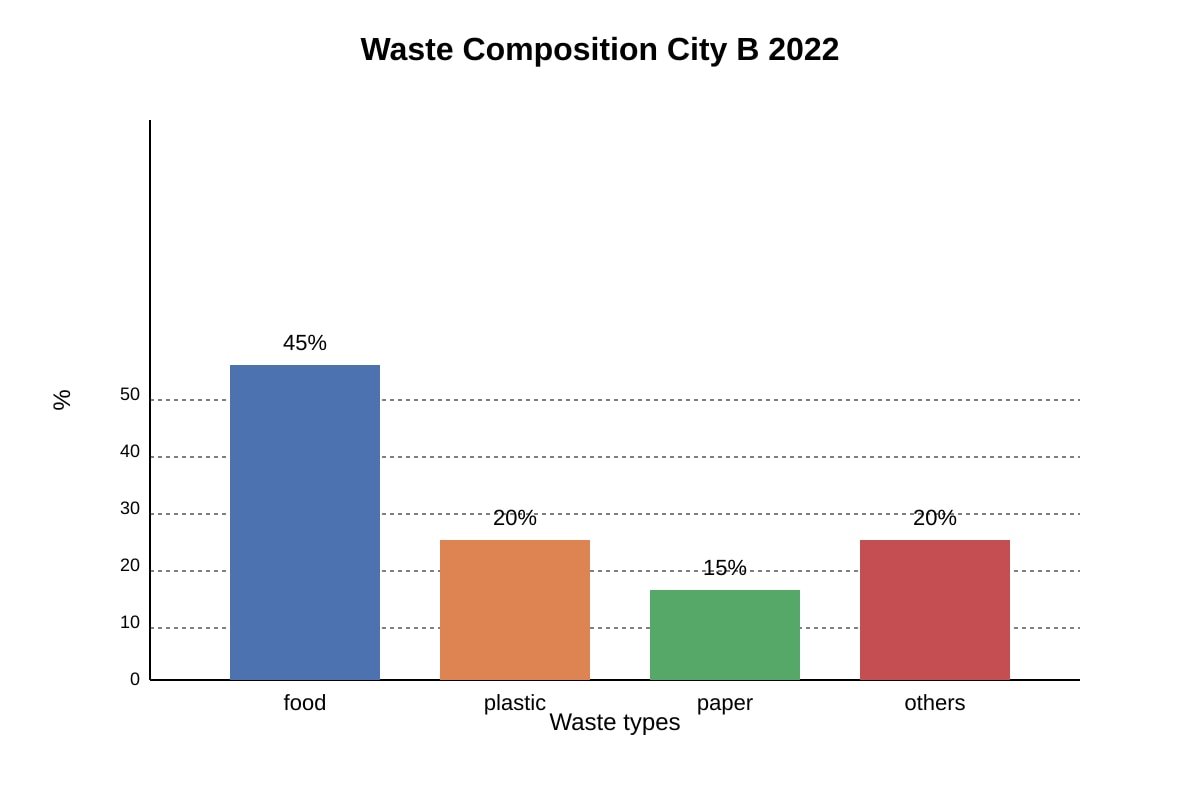
10.
Image pending generation: chart for Q10.
Using Resource Q10-fig1, account for the changes in service provision needed to manage food waste in City B. [4]
11. Explain the impact of multiple deprivations experienced by slum dwellers on sustainable urban development. [4]
12. Urban reimaging is used by cities to improve economic competitiveness. Discuss the tension between urban reimaging and sustainable development. [4]
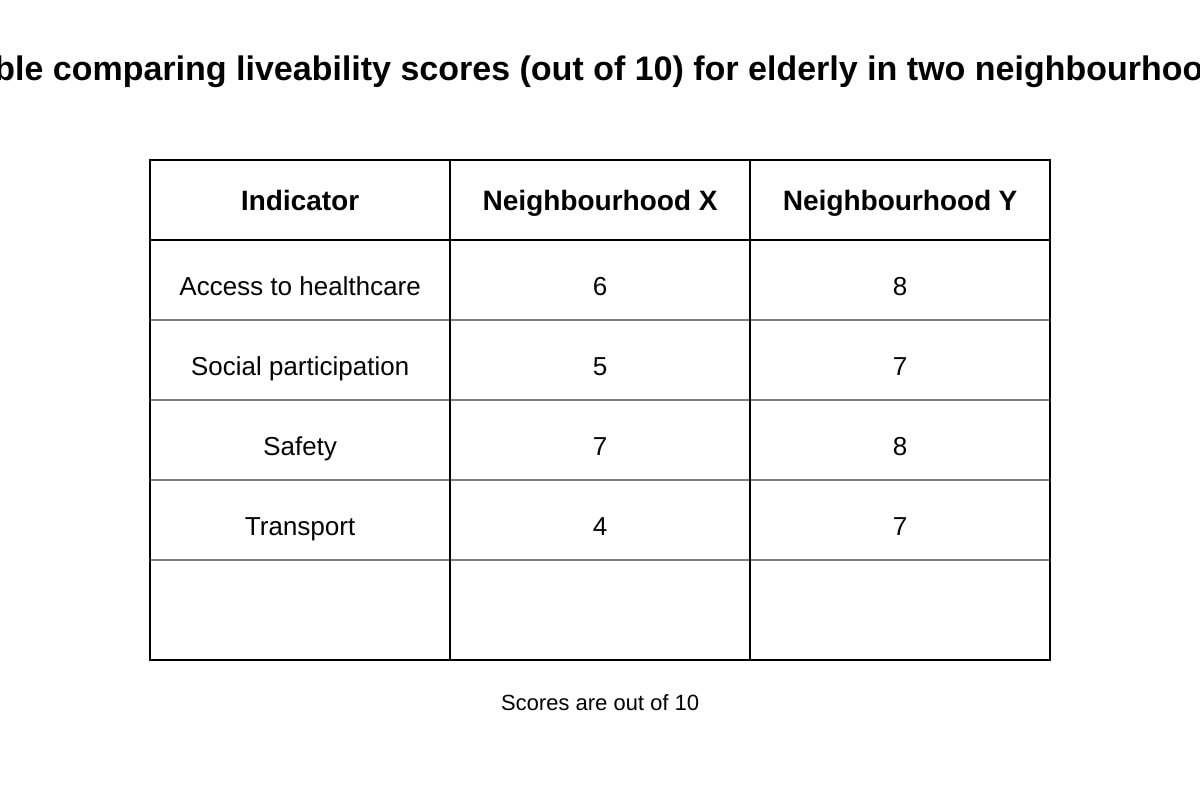
13.
Image pending generation: table for Q13.
Using Resource Q13-fig1, explain why Neighbourhood Y is more liveable for the elderly. [2]
14. Evaluate the usefulness of Resource Q13-fig1 and Q10-fig1 in understanding urban sustainability challenges in City B. [4]
Section C: Extended Response (Questions 15–20) [16 marks]
15. To what extent can waste-to-energy plants resolve the sustainability-living tension in high-density cities? [3]
16. Examine the relationship between gender equality and liveable cities with reference to resources sustainability. [3]
17. "Slum upgrading is always successful in achieving sustainable urban development." Assess this statement. [3]
18. Explain how urban reimaging can both support and undermine environmental sustainability. [2]
19. Evaluate the effectiveness of community-based recycling programmes in upper-middle-income cities. [3]
20. Discuss the complementarity between liveability and sustainable development in the context of ageing urban populations. [2]
Answers
Answer Key – TuitionGoWhere Practice Paper Geography H1 A-Level (Version 2)
Total Marks: 60
Topic: Resources & Sustainability
Section A (24 marks)
Q1 [2]
- Trend 1: MSW per capita rose in all three cities from 2015 to 2022. (1 mark)
- Trend 2: High-income city (A) has consistently higher MSW per capita than lower-middle city (C), showing development-level gap. (1 mark)
Teaching note: Read rows and compare years; avoid describing only one city.
Q2 [1]
- Rising income / consumption as city industrialises → more packaged goods and food waste. (1 mark)
Teaching note: Link economic growth to waste generation.
Q3 [2]
- Factor: Municipal recycling policy / incentives introduced (e.g., curbside separation) → rate rose 22% to 45%. (2 marks for explanation with resource link)
Expected visual: Upward line; student should cite 2010–2022 increase.
Q4 [2]
- Sustainable development = meeting present needs without compromising future generations' ability to meet theirs (Brundtland). In urban geography, balances economic, social, environmental. (2 marks)
Teaching note: Definition must include intergenerational equity.
Q5 [3]
- (1) Reduces health risks from open dumping; (2) Recovers resources, less landfill; (3) Supports SDG 11. (3 marks)
Marking: 1 mark per valid point.
Q6 [2]
- Char 1: High density (400 hh/0.2 km²). (1) Char 2: Poor sanitation (open drainage, shared tap). (1)
Visual: Map labels confirm.
Q7 [4]
- Rural–urban migration exceeds housing (1); lack of affordable housing (1); informal economy (1); weak planning (1).
Marking descriptors: 4 marks = 4 distinct causal factors.
Q8 [4]
- Useful: shows spatial layout, service deficit (2). Limited: no demographic data, small area not generalizable (2). Overall partially useful.
Marking: Strength (2) + limitation (2).
Section B (20 marks)
Q9 [4]
(a) [2] Face-to-face gives higher response from elderly, clarifies questions.
(b) [2] Risk: heat fatigue; Mitigate: survey early morning, water breaks.
Q10 [4]
- Food waste 45% → need composting / separate collection (2); current services inadequate (2). Use Q10-fig1 bar values.
Q11 [4]
- Deprivations: no sanitation → disease (1); insecure tenure → no investment (1); poverty → cannot move (1); weakens city sustainability (1).
Q12 [4]
- Reimaging attracts business (2) but may displace poor, raise emissions (2). Tension shown.
Q13 [2]
- Y scores higher in all 4 liveability aspects (healthcare 8 vs 6, etc.) → more liveable. (2)
Q14 [4]
- Q13 shows social aspect, Q10 shows waste composition (2); limited: no environmental link (2). Balanced judgment.
Section C (16 marks)
Q15 [3]
- Reduces landfill (1), provides energy (1), but emissions remain (1). Extent = partial.
Q16 [3]
- Gender equality improves resource access (1); women's needs in planning (1); example: sanitation (1).
Q17 [3]
- Not always: success in Chile (1), failure via gentrification (1), depends on governance (1).
Q18 [2]
- Supports: green spaces (1); undermines: construction emissions (1).
Q19 [3]
- Effective: raises awareness (1), lowers waste (1), but needs enforcement (1).
Q20 [2]
- Complement: elderly-friendly = social sustainability (1); green design helps both (1).
Free quiz and exam paper access
Enter your details to view this paper
Your access is remembered on this device.