From Real Exams Exam Paper
A Level H1 Geography Practice Paper 1
Free A Level H1 Geography Practice Paper 1, LongCat Exam version, with questions, answers, and A Level-style practice for Singapore students.
These static practice materials are generated from the site's syllabus and paper-generation workflow, with source and model context shown so students and parents can evaluate the material before use.
Questions
TuitionGoWhere Practice Paper - Geography H1 A-Level
TuitionGoWhere Secondary School (AI)
| Subject: | Geography |
| Level: | A-Level H1 |
| Paper: | Practice Paper 1 (of 5) |
| Topic Focus: | Resources & Sustainability |
| Duration: | 1 hour 45 minutes |
| Total Marks: | 60 |
| Name: | ________________________ |
| Class: | ________________________ |
| Date: | ________________________ |
Instructions to Candidates:
- Write your name, class, and date in the spaces provided above.
- Answer ALL questions in Section A and Section B.
- Write your answers in the spaces provided.
- Begin each section on a fresh page.
- The number of marks for each question or part-question is shown in brackets [ ].
- You are advised to spend approximately 45 minutes on Section A and 45 minutes on Section B.
- The total mark for this paper is 60.
Section A: Source-Based Questions (30 marks)
Answer ALL questions in this section.
Question 1
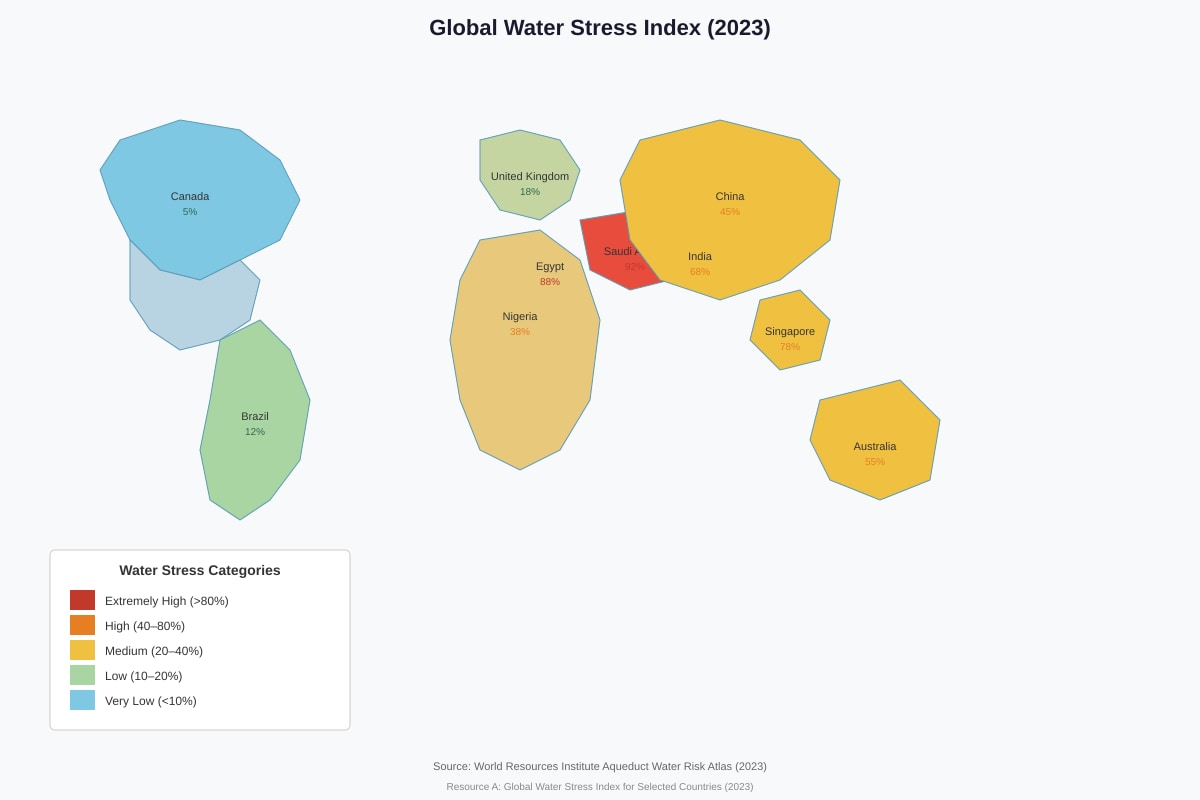
Refer to Resource A below, which shows the global water stress index for selected countries in 2023.
Generated map for Q1.
Resource A: Global Water Stress Index for Selected Countries (2023)
(a) Describe the pattern of water stress shown in Resource A. [3]
(b) Suggest two reasons why some countries experience extremely high water stress. [4]
Reason 1: _____________________________________________________________________
Reason 2: _____________________________________________________________________
(c) Explain how water stress can affect the sustainability of development in a country. [3]
Question 2
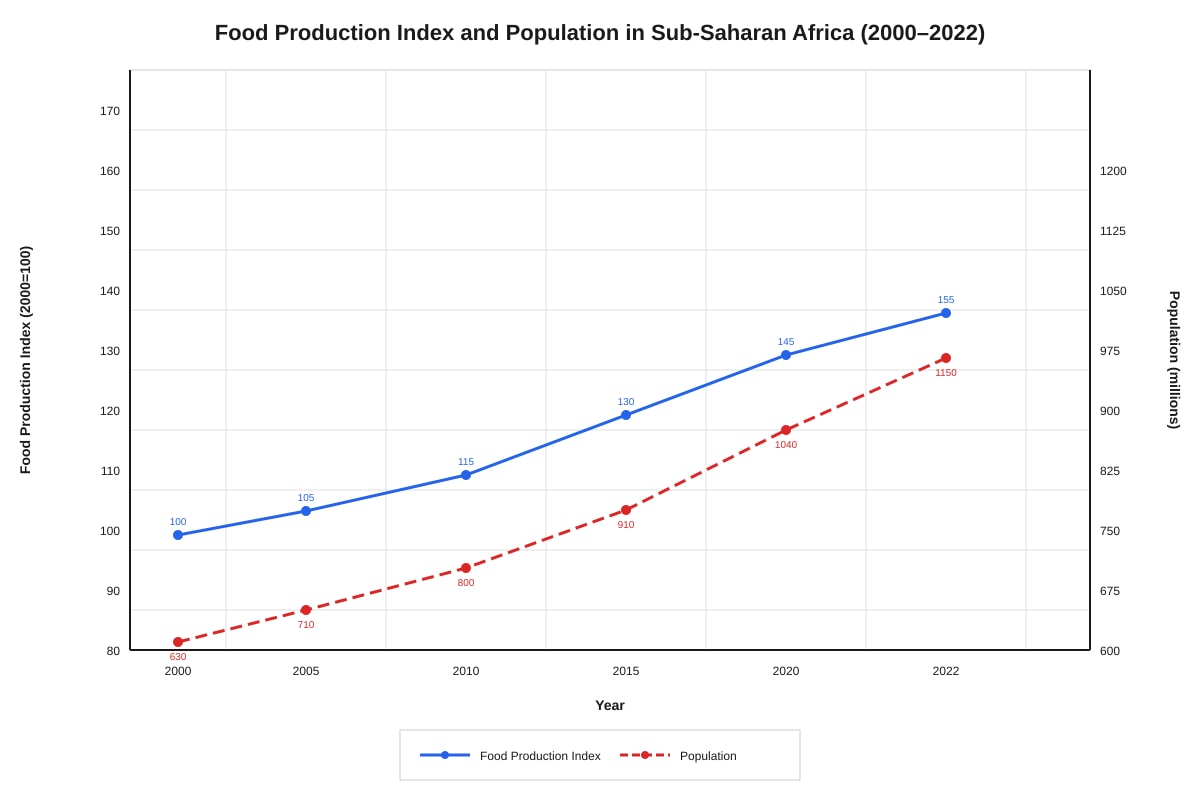
Study Resource B, which shows data on food production and population growth in Sub-Saharan Africa between 2000 and 2022.
Generated graph for Q2.
Resource B: Food Production Index and Population in Sub-Saharan Africa (2000–2022)
(a) State the relationship between food production and population growth as shown in Resource B. [2]
(b) Calculate the approximate percentage increase in food production index between 2000 and 2022. Show your working. [2]
(c) Despite the increase in food production, suggest why food insecurity remains a challenge in Sub-Saharan Africa. [4]
Question 3
Read Resource C, an extract about Singapore's approach to energy sustainability.
Resource C
Singapore has adopted a multi-pronged strategy to enhance energy sustainability given its limited land area and lack of natural resources. The country relies heavily on natural gas for electricity generation, which accounts for approximately 95% of its power supply. To diversify its energy mix, Singapore has invested heavily in solar energy, targeting 2 gigawatt-peak (GWp) of solar capacity by 2030. The SolarNova programme, a government-led initiative, has installed solar panels on public housing rooftops across the island. Additionally, Singapore is exploring regional power grids to import renewable energy from neighbouring countries and investing in low-carbon technologies such as hydrogen fuel cells and carbon capture. The government has also introduced a carbon tax, set at S25pertonneofCO2equivalentfrom2024,risingtoS50–80 by 2030, to incentivise industries to reduce emissions.
(a) Identify two strategies Singapore has adopted to enhance energy sustainability. [2]
Strategy 1: ____________________________________________________________________
Strategy 2: ____________________________________________________________________
(b) Explain how a carbon tax can encourage industries to reduce their carbon emissions. [3]
(c) Evaluate the effectiveness of Singapore's approach to achieving energy sustainability. [5]
Question 4
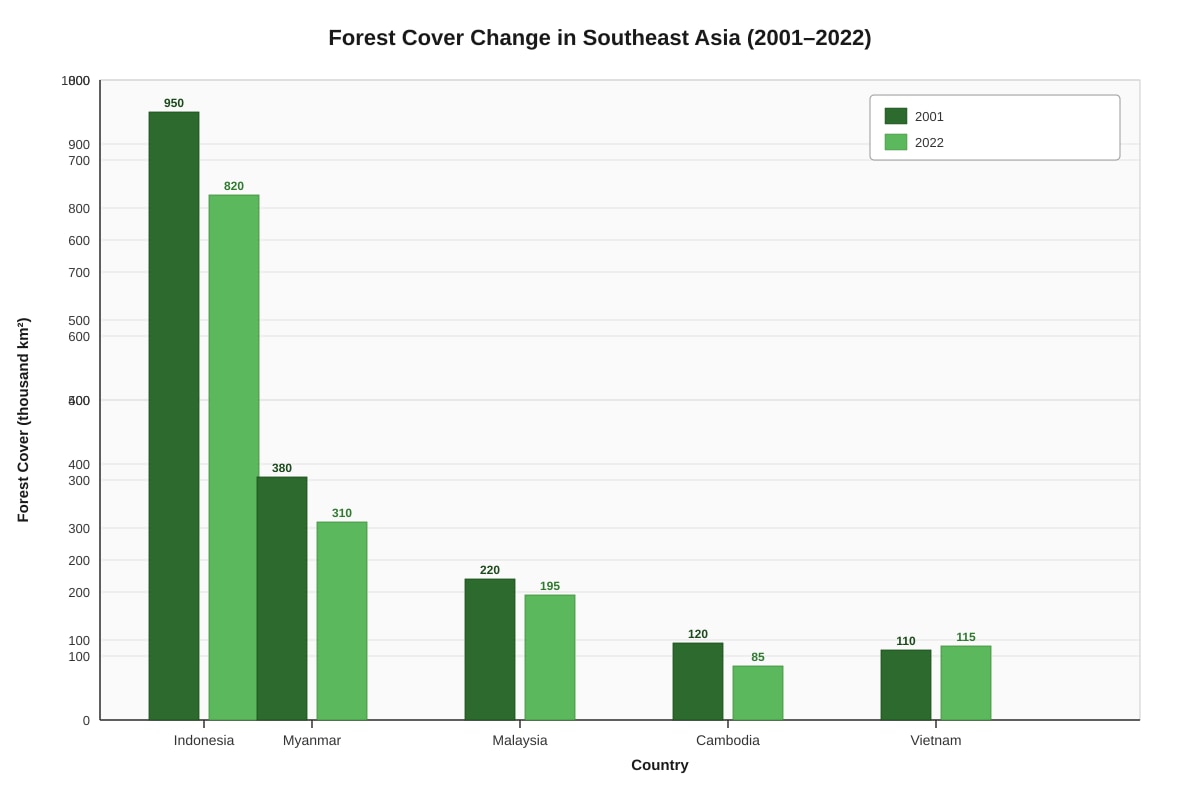
Study Resource D, which shows the change in forest cover in Southeast Asia between 2001 and 2022.
Generated chart for Q4.
Resource D: Forest Cover Change in Southeast Asia (2001–2022)
(a) Which country experienced the largest absolute decrease in forest cover between 2001 and 2022? [1]
(b) Calculate the percentage decrease in forest cover for Cambodia between 2001 and 2022. Show your working. [2]
(c) Account for the changes in forest cover shown in Resource D. [4]
Section B: Structured and Essay Questions (30 marks)
Answer ALL questions in this section.
Question 5
(a) Define the term sustainable development. [2]
(b) Explain three ways in which the over-extraction of groundwater can threaten resource sustainability. [6]
Way 1: _______________________________________________________________________
Way 2: _______________________________________________________________________
Way 3: _______________________________________________________________________
(c) "Technological solutions alone are insufficient to achieve resource sustainability." How far do you agree with this statement? [7]
Question 6
Read Resource E, an extract about the circular economy in the Netherlands.
Resource E
The Netherlands has emerged as a leading proponent of the circular economy in Europe. The Dutch government's "Netherlands Circular by 2050" strategy aims to halve the use of primary raw materials by 2030. Key initiatives include mandatory recycling targets for construction waste (90% by 2025), extended producer responsibility schemes for electronics and packaging, and subsidies for businesses adopting circular design principles. The city of Amsterdam has implemented a comprehensive materials passport system for buildings, documenting all materials used in construction to facilitate future reuse. Critics, however, argue that the transition is too slow, with the country's material footprint per capita still among the highest in the EU. Small and medium enterprises (SMEs) face financial barriers in adopting circular practices, and consumer behaviour remains oriented towards linear consumption patterns.
(a) Identify two circular economy initiatives mentioned in Resource E. [2]
Initiative 1: __________________________________________________________________
Initiative 2: __________________________________________________________________
(b) Using information from Resource E, explain the challenges the Netherlands faces in transitioning to a circular economy. [4]
(c) Discuss the extent to which a circular economy model is more sustainable than a traditional linear economy. [9]
End of Paper
Total Marks: 60
| Section | Marks |
|---|---|
| Section A (Questions 1–4) | 30 |
| Section B (Questions 5–6) | 30 |
| Total | 60 |
Answers
TuitionGoWhere Practice Paper - Geography H1 A-Level
Answer Key & Marking Scheme
Paper: Practice Paper 1 (of 5) | Topic: Resources & Sustainability | Total: 60 marks
Section A: Source-Based Questions (30 marks)
Question 1 (10 marks)
(a) Describe the pattern of water stress shown in Resource A. [3]
Answer:
- Countries in North Africa and the Middle East (e.g., Saudi Arabia at 92%, Egypt at 88%) experience extremely high water stress (>80%). [1]
- Parts of Asia show high to medium water stress — India (68%) and Singapore (78%) face high stress, while China (45%) experiences medium stress. [1]
- Countries in the Southern Hemisphere and higher latitudes generally experience lower water stress — Brazil (12%), the United Kingdom (18%), and Canada (5%) all have low stress levels. Australia (55%) is an exception with high stress despite its latitude. [1]
Marking Notes:
- Award 1 mark per valid descriptive point with reference to specific data from the resource.
- Maximum 2 marks if no specific country data or figures are referenced.
- Credit any valid regional grouping or anomaly identified.
(b) Suggest two reasons why some countries experience extremely high water stress. [4]
Answer:
Reason 1: Arid/semi-arid climate with low rainfall Countries like Saudi Arabia and Egypt are located in arid or semi-arid climate zones where annual precipitation is very low (often below 250 mm/year). This limits the natural replenishment of freshwater sources such as rivers, lakes, and aquifers, leading to chronic water scarcity. [2]
Reason 2: High water demand from agriculture, industry, and domestic use Rapid population growth and economic development increase water demand for irrigation, industrial processes, and domestic consumption. In countries like India and Singapore, the demand for water far exceeds the naturally available supply, resulting in over-extraction of groundwater and depletion of surface water sources. [2]
Marking Notes:
- Award up to 2 marks per reason: 1 mark for identifying the reason, 1 mark for developing/explaining it.
- Accept other valid reasons: e.g., pollution of freshwater sources reducing usable supply, poor water infrastructure leading to losses, climate change reducing rainfall reliability.
(c) Explain how water stress can affect the sustainability of development in a country. [3]
Answer:
- Water stress limits agricultural productivity, as irrigation becomes unreliable or too expensive, threatening food security and rural livelihoods. This undermines the ability to sustain economic growth and social well-being. [1]
- Industrial development is constrained because many manufacturing processes require significant water inputs. Water shortages can force factories to reduce output or relocate, reducing economic competitiveness. [1]
- Water stress can lead to social unrest and health crises, as communities compete for limited supplies. The cost of alternative water sources (e.g., desalination) diverts public funds from other development priorities, making long-term development less sustainable. [1]
Marking Notes:
- Award 1 mark per well-explained point linking water stress to a dimension of sustainability (economic, social, or environmental).
- Answers must go beyond stating "water is needed" — they must explain the consequence for sustainability.
Question 2 (8 marks)
(a) State the relationship between food production and population growth as shown in Resource B. [2]
Answer: Both food production and population increased between 2000 and 2022. [1] However, population grew at a faster rate than food production — population increased by approximately 82.5% while the food production index increased by only 55%, meaning per capita food production has not kept pace with population growth. [1]
Marking Notes:
- 1 mark for identifying both increased.
- 1 mark for noting that population grew faster than food production (or that per capita availability is under pressure).
(b) Calculate the approximate percentage increase in food production index between 2000 and 2022. Show your working. [2]
Answer:
Percentage increase=Initial valueFinal value−Initial value×100%
=100155−100×100%
=10055×100%
=55%[1 for correct working, 1 for correct answer]
Marking Notes:
- Award 1 mark for correct formula/method.
- Award 1 mark for correct final answer (55%).
- If the formula is wrong but the answer is 55%, award 1 mark only.
(c) Despite the increase in food production, suggest why food insecurity remains a challenge in Sub-Saharan Africa. [4]
Answer:
- Population growth has outpaced food production growth, meaning that per capita food availability has not improved significantly. More people must be fed from a relatively smaller increase in output. [1]
- Unequal distribution of food due to poor infrastructure (roads, storage facilities) means that food produced in surplus regions cannot reach deficit areas, leading to localised shortages and price spikes. [1]
- Climate variability, including droughts and floods, disrupts agricultural production and makes yields unpredictable, undermining consistent food supply even when the overall trend is upward. [1]
- Poverty and low incomes mean that even when food is available, many households cannot afford adequate nutrition. Economic access to food is as important as physical availability. [1]
Marking Notes:
- Award 1 mark per valid, well-explained reason.
- Answers must go beyond restating the data — they must explain the underlying causes of food insecurity.
Question 3 (10 marks)
(a) Identify two strategies Singapore has adopted to enhance energy sustainability. [2]
Answer:
- Strategy 1: Investing in solar energy through the SolarNova programme, targeting 2 GWp of solar capacity by 2030. [1]
- Strategy 2: Introducing a carbon tax (S25pertonneofCO2equivalentfrom2024,risingtoS50–80 by 2030) to incentivise emission reductions. [1]
Marking Notes:
- Award 1 mark per correct strategy identified from Resource E.
- Accept other valid strategies from the resource: exploring regional power grids, investing in hydrogen fuel cells/carbon capture.
(b) Explain how a carbon tax can encourage industries to reduce their carbon emissions. [3]
Answer:
- A carbon tax increases the cost of emitting CO₂, making it more expensive for industries to continue using fossil fuels. This creates a financial incentive for firms to switch to cleaner energy sources or adopt energy-efficient technologies to reduce their tax burden. [1]
- The rising tax rate (from S25toS50–80 by 2030) signals to industries that the cost of emissions will continue to increase over time, encouraging long-term investment in low-carbon infrastructure and research rather than short-term fixes. [1]
- Revenue generated from the carbon tax can be reinvested by the government into green technologies, subsidies for renewable energy, or public transport improvements, further supporting the transition to a low-carbon economy. [1]
Marking Notes:
- Award 1 mark per well-explained mechanism linking the carbon tax to emission reduction behaviour.
- Answers must explain the causal chain, not just state "it makes pollution expensive."
(c) Evaluate the effectiveness of Singapore's approach to achieving energy sustainability. [5]
Answer:
Effective aspects:
- Singapore's multi-pronged strategy addresses energy sustainability from multiple angles — diversifying energy sources (solar, regional grids), pricing carbon emissions, and investing in emerging technologies (hydrogen, carbon capture). This comprehensive approach is more robust than relying on a single solution. [1]
- The SolarNova programme is a practical use of available space (public housing rooftops) in a land-scarce country, demonstrating innovative adaptation to local constraints. The 2 GWp target is ambitious and measurable. [1]
- The carbon tax provides a clear market signal and is among the first in Southeast Asia, positioning Singapore as a regional leader in climate policy. [1]
Limitations:
- Singapore still relies on natural gas for ~95% of its electricity, meaning the fundamental energy mix remains carbon-intensive. Solar energy, even at 2 GWp, will only meet a small fraction of total demand given Singapore's limited land area. [1]
- The carbon tax rate (S$25–80) may be too low to drive significant behavioural change in energy-intensive industries, especially if cheaper alternatives are not readily available. [1]
- Singapore's small size means it cannot generate sufficient renewable energy domestically and must depend on regional imports, which introduces geopolitical and supply chain risks. [1]
Marking Notes:
- Award up to 3 marks for points supporting effectiveness.
- Award up to 3 marks for limitations/counter-arguments.
- Award the final mark for an overall evaluative conclusion (e.g., "Overall, Singapore's approach is commendable given its constraints, but structural dependence on natural gas remains a significant barrier to true energy sustainability").
- For 5 marks, the answer must include both positive and negative evaluation with reasoning.
Question 4 (7 marks)
(a) Which country experienced the largest absolute decrease in forest cover between 2001 and 2022? [1]
Answer: Indonesia (decrease of 950 − 820 = 130 thousand km²). [1]
Marking Notes:
- Award 1 mark for correct answer: Indonesia.
- Do not award the mark if the answer is correct but the working is not shown (the question does not require working, but the answer must be clearly Indonesia).
(b) Calculate the percentage decrease in forest cover for Cambodia between 2001 and 2022. Show your working. [2]
Answer:
Percentage decrease=120120−85×100%
=12035×100%
=29.2%[1 for correct working, 1 for correct answer]
Marking Notes:
- Accept answers in the range 29%–29.2%.
- Award 1 mark for correct method even if the final answer is wrong.
(c) Account for the changes in forest cover shown in Resource D. [4]
Answer:
- Indonesia and Myanmar experienced the largest absolute losses due to extensive commercial logging and the expansion of oil palm plantations, driven by global demand for palm oil and timber products. [1]
- Cambodia's significant percentage decrease (29.2%) is linked to illegal logging, agricultural encroachment by smallholder farmers, and weak enforcement of forest protection laws. [1]
- Malaysia's moderate decrease reflects continued deforestation for plantation agriculture, though at a slower rate than Indonesia due to stronger regulatory frameworks and certification schemes (e.g., Malaysian Sustainable Palm Oil). [1]
- Vietnam is the only country showing a slight increase in forest cover (110 to 115 thousand km²), likely due to government reforestation programmes, afforestation policies, and a shift from subsistence agriculture to industrial/urban employment reducing pressure on forests. [1]
Marking Notes:
- Award 1 mark per valid explanation linked to a specific country or comparison.
- Answers must explain causation (the "why"), not just describe the changes.
- Credit any other valid explanations supported by the data.
Section B: Structured and Essay Questions (30 marks)
Question 5 (15 marks)
(a) Define the term sustainable development. [2]
Answer: Sustainable development is development that meets the needs of the present without compromising the ability of future generations to meet their own needs. [2]
Marking Notes:
- Award 2 marks for a complete definition that includes both present needs and future generations.
- Award 1 mark for a partial definition (e.g., only mentions "meeting present needs" or only "not harming the future").
(b) Explain three ways in which the over-extraction of groundwater can threaten resource sustainability. [6]
Answer:
Way 1: Depletion of aquifer levels When groundwater is extracted faster than the natural recharge rate, aquifer levels decline. This means the resource is being consumed faster than it can be replenished, making it unsustainable in the long term. Eventually, the aquifer may become effectively exhausted, removing a critical water source for future generations. [2]
Way 2: Land subsidence Over-extraction of groundwater can cause the ground above the aquifer to compact and sink, a process known as land subsidence. This is often irreversible and can damage infrastructure (buildings, roads, pipelines), reduce the aquifer's future storage capacity, and increase flood risk in low-lying areas. [2]
Way 3: Saltwater intrusion In coastal areas, excessive groundwater pumping lowers the water table, allowing saltwater from the ocean to infiltrate the aquifer. This contaminates the freshwater supply, rendering it unusable for drinking or irrigation without expensive treatment. Once saltwater intrusion occurs, it is extremely difficult and costly to reverse. [2]
Marking Notes:
- Award up to 2 marks per way: 1 mark for identifying the threat, 1 mark for explaining how it undermines sustainability.
- Accept other valid ways: e.g., reduced river baseflow affecting ecosystems, increased energy costs for pumping from greater depths.
(c) "Technological solutions alone are insufficient to achieve resource sustainability." How far do you agree with this statement? [7]
Marking Descriptors:
| Level | Marks | Descriptors |
|---|---|---|
| Level 1 | 1–2 | Simple statements with little development. May agree or disagree but without substantiated reasoning. |
| Level 2 | 3–4 | Some explanation of why technology helps or falls short, but one-sided or lacking depth. Limited examples. |
| Level 3 | 5–6 | Balanced discussion with clear reasoning on both sides. Acknowledges the role of technology but also identifies limitations. Uses relevant examples. |
| Level 4 | 7 | Well-structured, balanced argument with clear evaluation. Discusses the contribution of technology (e.g., renewable energy, desalination, precision agriculture) AND the need for complementary approaches (policy, behavioural change, education, governance). Reaches a substantiated conclusion. |
Indicative Content:
Arguments that technology IS important:
- Renewable energy technologies (solar panels, wind turbines) have dramatically reduced the cost of clean energy, making it viable to transition away from fossil fuels.
- Desalination technology can convert seawater into freshwater, addressing water scarcity in arid regions.
- Precision agriculture (drones, sensors, data analytics) optimises water and fertiliser use, reducing waste and environmental impact.
- Carbon capture and storage (CCS) technology can reduce emissions from existing industrial processes.
Arguments that technology alone is INSUFFICIENT:
- Technology does not address overconsumption — without changes in consumer behaviour and demand, efficiency gains may be offset by increased overall use (Jevons paradox).
- Political will and governance are needed to implement and regulate technologies. Without supportive policies (carbon pricing, subsidies, regulations), adoption remains slow.
- Social equity issues — advanced technologies may be expensive and inaccessible to developing countries, widening the sustainability gap between rich and poor nations.
- Education and awareness are needed to change cultural attitudes towards resource use; technology cannot substitute for a shift in values.
- Some problems require systemic, not technological, solutions — e.g., reducing inequality, improving governance, and reforming economic systems.
Conclusion: Technology is a necessary but not sufficient condition for resource sustainability. It must be accompanied by effective governance, behavioural change, equitable access, and systemic economic reforms to achieve truly sustainable outcomes.
Marking Notes:
- Award marks based on the level descriptors above.
- For 7 marks, the answer must present a balanced argument with a clear, substantiated conclusion.
Question 6 (15 marks)
(a) Identify two circular economy initiatives mentioned in Resource E. [2]
Answer:
- Initiative 1: Mandatory recycling targets for construction waste (90% by 2025). [1]
- Initiative 2: Extended producer responsibility schemes for electronics and packaging. [1]
Marking Notes:
- Award 1 mark per correct initiative identified from Resource E.
- Accept other valid initiatives from the resource: materials passport system for buildings, subsidies for circular design.
(b) Using information from Resource E, explain the challenges the Netherlands faces in transitioning to a circular economy. [4]
Answer:
- The transition is progressing too slowly relative to the 2050 target, suggesting that current policies and incentives are not driving change at the required pace. The country's material footprint per capita remains among the highest in the EU, indicating that overall consumption has not decreased significantly. [1]
- Small and medium enterprises (SMEs) face financial barriers in adopting circular practices. The upfront costs of redesigning products, investing in new machinery, or changing supply chains can be prohibitive for smaller firms with limited capital. [1]
- Consumer behaviour remains oriented towards linear consumption patterns — people continue to prefer buying new products, discarding old ones, and are reluctant to embrace reuse, repair, or sharing models. Changing deeply ingrained consumption habits is a slow and difficult process. [1]
- The high material footprint suggests that even with recycling and reuse initiatives, the overall volume of resources consumed remains unsustainable. Without addressing the root cause of overconsumption, circular economy measures may only partially mitigate the problem. [1]
Marking Notes:
- Award 1 mark per valid challenge explained with reference to Resource E.
- Answers must use evidence from the resource, not generic points.
(c) Discuss the extent to which a circular economy model is more sustainable than a traditional linear economy. [9]
Marking Descriptors:
| Level | Marks | Descriptors |
|---|---|---|
| Level 1 | 1–3 | Basic description of circular vs. linear economy with limited explanation of sustainability benefits. May be one-sided. |
| Level 2 | 4–6 | Explains several advantages of the circular economy with some supporting evidence. May acknowledge some limitations but lacks depth or balance. |
| Level 3 | 7–9 | Comprehensive discussion comparing both models across multiple dimensions (environmental, economic, social). Provides specific examples and evidence. Acknowledges limitations of the circular economy and reaches a well-substantiated conclusion. |
Indicative Content:
Environmental sustainability:
- A circular economy reduces the extraction of virgin raw materials by keeping materials in use for longer through reuse, repair, remanufacturing, and recycling. This lowers environmental degradation from mining, logging, and drilling.
- It minimises waste sent to landfills and incinerators, reducing pollution, greenhouse gas emissions, and land contamination.
- The linear economy's "take-make-dispose" model is inherently unsustainable because it assumes infinite resources and infinite waste absorption capacity — both of which are finite.
Economic sustainability:
- The circular economy can create new business models (product-as-a-service, sharing platforms) and green jobs in recycling, repair, and remanufacturing sectors.
- It reduces dependence on imported raw materials, improving supply chain resilience and reducing vulnerability to commodity price volatility.
- However, the transition requires significant upfront investment, and some industries may face disruption or job losses in extractive sectors.
Social sustainability:
- Circular economy principles can promote social equity by making products more affordable through reuse and repair, and by creating local employment in circular industries.
- However, the transition may disproportionately affect workers in extractive and manufacturing industries who need retraining and support.
Limitations of the circular economy:
- Not all materials can be recycled indefinitely — some degrade in quality with each cycle (downcycling).
- The circular economy does not inherently address overconsumption; if total demand continues to grow, even circular systems may not be sufficient.
- Implementation requires coordinated action across governments, businesses, and consumers, which is challenging to achieve at scale.
Conclusion: The circular economy is significantly more sustainable than the linear economy across environmental, economic, and social dimensions, but it is not a panacea. Its effectiveness depends on complementary policies, technological innovation, and shifts in consumer behaviour.
Marking Notes:
- Award marks based on the level descriptors above.
- For 9 marks, the answer must demonstrate comprehensive knowledge, balanced analysis, specific examples, and a clear evaluative conclusion.
Summary of Marks
| Question | Part | Marks | Running Total |
|---|---|---|---|
| 1 | (a) | 3 | |
| 1 | (b) | 4 | |
| 1 | (c) | 3 | 10 |
| 2 | (a) | 2 | |
| 2 | (b) | 2 | |
| 2 | (c) | 4 | 8 |
| 3 | (a) | 2 | |
| 3 | (b) | 3 | |
| 3 | (c) | 5 | 10 |
| 4 | (a) | 1 | |
| 4 | (b) | 2 | |
| 4 | (c) | 4 | 7 |
| Section A Total | 30 | ||
| 5 | (a) | 2 | |
| 5 | (b) | 6 | |
| 5 | (c) | 7 | 15 |
| 6 | (a) | 2 | |
| 6 | (b) | 4 | |
| 6 | (c) | 9 | 15 |
| Section B Total | 30 | ||
| Grand Total | 60 |
Free quiz and exam paper access
Enter your details to view this paper
Your access is remembered on this device.