AI Generated Quiz
A Level H2 Economics Microeconomics Quiz
Free A Level H2 Econs Microeconomics quiz, HY3 AI version, with questions, answers, and A Level-style practice for Singapore students.
These static practice materials are generated from the site's syllabus and paper-generation workflow, with source and model context shown so students and parents can evaluate the material before use.
Questions
A-Level Economics H2 Quiz - Microeconomics
Name: ___________________________
Class: ___________________________
Date: ___________________________
Score: _______ / 40
Duration: 60 minutes
Total Marks: 40
Instructions:
- Answer all 20 questions.
- Section A: 10 short structured questions (2 marks each).
- Section B: 6 applied questions with subparts (3–5 marks each).
- Section C: 4 data-based / evaluation questions (4–5 marks each).
- Use diagrams where instructed. Show working for calculation questions.
- This quiz is syllabus-first practice generated from LLM-inferred templates; it is not derived from past-year exam papers.
Section A: Short Structured Questions (2 marks each, Q1–Q10)
Q1. Explain the signalling function of the price mechanism in a free market.
Q2. State one determinant of market demand that is a non-price factor.
Q3. Define consumer surplus in one sentence.
Q4. A good has income elasticity of demand (YED) = −0.4. State whether it is a normal or inferior good.
Q5. Give one example of a government price control.
Q6. If demand is perfectly inelastic, what is the value of price elasticity of demand (PED)?
Q7. Explain the incentive function of the price mechanism.
Q8. A tax is imposed on a good. State the effect on the supply curve.
Q9. Define cross elasticity of demand (XED) and state what sign it has for substitutes.
Q10. What is the profit-maximising condition for a firm in terms of marginal revenue (MR) and marginal cost (MC)?
Section B: Applied Questions (Q11–Q16)
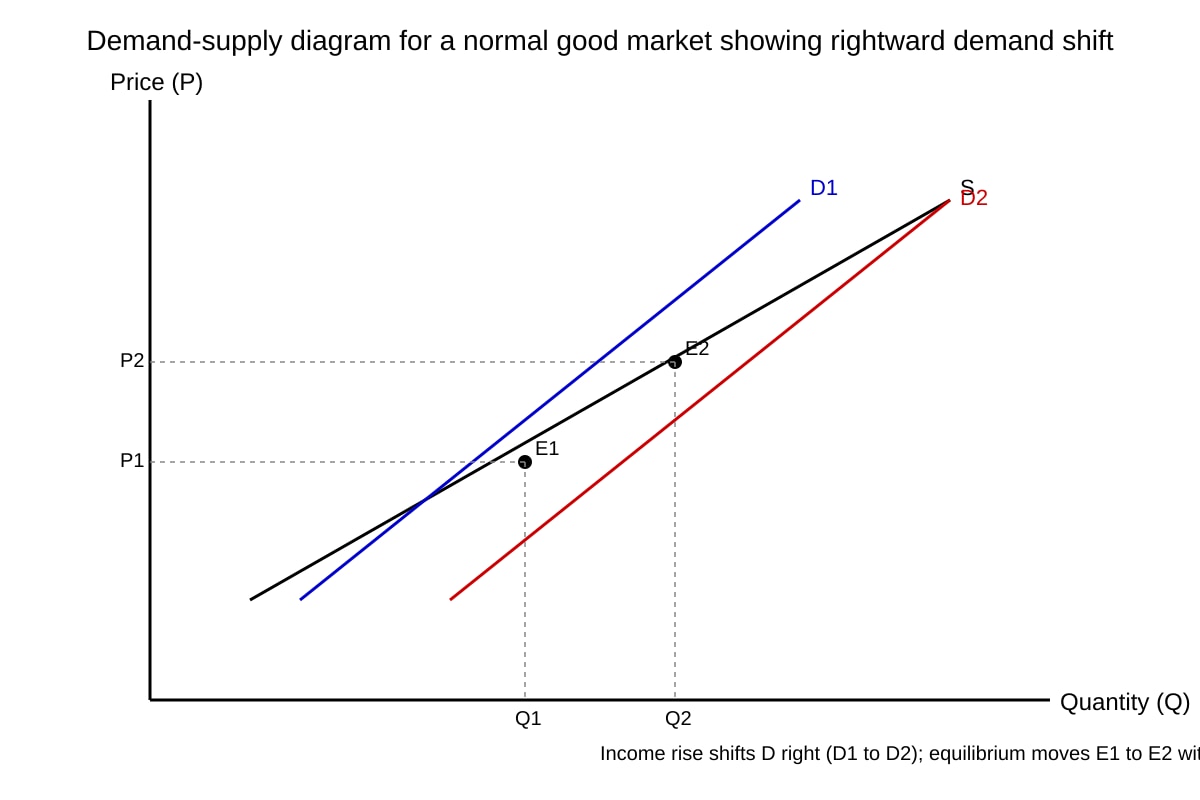
Q11. (a) Explain how an increase in consumer income affects the demand for a normal good. [2]
(b) Using a demand-supply diagram, show the effect on equilibrium price and quantity. [3]
Image pending generation: diagram for Q11.
Q12. A cinema faces demand P=20−0.5Q.
(a) Calculate price elasticity of demand at P = \12$. [3]
(b) Should the cinema increase or decrease price to raise total revenue? Explain. [2]
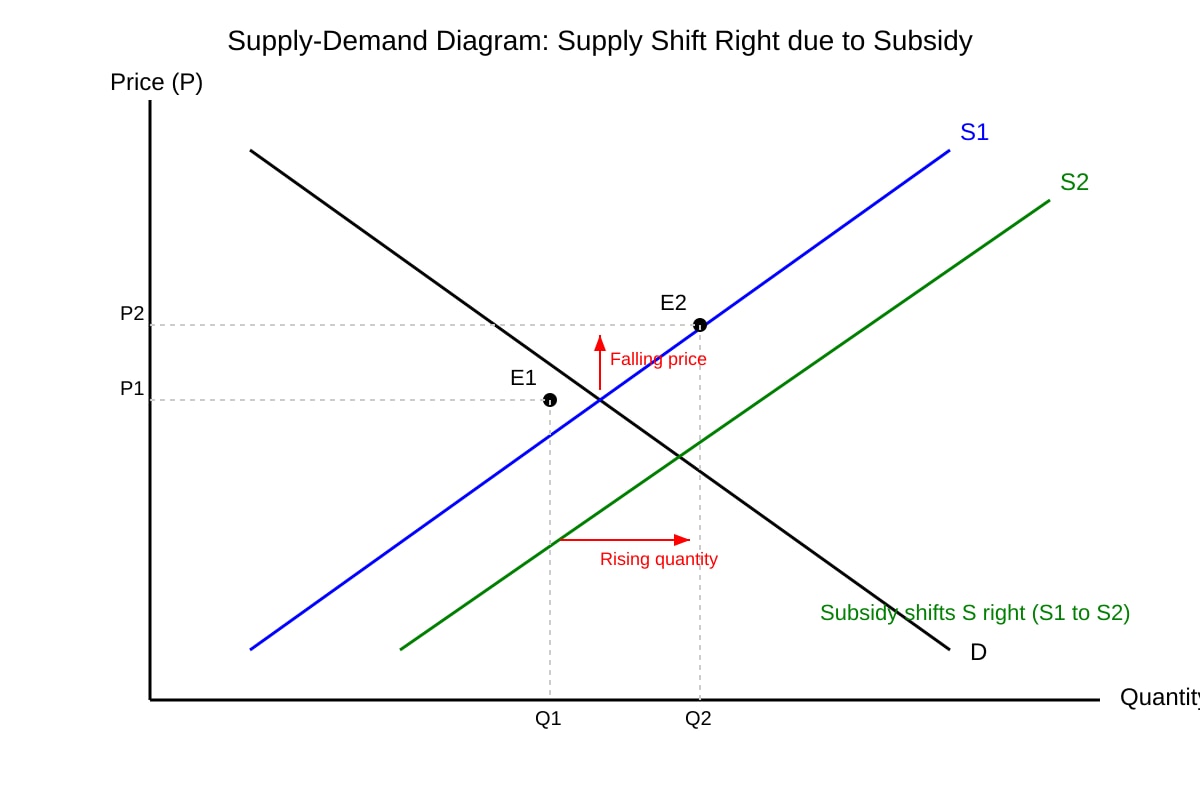
Q13. (a) With the aid of a diagram, explain how a subsidy to producers affects equilibrium price and quantity. [3]
Image pending generation: diagram for Q13.
(b) State one group that gains consumer surplus and one that gains producer surplus. [2]
Q14. Explain two differences between a movement along the demand curve and a shift of the demand curve. [4]
Q15. (a) Define price elasticity of supply (PES). [1]
(b) If a firm can increase output quickly, is PES elastic or inelastic? Explain. [3]
Q16. Evaluate whether a maximum price set below equilibrium will necessarily benefit consumers. [5]
Section C: Data-Based and Evaluation (Q17–Q20)
Q17. Extract: "Global demand for electric vehicles (EVs) rose sharply in 2025, increasing production of lithium batteries. Lithium is a key input."
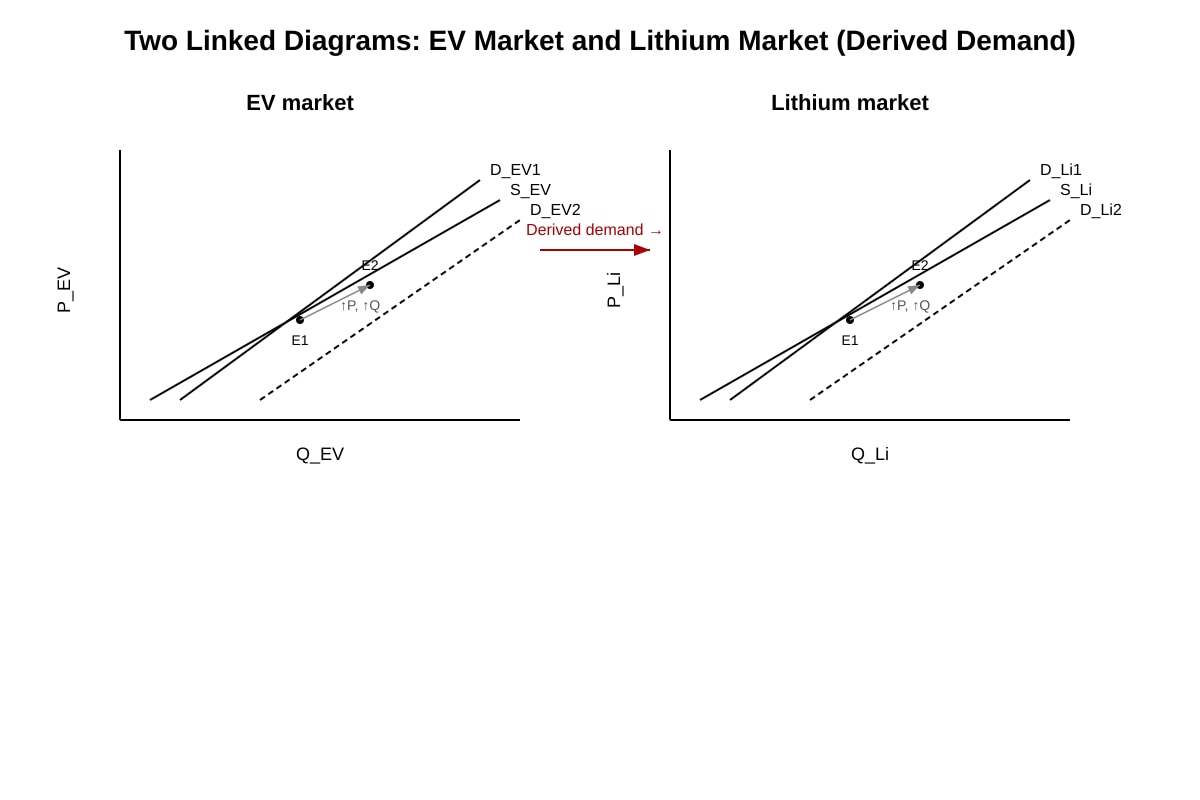
(a) With reference to the extract, use a diagram to explain how EV demand affects the lithium market. [3]
Image pending generation: diagram for Q17.
(b) State one reason why lithium producers may not be able to meet the new demand immediately. [2]
Q18. A government imposes a quota on imported rice.
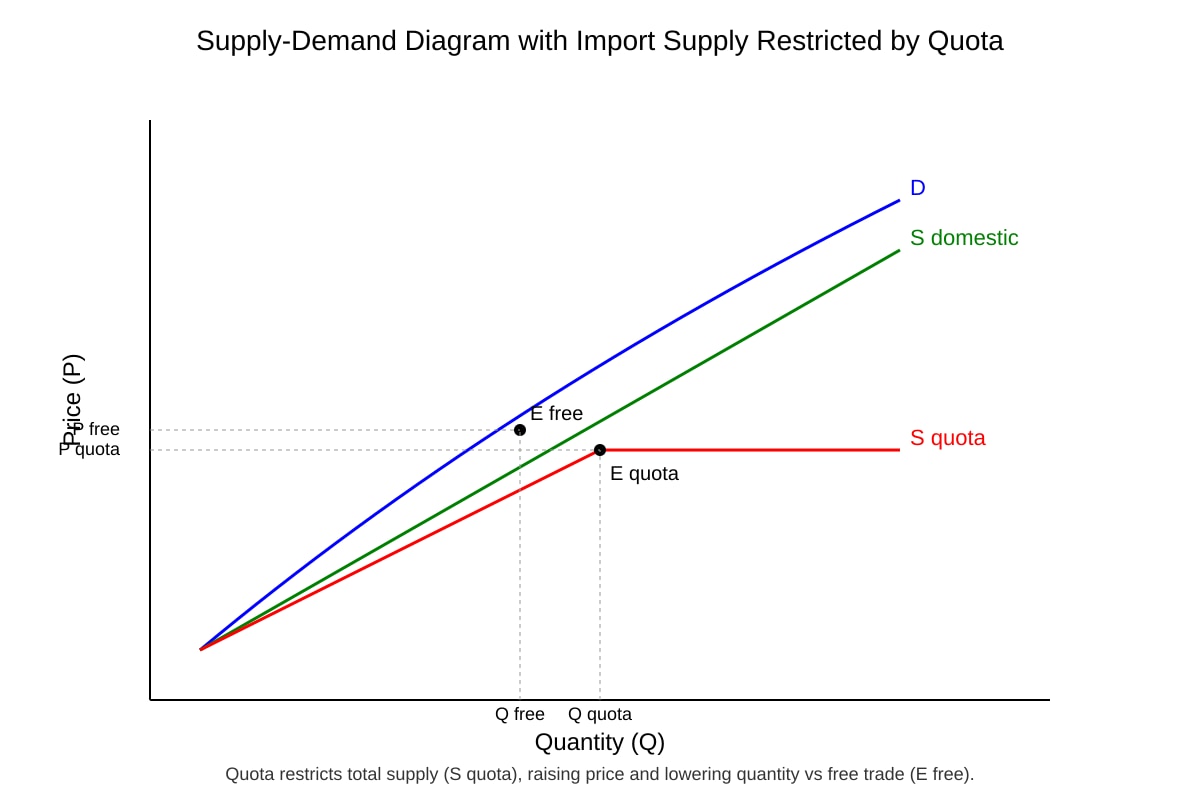
(a) Explain how the quota affects domestic price and quantity using a diagram. [3]
Image pending generation: diagram for Q18.
(b) Discuss one unintended consequence for consumers. [2]
Q19. "Consumers should avoid fast fashion and buy sustainable clothing to reduce environmental harm. Evaluate this statement." [4]
Q20. A firm in monopolistic competition advertises heavily.
(a) Explain the type of competition used. [2]
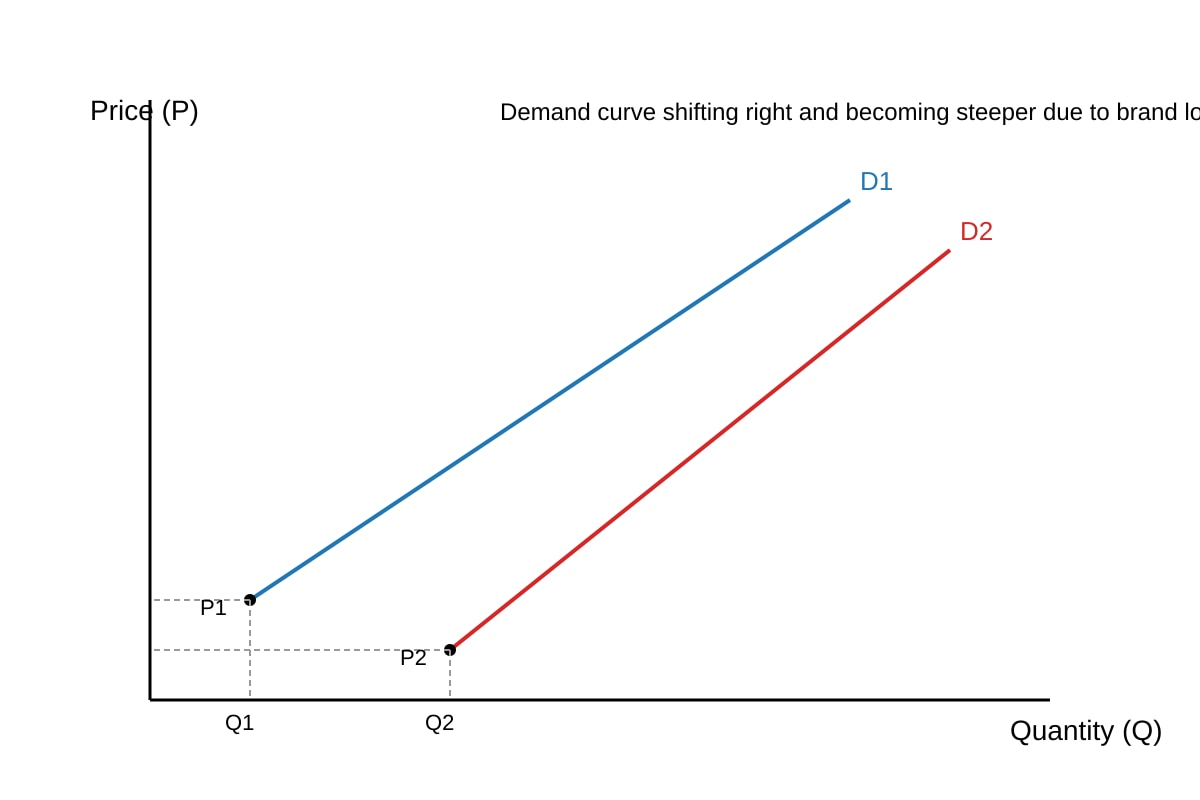
(b) Using a diagram, show how successful advertising affects the firm's demand curve. [3]
Image pending generation: diagram for Q20.
Answers
A-Level Economics H2 Quiz - Microeconomics (Answer Key)
Total Marks: 40
Note: Syllabus-first generated content from LLM-inferred templates. Not past-year exam derived.
Section A (Q1–Q10, 2 marks each)
Q1. [2 marks]
Signalling function: Prices act as signals to producers and consumers. A rising price signals scarcity and encourages producers to increase supply while telling consumers to reduce demand.
Teaching note: The price mechanism coordinates via price changes without central planning.
Q2. [2 marks]
Any one: consumer income, tastes/preferences, price of related goods (substitutes/complements), population size, expectations.
Common mistake: Stating "price of the good" – that causes movement, not shift.
Q3. [2 marks]
Consumer surplus is the difference between what consumers are willing to pay and what they actually pay.
Q4. [2 marks]
Inferior good (since YED<0, demand falls when income rises).
Q5. [2 marks]
Maximum price (price ceiling) or minimum price (price floor).
Q6. [2 marks]
PED=0 (quantity demanded does not change with price).
Q7. [2 marks]
Incentive function: Higher prices incentivise producers to supply more and consumers to buy less; lower prices do opposite.
Q8. [2 marks]
Supply curve shifts left (decrease in supply) due to higher cost per unit.
Q9. [2 marks]
XED=%ΔPB%ΔQdA. For substitutes, XED>0.
Q10. [2 marks]
Profit maximisation occurs where MR=MC and MC is rising.
Section B (Q11–Q16)
Q11. [5 marks]
(a) [2] For a normal good, higher income increases demand at each price → demand curve shifts right.
(b) [3] Diagram shows D1→D2 right, equilibrium price rises P1→P2, quantity Q1→Q2. See Q11-fig1: labels P, Q, D1, S, D2, E1, E2.
Q12. [5 marks]
(a) [3] P=20−0.5Q → at P=12, Q=16. dPdQ=−2. PED=(−2)×(12/16)=−1.5.
(b) [2] ∣PED∣>1 (elastic) → decreasing price increases total revenue.
Q13. [5 marks]
(a) [3] Subsidy lowers cost → S shifts right → price falls, quantity rises (Q13-fig1).
(b) [2] Consumers gain CS; producers gain PS (or receive higher effective price).
Q14. [4 marks]
- Movement along: caused by price change of the good itself; shift: caused by non-price determinants.
- Movement: changes quantity demanded only; shift: changes demand at all prices.
Q15. [4 marks]
(a) [1] PES=%ΔP%ΔQs.
(b) [3] Elastic, because quick output response means quantity supplied reacts strongly to price.
Q16. [5 marks]
[5] May benefit consumers via lower price, but causes shortage, black market, reduced quality. Not necessarily benefit all. Mark descriptors: identify effect (2), evaluate trade-off (3).
Section C (Q17–Q20)
Q17. [5 marks]
(a) [3] EV demand ↑ → derived demand for lithium ↑ → lithium price & quantity ↑ (Q17-fig1).
(b) [2] Capacity constraints / time to open mines (inelastic short-run supply).
Q18. [5 marks]
(a) [3] Quota reduces supply → domestic price ↑, quantity ↓ (Q18-fig1).
(b) [2] Consumers face higher prices, less choice.
Q19. [4 marks]
[4] Consumer choice helps but market failure (externalities) limits impact; info asymmetry and cost barriers. Evaluation needed.
Q20. [5 marks]
(a) [2] Non-price competition (advertising/branding).
(b) [3] Advertising shifts D right and steepens → higher P and Q (Q20-fig1).
Free quiz and exam paper access
Enter your details to view this paper
Your access is remembered on this device.