AI Generated Quiz
A Level H2 Economics Market Failure Quiz
Free A Level H2 Econs Market Failure quiz, HY3 AI version, with questions, answers, and A Level-style practice for Singapore students.
These static practice materials are generated from the site's syllabus and paper-generation workflow, with source and model context shown so students and parents can evaluate the material before use.
Questions
A-Level Economics H2 Quiz - Market Failure
Name: ___________________________
Class: ___________________________
Date: ___________________________
Score: ___________ / 40
Duration: 60 minutes
Total Marks: 40
Topic: Market Failure (microeconomic objectives and policies)
Instructions:
- Answer all 20 questions.
- Section A: short structured questions (1–8). Section B: data and diagram interpretation (9–14). Section C: source-based evaluation (15–20).
- Use diagrams where requested and label all curves and axes.
- Write clearly and show reasoning for all marks awarded.
Section A: Short Structured Questions (1–8) [16 marks]
1. Define "market failure" in one sentence. [2]
2. State two types of externalities that lead to market failure. [2]
(i) _______________________ (ii) _______________________
3. Explain what is meant by "public good" and give one example. [2]
4. A negative production externality causes the social cost of production to be ___________ (greater / less) than the private cost. [1]
5. State one reason why merit goods are under-consumed in a free market. [2]
6. Using a demand-supply diagram, a good with a positive consumption externality will have the social benefit curve lying ___________ (to the left / to the right) of the private demand curve. [1]
7. Explain the concept of "information asymmetry" and how it may cause market failure. [3]
8. State one policy tool a government can use to correct a negative externality. [1]
Section B: Data and Diagram Interpretation (9–14) [12 marks]
9. The table below shows the private and social costs of producing electricity from a coal plant.
| Output (MWh) | Private MC ($/MWh) | External Cost ($/MWh) |
|---|---|---|
| 100 | 40 | 10 |
| 200 | 50 | 10 |
| 300 | 60 | 10 |
Calculate the marginal social cost (MSC) at output 200 MWh. [2]
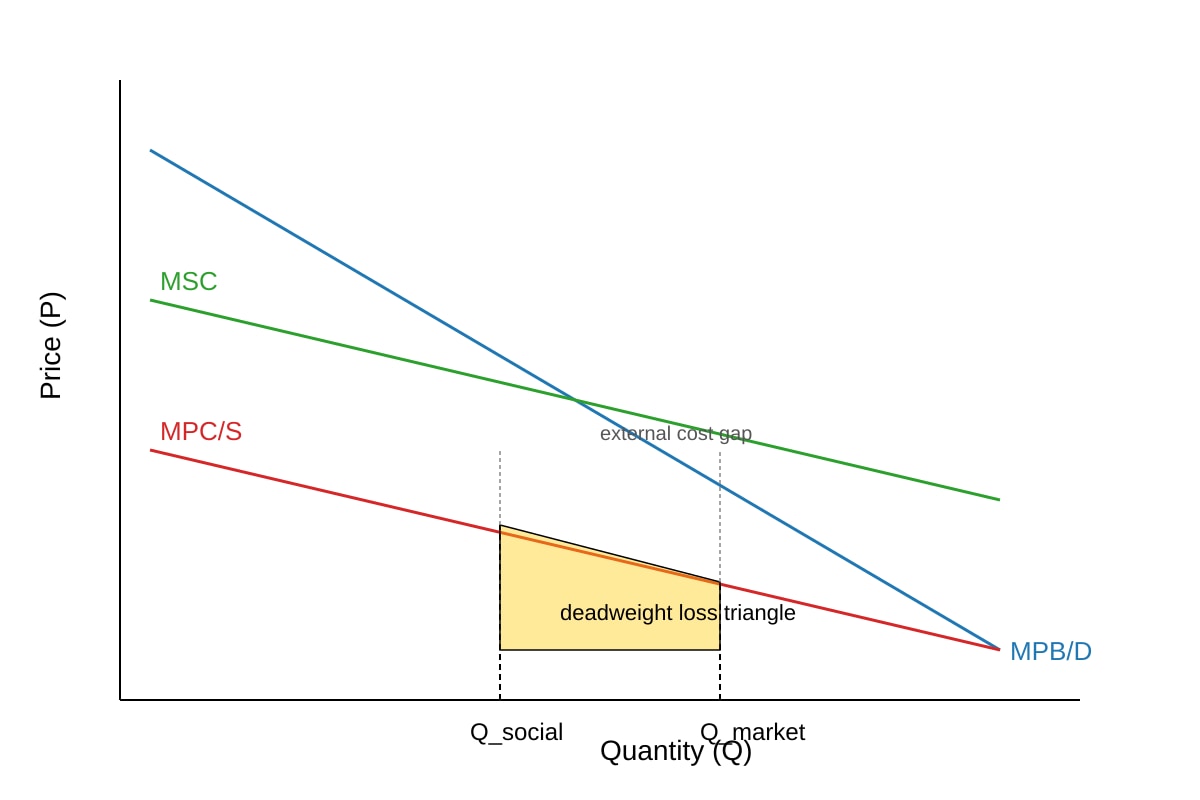
10. With the aid of a diagram, explain how a negative production externality leads to over-production and deadweight loss. [3]
Image pending generation: diagram for Q10.
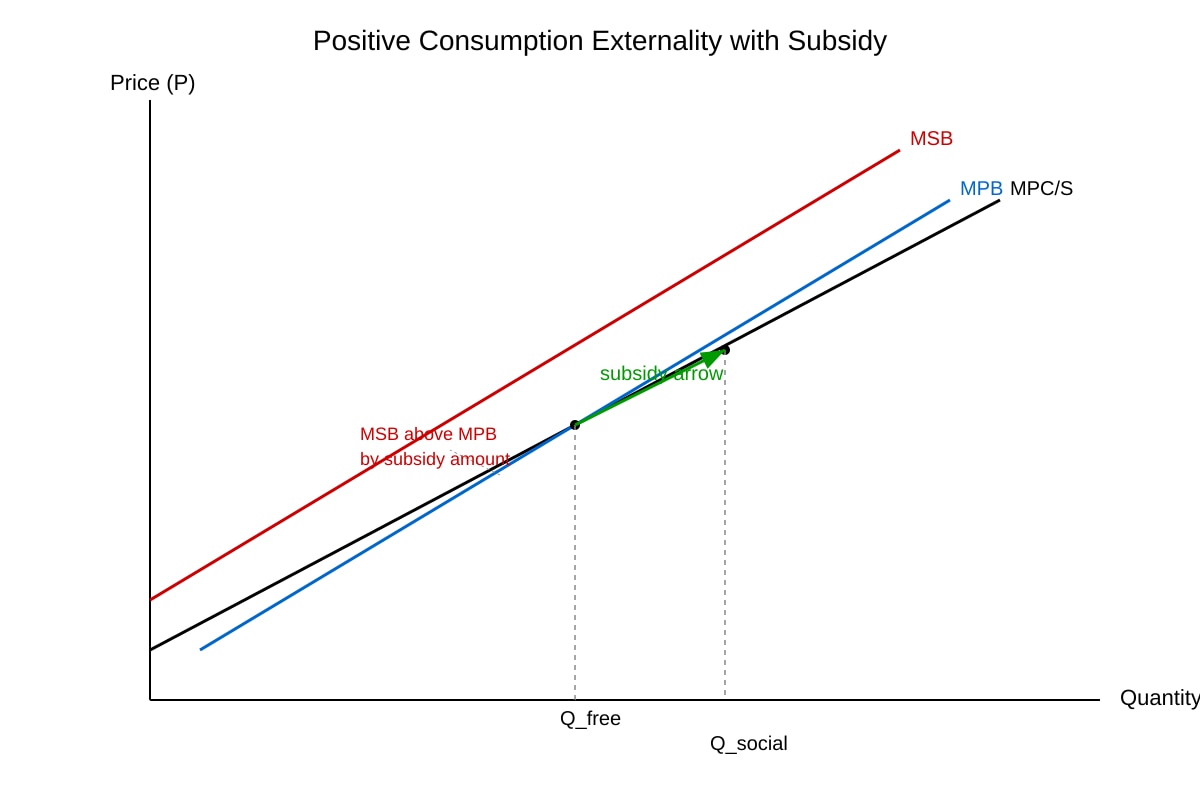
11. A subsidy is given to consumers of electric vehicles (EVs) which create positive externalities. With reference to a diagram, explain how the subsidy moves the market closer to the socially efficient output. [3]
Image pending generation: diagram for Q11.
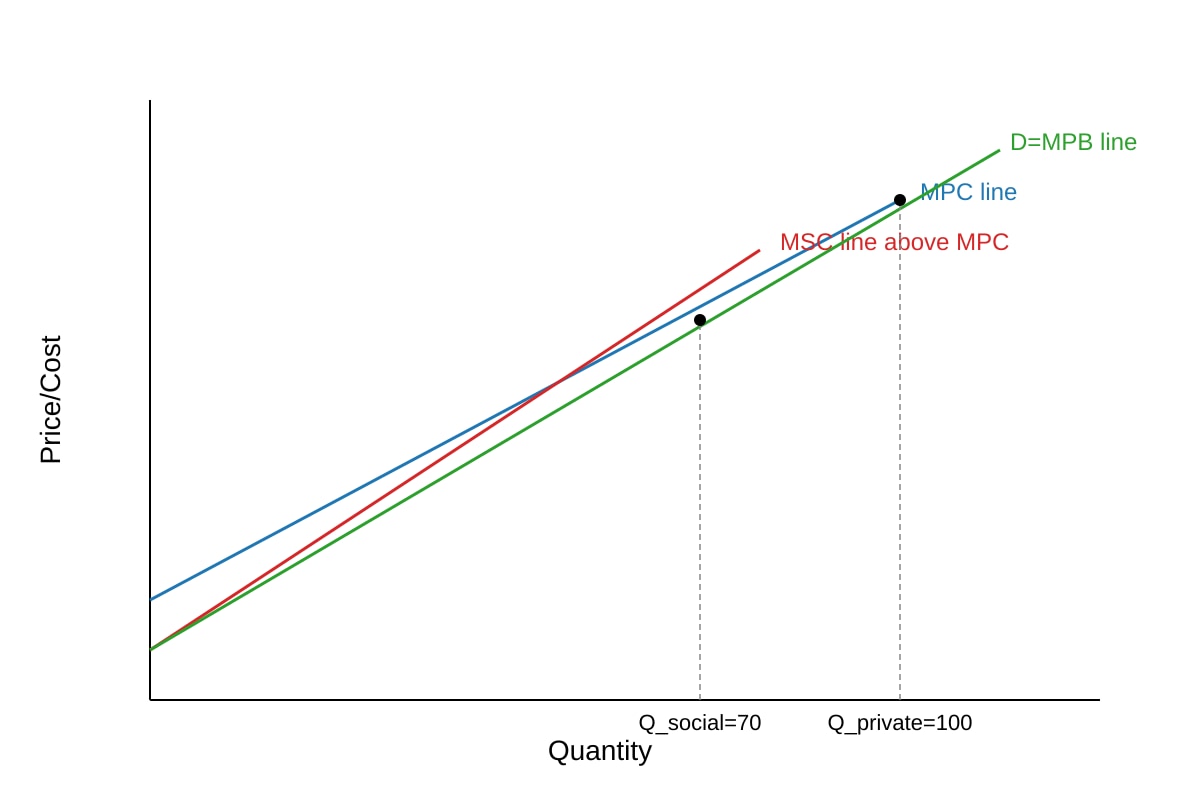
12. The graph below shows the marginal private cost (MPC) and marginal social cost (MSC) for a factory.
Image pending generation: graph for Q12.
Using the graph, state the privately optimal output and the socially optimal output. [2]
Private: ___________ Social: ___________
13. Explain why a free market for street lighting (a public good) would likely fail to provide the good efficiently. [1]
14. Calculate the deadweight loss (in )iftheexternalcostis5 per unit and the over-production is 20 units, assuming constant marginal external cost and linear curves. [1]
Section C: Source-Based Evaluation (15–20) [12 marks]
Read Extract 1 and answer questions 15–17.
Extract 1:
Singapore generates large amounts of plastic waste, but recycling rates remain low at 6%. Many households do not separate waste because they lack information on recycling points and believe their individual action has negligible impact. Producers of single-use plastics face no tax on the environmental cost they impose. The government is considering an extended producer responsibility (EPR) scheme requiring firms to manage end-of-life plastic.
15. With reference to Extract 1, identify two sources of market failure in the plastic waste market. [2]
(i) _______________________ (ii) _______________________
16. Explain how information asymmetry is shown in Extract 1. [2]
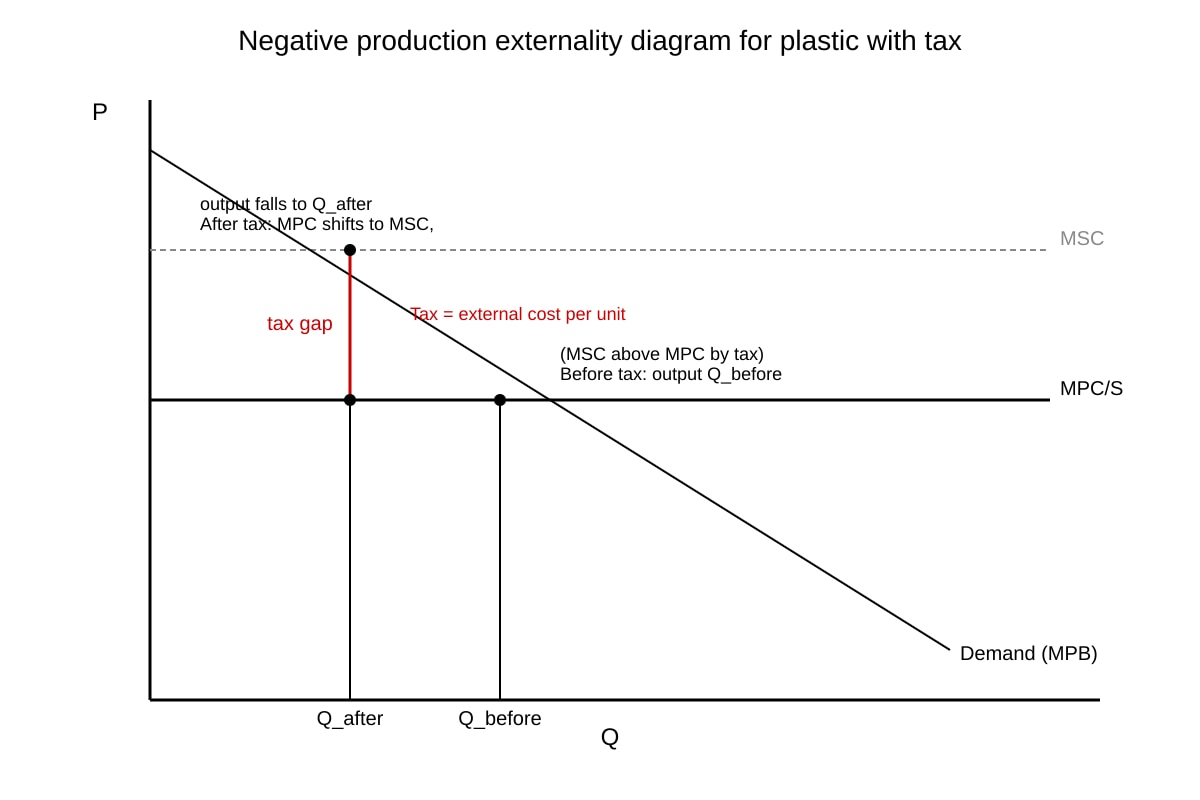
17. Using a diagram, explain how a tax on plastic producers could move the market toward a socially efficient outcome. [3]
Image pending generation: diagram for Q17.
Read Extract 2 and answer questions 18–20.
Extract 2:
A new bike-sharing scheme in City X reduces traffic congestion and air pollution (positive externalities). However, poorly parked bikes clutter sidewalks (negative externality). The city council asks whether consumer choice alone will lead to the best outcome.
18. Identify one positive and one negative externality from Extract 2. [2]
Positive: _______________________ Negative: _______________________
19. Evaluate the statement: "It is up to consumers to choose bike-sharing to alleviate congestion; no government action is needed." [2]
20. Suggest one government policy to internalise the negative externality in Extract 2 and explain its effect. [1]
</stage5_quiz_answers_md>
A-Level Economics H2 Quiz - Market Failure (Answer Key)
Topic: Market Failure
Total Marks: 40
Section A: Short Structured (1–8)
Q1 [2 marks]
Market failure occurs when the free market allocation of resources is inefficient, resulting in a net social welfare loss.
Teaching note: Define as divergence between private and social optimum. 1 mark for "inefficient allocation", 1 mark for welfare loss / externality context.
Q2 [2 marks]
(i) Negative externality (e.g. pollution) (ii) Positive externality (e.g. education)
Any two from: negative production/consumption externality, positive production/consumption externality, public goods, merit/demerit goods, information asymmetry. 1 mark each.
Q3 [2 marks]
A public good is non-excludable and non-rivalrous in consumption; example: national defence / street lighting.
1 mark definition, 1 mark example.
Q4 [1 mark]
greater
Because social cost = private cost + external cost.
Q5 [2 marks]
Merit goods are under-consumed because consumers underestimate the private benefits (e.g. future health from education) or lack information.
Accept: positive externalities not reflected in demand; 2 marks for explanation.
Q6 [1 mark]
to the right
MSB > MPB due to external benefit.
Q7 [3 marks]
Information asymmetry means one party has more/better information than the other (e.g. seller knows product quality). This causes market failure when it leads to adverse selection or moral hazard, e.g. "lemons market" where good products exit.
1 mark definition, 2 marks explanation with example.
Q8 [1 mark]
Tax / subsidy / regulation / tradable permit. (Any one.)
Section B: Data and Diagram (9–14)
Q9 [2 marks]
MSC = Private MC + External Cost = 50 + 10 = $60 / MWh.
1 mark method, 1 mark final value.
Q10 [3 marks]
Diagram: MPC below MSC; market equilibrium Q_market where MPB=MPC; social optimum Q_social where MPB=MSC. Over-production = Q_market − Q_social. DWL triangle between MPC and MSC from Q_social to Q_market.
1 mark diagram, 1 mark explanation of over-production, 1 mark DWL.
Q11 [3 marks]
Subsidy shifts consumer demand from MPB to MSB (or shifts effective price). New equilibrium at Q_social where MSB=MPC. Closes gap between private and social benefit.
1 mark diagram, 2 marks reasoning.
Q12 [2 marks]
Private: 100; Social: 70.
1 mark each from graph.
Q13 [1 mark]
Free-rider problem: non-excludability means people won't pay, so private market under-provides.
Q14 [1 mark]
DWL = 0.5 × 5×20=50.
Formula for triangle with constant MEC.
Section C: Source-Based (15–20)
Q15 [2 marks]
(i) Negative externality (no tax on environmental cost) (ii) Information asymmetry / lack of info on recycling.
1 mark each.
Q16 [2 marks]
Households lack information on recycling points and believe impact negligible → asymmetric info between council and households causing low recycling.
2 marks for extract reference + explanation.
Q17 [3 marks]
Tax = external cost per unit; shifts MPC to MSC; output falls to Q_after (social optimum); DWL removed. Diagram as placeholder.
1 mark diagram, 2 marks explanation.
Q18 [2 marks]
Positive: reduced congestion/pollution. Negative: sidewalk clutter.
1 mark each.
Q19 [2 marks]
Consumer choice alone ignores negative externality of clutter and may under-provide positive; government coordination needed. Partial marks for balanced view.
Q20 [1 mark]
Fine for improper parking (internalises negative); reduces clutter.
Answers
A-Level Economics H2 Quiz - Market Failure (Answer Key)
Topic: Market Failure
Total Marks: 40
Section A: Short Structured (1–8)
Q1 [2 marks]
Market failure occurs when the free market allocation of resources is inefficient, resulting in a net social welfare loss.
Teaching note: Define as divergence between private and social optimum. 1 mark for "inefficient allocation", 1 mark for welfare loss / externality context.
Q2 [2 marks]
(i) Negative externality (e.g. pollution) (ii) Positive externality (e.g. education)
Any two from: negative production/consumption externality, positive production/consumption externality, public goods, merit/demerit goods, information asymmetry. 1 mark each.
Q3 [2 marks]
A public good is non-excludable and non-rivalrous in consumption; example: national defence / street lighting.
1 mark definition, 1 mark example.
Q4 [1 mark]
greater
Because social cost = private cost + external cost.
Q5 [2 marks]
Merit goods are under-consumed because consumers underestimate the private benefits (e.g. future health from education) or lack information.
Accept: positive externalities not reflected in demand; 2 marks for explanation.
Q6 [1 mark]
to the right
MSB > MPB due to external benefit.
Q7 [3 marks]
Information asymmetry means one party has more/better information than the other (e.g. seller knows product quality). This causes market failure when it leads to adverse selection or moral hazard, e.g. "lemons market" where good products exit.
1 mark definition, 2 marks explanation with example.
Q8 [1 mark]
Tax / subsidy / regulation / tradable permit. (Any one.)
Section B: Data and Diagram (9–14)
Q9 [2 marks]
MSC = Private MC + External Cost = 50 + 10 = $60 / MWh.
1 mark method, 1 mark final value.
Q10 [3 marks]
Diagram: MPC below MSC; market equilibrium Q_market where MPB=MPC; social optimum Q_social where MPB=MSC. Over-production = Q_market − Q_social. DWL triangle between MPC and MSC from Q_social to Q_market.
1 mark diagram, 1 mark explanation of over-production, 1 mark DWL.
Q11 [3 marks]
Subsidy shifts consumer demand from MPB to MSB (or shifts effective price). New equilibrium at Q_social where MSB=MPC. Closes gap between private and social benefit.
1 mark diagram, 2 marks reasoning.
Q12 [2 marks]
Private: 100; Social: 70.
1 mark each from graph.
Q13 [1 mark]
Free-rider problem: non-excludability means people won't pay, so private market under-provides.
Q14 [1 mark]
DWL = 0.5 × 5×20=50.
Formula for triangle with constant MEC.
Section C: Source-Based (15–20)
Q15 [2 marks]
(i) Negative externality (no tax on environmental cost) (ii) Information asymmetry / lack of info on recycling.
1 mark each.
Q16 [2 marks]
Households lack information on recycling points and believe impact negligible → asymmetric info between council and households causing low recycling.
2 marks for extract reference + explanation.
Q17 [3 marks]
Tax = external cost per unit; shifts MPC to MSC; output falls to Q_after (social optimum); DWL removed. Diagram as placeholder.
1 mark diagram, 2 marks explanation.
Q18 [2 marks]
Positive: reduced congestion/pollution. Negative: sidewalk clutter.
1 mark each.
Q19 [2 marks]
Consumer choice alone ignores negative externality of clutter and may under-provide positive; government coordination needed. Partial marks for balanced view.
Q20 [1 mark]
Fine for improper parking (internalises negative); reduces clutter.
Free quiz and exam paper access
Enter your details to view this paper
Your access is remembered on this device.