A-Level Economics H2 Quiz - International Economics
Name:
Class:
Date:
Score:
Duration: 60 minutes
Total Marks: 40
Instructions: Answer all 20 questions. Section A: short structured questions (1–8). Section B: data and diagram interpretation (9–14). Section C: extended source-based and evaluation questions (15–20). Use diagrams where requested and show working for calculation items.
Section A: Short Structured Questions (1–8)
1. Define "comparative advantage" in international trade. [2]
2. State one reason why a country may impose a tariff on imported goods. [1]
3. Explain how an appreciation of a country's exchange rate affects its exports. [2]
4. Distinguish between a quota and a subsidy as forms of protectionism. [2]
5. With reference to the table below, calculate the opportunity cost of producing 1 unit of cars in terms of textiles for Country X. [2]
| Country | Cars (units/hr) | Textiles (units/hr) |
|---|
| X | 10 | 20 |
| Y | 5 | 15 |
6. Give one example of a non-tariff barrier. [1]
7. Explain the concept of "terms of trade" and how it is measured. [2]
8. State one potential benefit of membership in a free trade area such as ASEAN. [1]
Section B: Data and Diagram Interpretation (9–14)
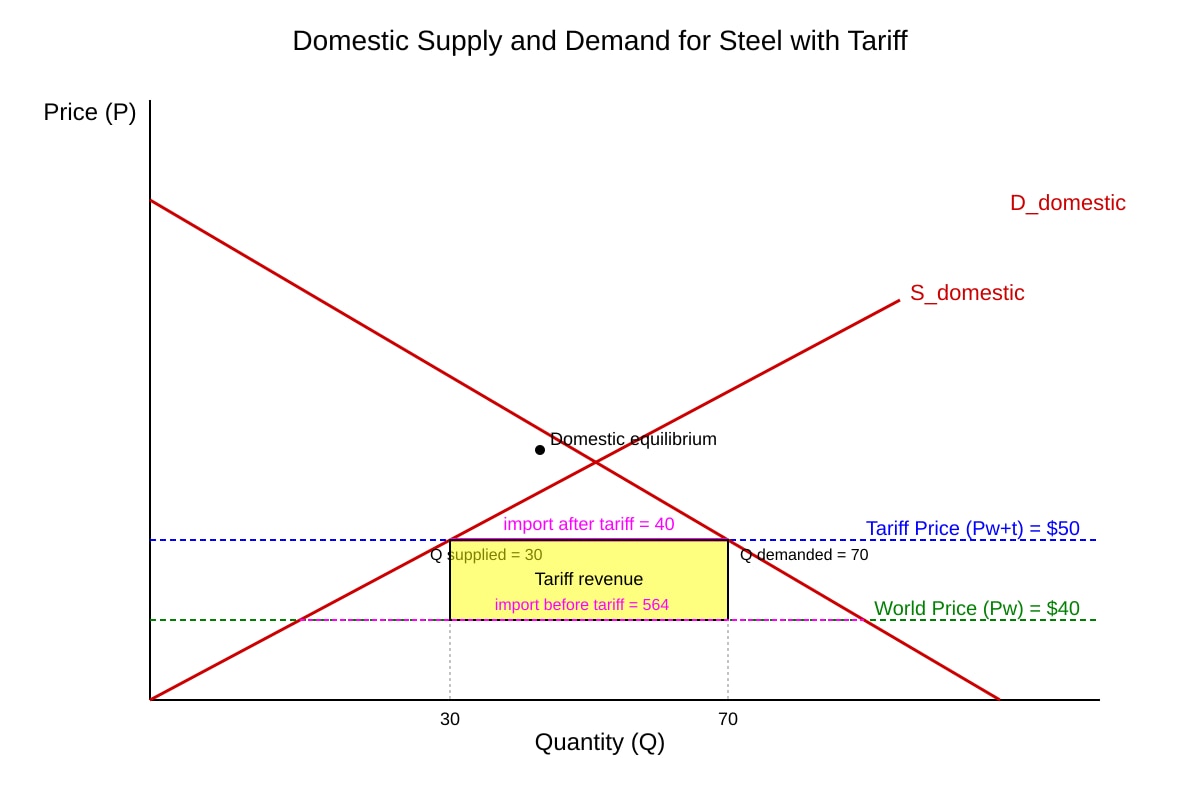
9. The diagram below shows the effect of a tariff on imported steel. Using the diagram, identify the area representing government tariff revenue. [2]
Generated diagram for Q9.
10. Using a demand and supply diagram, explain how a subsidy to export producers can increase a country's export volume. [3]
11. With reference to Extract A, compare the trend in Singapore's merchandise trade balance from 2019 to 2023. [2]
Extract A: Singapore's merchandise trade balance (S$ billion): 2019: –18.2; 2020: –12.5; 2021: –5.3; 2022: +3.1; 2023: +6.8.
12. The table shows price indices for Country Z's exports and imports (2015=100). Calculate the terms of trade index for 2023. [2]
| Year | Export Price Index | Import Price Index |
|---|
| 2023 | 130 | 110 |
13. With the aid of a diagram, explain how a rise in domestic income may worsen the current account balance through imports. [3]
14. Identify one limitation of using comparative advantage theory to explain actual trade patterns today. [2]
Section C: Extended Source-Based and Evaluation (15–20)
15. With reference to Extract B, explain two factors that may have caused Country A to adopt protectionist policies. [4]
Extract B: Country A, a developing economy, faced a surge in cheap imports that undermined local manufacturing. Unemployment rose to 8%. The government imposed tariffs and local content requirements to protect jobs and nurture infant industries.
16. Evaluate whether free trade always leads to net gains for all participating countries. [6]
17. Using a diagram, explain the impact of a tariff on consumer surplus and producer surplus in the importing country. [4]
18. With reference to Extract C, discuss whether exchange rate appreciation is an effective tool to reduce a trade deficit. [5]
Extract C: Country B had a persistent trade deficit. Its central bank allowed the currency to appreciate by 10%. Import volumes fell by 4% but export volumes fell by 7% due to weaker price competitiveness. The trade deficit narrowed only slightly.
19. Assess the view that globalisation has reduced the ability of governments to pursue independent macroeconomic policy. [6]
20. Country C produces only wheat and cars. Using the data below, advise whether Country C should specialise in cars based on comparative advantage. Show working. [5]
| Country | Wheat (tonnes/hr) | Cars (units/hr) |
|---|
| C | 12 | 4 |
| D | 6 | 3 |
</stage5_quiz_answers_md>
A-Level Economics H2 Quiz - International Economics (Answer Key)
Total Marks: 40
1. [2 marks] Comparative advantage is the ability of a country to produce a good at a lower opportunity cost than another country.
Teaching note: Opportunity cost = what is sacrificed to produce one more unit. Even if a country is less efficient absolutely, it can still have comparative advantage if its relative sacrifice is smaller.
2. [1 mark] To protect domestic industries / raise government revenue / correct trade imbalance. (Any one.)
Marking: 1 mark for any valid reason.
3. [2 marks] Appreciation makes exports more expensive in foreign currency terms, reducing export competitiveness and volume.
Teaching: Exchange rate ↑ means local currency buys more foreign currency; foreign buyers pay more of their currency for same good.
4. [2 marks] Quota limits quantity of imports; subsidy is a payment to domestic producers (or exporters) to lower costs.
Marking: 1 mark each correct distinction.
5. [2 marks] Country X: 10 cars = 20 textiles → 1 car = 2 textiles. Opportunity cost = 2 units of textiles.
Working: OC = textiles/cars = 20/10 = 2.
6. [1 mark] E.g. licensing, technical standards, import quotas, administrative delays. (Any one non-tariff barrier.)
7. [2 marks] Terms of trade = (Export Price Index / Import Price Index) × 100. Measures how many import units one export unit buys.
Teaching: Higher ToT = better trading position.
8. [1 mark] E.g. removal of internal tariffs, larger market access, economies of scale. (Any one.)
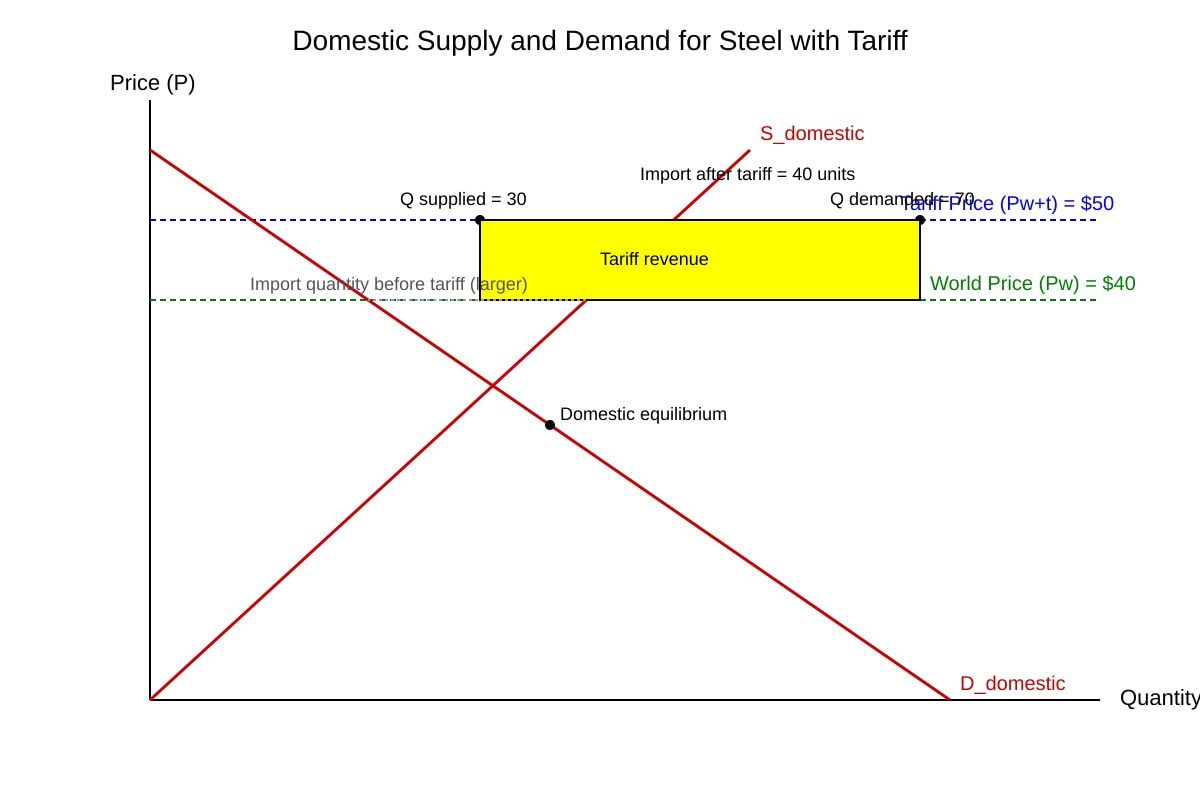
9. [2 marks] Tariff revenue = (Pw+t – Pw) × import after tariff = (50–40) × 40 = 400.AreaisrectanglebetweenPwandPw+toverimportquantity40.∗Fromimage:∗Rectangleboundedbyprices40–$50 and Q 30–70 (width 40).
10. [3 marks] Subsidy lowers producer cost → supply shifts right → export price falls → export volume rises.
Diagram: D and S; S shifts right; new lower equilibrium price; higher quantity exported. 1 mark diagram, 2 marks explanation.
11. [2 marks] Deficit shrank from –18.2 (2019) to +6.8 (2023); turned surplus in 2022.
Marking: 1 mark trend, 1 mark mention of surplus turn.
12. [2 marks] ToT = (130/110) × 100 = 118.18 ≈ 118.2.
Working: substitution and multiply by 100.
13. [3 marks] Higher income → higher import demand (MPM>0) → current account worsens. Diagram: income on x-axis, imports on y-axis upward slope; or AD shifts right increasing imports.
Marking: 1 diagram, 2 explanation.
14. [2 marks] Assumes constant costs, no transport, ignores economies of scale, dynamic gains, or trade restrictions. (Any one limitation with elaboration.)
15. [4 marks] Factors: (1) Surge in cheap imports undermined local manufacturing → protect jobs [2]; (2) Infant industry argument to nurture new sectors [2].
Extract refs: unemployment 8%, local content requirements.
16. [6 marks] For: allocative efficiency, lower prices, specialization gains. Against: structural unemployment, unequal distribution, infant industry need.
Marking descriptors: 2 marks for two points each side, 2 marks evaluation/conclusion. Net gains in aggregate but not per group.
17. [4 marks] Tariff raises price: consumer surplus falls (loss of area under D above new price); producer surplus rises (gain from higher price received). Deadweight loss occurs. Diagram required.
Marking: 2 diagram, 2 explanation of CS/PS changes.
18. [5 marks] Appreciation reduces import cost in local currency (volume fell 4%) but hurts exports more (–7%), so deficit barely improved. Limited effectiveness due to elasticities.
Marking: 2 extract evidence, 3 evaluation of effectiveness with elasticities.
19. [6 marks] For: capital mobility, impossible trinity limits independent monetary policy. Against: still fiscal space, managed float. Evaluate trade-offs.
Marking: 3 points, 3 evaluation.
20. [5 marks] Country C: OC of 1 car = 12/4 = 3 wheat; Country D: OC of 1 car = 6/3 = 2 wheat. D has lower OC in cars → D has comparative advantage in cars. C should NOT specialise in cars; C has comparative advantage in wheat (OC wheat: C=1/3 car, D=1/2 car).
Marking: 2 working C, 2 working D, 1 conclusion.
</stage5_quiz_answers_md>
<stage5_quiz_md>
A-Level Economics H2 Quiz - International Economics
Name:
Class:
Date:
Score:
Duration: 60 minutes
Total Marks: 40
Instructions: Answer all 20 questions. Section A: short structured questions (1–8). Section B: data and diagram interpretation (9–14). Section C: extended source-based and evaluation questions (15–20). Use diagrams where requested and show working for calculation items.
Section A: Short Structured Questions (1–8)
1. Define "comparative advantage" in international trade. [2]
2. State one reason why a country may impose a tariff on imported goods. [1]
3. Explain how an appreciation of a country's exchange rate affects its exports. [2]
4. Distinguish between a quota and a subsidy as forms of protectionism. [2]
5. With reference to the table below, calculate the opportunity cost of producing 1 unit of cars in terms of textiles for Country X. [2]
| Country | Cars (units/hr) | Textiles (units/hr) |
|---|
| X | 10 | 20 |
| Y | 5 | 15 |
6. Give one example of a non-tariff barrier. [1]
7. Explain the concept of "terms of trade" and how it is measured. [2]
8. State one potential benefit of membership in a free trade area such as ASEAN. [1]
Section B: Data and Diagram Interpretation (9–14)
9. The diagram below shows the effect of a tariff on imported steel. Using the diagram, identify the area representing government tariff revenue. [2]
Generated diagram for Q9.
10. Using a demand and supply diagram, explain how a subsidy to export producers can increase a country's export volume. [3]
11. With reference to Extract A, compare the trend in Singapore's merchandise trade balance from 2019 to 2023. [2]
Extract A: Singapore's merchandise trade balance (S$ billion): 2019: –18.2; 2020: –12.5; 2021: –5.3; 2022: +3.1; 2023: +6.8.
12. The table shows price indices for Country Z's exports and imports (2015=100). Calculate the terms of trade index for 2023. [2]
| Year | Export Price Index | Import Price Index |
|---|
| 2023 | 130 | 110 |
13. With the aid of a diagram, explain how a rise in domestic income may worsen the current account balance through imports. [3]
14. Identify one limitation of using comparative advantage theory to explain actual trade patterns today. [2]
Section C: Extended Source-Based and Evaluation (15–20)
15. With reference to Extract B, explain two factors that may have caused Country A to adopt protectionist policies. [4]
Extract B: Country A, a developing economy, faced a surge in cheap imports that undermined local manufacturing. Unemployment rose to 8%. The government imposed tariffs and local content requirements to protect jobs and nurture infant industries.
16. Evaluate whether free trade always leads to net gains for all participating countries. [6]
17. Using a diagram, explain the impact of a tariff on consumer surplus and producer surplus in the importing country. [4]
18. With reference to Extract C, discuss whether exchange rate appreciation is an effective tool to reduce a trade deficit. [5]
Extract C: Country B had a persistent trade deficit. Its central bank allowed the currency to appreciate by 10%. Import volumes fell by 4% but export volumes fell by 7% due to weaker price competitiveness. The trade deficit narrowed only slightly.
19. Assess the view that globalisation has reduced the ability of governments to pursue independent macroeconomic policy. [6]
20. Country C produces only wheat and cars. Using the data below, advise whether Country C should specialise in cars based on comparative advantage. Show working. [5]
| Country | Wheat (tonnes/hr) | Cars (units/hr) |
|---|
| C | 12 | 4 |
| D | 6 | 3 |