AI Generated Quiz
A Level H2 Economics Data Response Quiz
Free A Level H2 Econs Data Response quiz, LongCat AI version, with questions, answers, and A Level-style practice for Singapore students.
These static practice materials are generated from the site's syllabus and paper-generation workflow, with source and model context shown so students and parents can evaluate the material before use.
Questions
A-Level Economics H2 Quiz - Data Response
Name: _________________________________ Class: _______________
Date: _________________________________ Score: ______ / 60
Duration: 1 hour 15 minutes
Instructions:
- Answer all questions in the spaces provided.
- Read each source carefully before attempting the questions.
- Show all working for calculation questions.
- Use economic terminology precisely.
- For evaluation questions, consider multiple perspectives before reaching a reasoned conclusion.
Section A: Data Interpretation (Questions 1–5)
Read the following source and answer Questions 1–5.
Source A: Singapore's Economic Performance, 2019–2024
| Indicator | 2019 | 2020 | 2021 | 2022 | 2023 | 2024 (est.) |
|---|---|---|---|---|---|---|
| Real GDP Growth (%) | 1.3 | -4.1 | 8.9 | 3.6 | 1.1 | 2.5 |
| Unemployment Rate (%) | 2.3 | 3.0 | 2.7 | 2.1 | 2.0 | 2.1 |
| CPI Inflation (%) | 0.6 | -0.2 | 2.3 | 6.1 | 4.8 | 3.2 |
| Current Account Balance (% of GDP) | 15.2 | 16.8 | 17.5 | 18.1 | 17.2 | 16.5 |
| Government Budget Balance (% of GDP) | 0.4 | -11.2 | -1.6 | 0.8 | -0.5 | 0.2 |
Source: Ministry of Trade and Industry, Singapore; Department of Statistics, Singapore
Source B: Excerpt from Monetary Authority of Singapore (MAS) Policy Statement, April 2024
"The global economic outlook remains uncertain, with persistent inflationary pressures in major economies and ongoing geopolitical tensions affecting trade flows. Singapore's small open economy continues to face headwinds from weakening external demand, particularly in the electronics sector. However, domestic-oriented sectors such as construction and services have shown resilience. MAS will maintain a slightly restrictive monetary policy stance to anchor inflation expectations while supporting sustainable economic growth."
Source C: Excerpt from Ministry of Finance Budget Speech, February 2024
"The government will continue to support businesses and workers through targeted fiscal measures. The Progressive Wage Model will be expanded to cover more sectors, and additional subsidies will be provided for firms investing in automation and digitalisation. These measures aim to raise productivity growth, which has averaged only 1.2% per annum over the past decade, well below the 2–3% target."
1. Using Source A, identify the year in which Singapore experienced a recession and state two pieces of evidence from the data to support your answer. [3]
2. With reference to Source A, calculate the percentage point change in the unemployment rate between 2020 and 2023. Show your working. [2]
3. Using Source A, describe the relationship between real GDP growth and unemployment from 2020 to 2024. [3]
4. Using Sources A and B, explain two possible reasons why MAS maintained a "slightly restrictive monetary policy stance" in 2024. [4]
5. Using Source C, explain how the Progressive Wage Model might affect Singapore's aggregate supply. [4]
Section B: Data Analysis and Application (Questions 6–14)
Read the following source and answer Questions 6–14.
Source D: The Singapore Housing Market
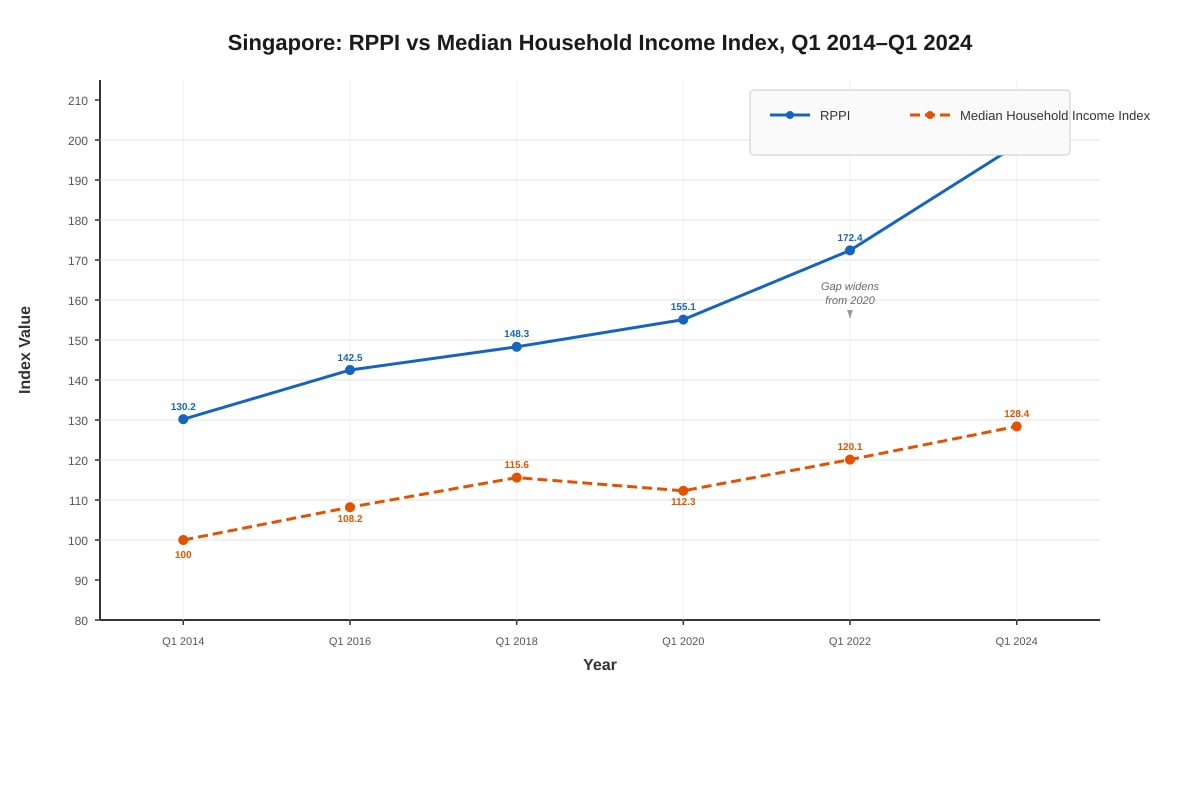
Singapore's property market has experienced significant price increases over the past decade. The Residential Property Price Index (RPPI) rose from 130.2 in Q1 2014 to 198.7 in Q1 2024, representing an increase of approximately 52.6%. During the same period, median household income grew by approximately 28.4%.
The government has implemented several cooling measures, including:
- Additional Buyer's Stamp Duty (ABSD): Additional tax on property purchases, ranging from 6% to 60% depending on buyer profile and number of properties owned.
- Total Debt Servicing Ratio (TDSR): Limits total monthly debt repayments to 60% of gross monthly income.
- Seller's Stamp Duty (SSD): Tax on properties sold within 3 years of purchase.
Generated image for this question.
id: Q6-fig1 type: graph linked_question: Q6 description: Line graph showing Singapore Residential Property Price Index (RPPI) and Median Household Income Index from Q1 2014 to Q1 2024. RPPI starts at 130.2 and rises to 198.7. Median Household Income Index starts at 100 and rises to 128.4. Both lines trend upward but RPPI rises more steeply, particularly from 2020 onwards. labels: X-axis: Year (Q1 2014 to Q1 2024), Y-axis: Index Value, Two lines: RPPI (solid line) and Median Household Income Index (dashed line) values: RPPI: 130.2 (2014), 142.5 (2016), 148.3 (2018), 155.1 (2020), 172.4 (2022), 198.7 (2024); Income Index: 100 (2014), 108.2 (2016), 115.6 (2018), 112.3 (2020), 120.1 (2022), 128.4 (2024) must_show: Both trend lines clearly visible, RPPI line steeper than income index line, gap between lines widening from 2020, axis labels, legend, title "Singapore: RPPI vs Median Household Income Index, Q1 2014–Q1 2024"
Source E: Excerpt from Urban Redevelopment Authority (URA) Report, 2024
"Housing affordability remains a key concern for Singaporean households. The price-to-income ratio for public housing (HDB flats) has increased from 4.8 in 2014 to 5.6 in 2024, while the ratio for private housing has risen from 18.2 to 22.4 over the same period. The government has responded by increasing the supply of Build-To-Order (BTO) flats and enhancing housing grants for first-time buyers. However, construction costs have risen by 35% since 2019 due to labour shortages and higher material costs, constraining the pace of supply expansion."
6. Using the data in Source D and Figure 1, calculate the percentage increase in the RPPI from Q1 2014 to Q1 2024. Show your working. [2]
7. Using Source D and Figure 1, compare the trends in the RPPI and median household income from 2014 to 2024. What does this suggest about housing affordability in Singapore? [4]
8. Explain how the Additional Buyer's Stamp Duty (ABSD) is likely to affect the demand for private housing in Singapore. [3]
9. Using a demand and supply diagram, explain how the Total Debt Servicing Ratio (TDSR) framework affects the equilibrium price and quantity in the housing market. [4]
10. Using Source E, identify two factors that have constrained the supply of housing in Singapore and explain how each factor affects the supply curve. [4]
11. Discuss whether the government's cooling measures (ABSD, TDSR, and SSD) have been effective in improving housing affordability in Singapore. Use evidence from Sources D and E to support your answer. [6]
12. Explain the concept of price elasticity of demand for housing and discuss how its value might differ between public housing (HDB flats) and private housing in Singapore. [4]
13. Using the concept of market failure, explain why the Singapore government intervenes in the housing market. [4]
14. Evaluate whether supply-side policies alone would be sufficient to address Singapore's housing affordability challenges. [6]
Section C: Extended Data Response (Questions 15–20)
Read the following source and answer Questions 15–20.
Source F: Singapore's Trade and Exchange Rate Policy
Singapore is one of the world's most open economies, with total trade (exports plus imports) exceeding 300% of GDP. The country's trade-to-GDP ratio has remained consistently high, reflecting its role as a global trading hub and its lack of natural resources.
Table 1: Singapore's Trade Data, 2020–2024
| Year | Domestic Exports (S$ bn) | Re-exports (S$ bn) | Total Imports (S$ bn) | Trade Balance (S$ bn) | NEER (S$, Index, 2020=100) |
|---|---|---|---|---|---|
| 2020 | 218.4 | 285.6 | 472.3 | 31.7 | 100.0 |
| 2021 | 268.3 | 342.1 | 568.2 | 42.2 | 101.5 |
| 2022 | 295.7 | 378.4 | 642.8 | 31.3 | 104.2 |
| 2023 | 278.2 | 356.9 | 601.4 | 33.7 | 105.8 |
| 2024 (est.) | 285.0 | 365.0 | 615.0 | 35.0 | 106.5 |
Note: NEER = Nominal Effective Exchange Rate; an increase indicates appreciation of the Singapore dollar.
Source G: Excerpt from MAS Annual Report, 2024
"Singapore's exchange rate-centred monetary policy has served the economy well. By managing the trade-weighted exchange rate within a policy band, MAS has been able to maintain price stability while supporting export competitiveness. The gradual and modest appreciation of the Singapore dollar over the past five years has helped to contain imported inflation without significantly harming export performance. However, the strong Singapore dollar has also made imports cheaper, which has had mixed effects on domestic producers competing with imported goods."
Source H: Excerpt from Economic Survey of Singapore, 2024
"Singapore's key trading partners include China (14.2% of total trade), Malaysia (11.8%), the United States (10.5%), the European Union (9.3%), and Japan (6.1%). The ongoing US-China trade tensions and supply chain restructuring have created both challenges and opportunities for Singapore. While some manufacturing activities have relocated to Singapore, the uncertainty has also dampened business investment in the region."
15. Using Table 1, calculate Singapore's total exports in 2022 and the percentage change in total exports from 2021 to 2022. Show your working. [3]
16. Using Table 1, describe the trend in Singapore's Nominal Effective Exchange Rate (NEER) from 2020 to 2024 and explain what this trend indicates about the Singapore dollar. [3]
17. Using Sources F and G, explain how the appreciation of the Singapore dollar might affect Singapore's domestic exporters and importers. [4]
18. Using a diagram, explain how MAS manages the exchange rate through its monetary policy. Illustrate the effect of a policy decision to allow gradual appreciation of the Singapore dollar. [5]
19. Discuss the extent to which Singapore's exchange rate policy has been effective in achieving its macroeconomic objectives. Use evidence from Sources F, G, and H to support your answer. [8]
20. Evaluate the likely impact of US-China trade tensions on Singapore's economy. Consider both the challenges and opportunities for Singapore as a small open economy. [8]
End of Quiz
Total Marks: 60
Answers
A-Level Economics H2 Quiz - Data Response: Answer Key
Section A: Data Interpretation (Questions 1–5)
1. Using Source A, identify the year in which Singapore experienced a recession and state two pieces of evidence from the data to support your answer. [3]
Answer:
- Year of recession: 2020 [1 mark]
- Evidence 1: Real GDP growth was -4.1% in 2020, indicating a contraction in economic output (two consecutive quarters of negative growth define a recession). [1 mark]
- Evidence 2: The unemployment rate rose from 2.3% in 2019 to 3.0% in 2020, reflecting the economic downturn and job losses. [1 mark]
Teaching note: A recession is typically defined as two consecutive quarters of negative real GDP growth. The COVID-19 pandemic caused a severe contraction in Singapore's economy in 2020, which is clearly visible in the data.
2. With reference to Source A, calculate the percentage point change in the unemployment rate between 2020 and 2023. Show your working. [2]
Answer:
- Unemployment rate in 2020: 3.0%
- Unemployment rate in 2023: 2.0%
- Percentage point change = 2.0% − 3.0% = −1.0 percentage point [1 mark for correct working, 1 mark for correct answer]
Teaching note: Students must distinguish between "percentage change" and "percentage point change." The question asks for percentage point change, which is simply the arithmetic difference between the two rates. The negative sign indicates a decrease.
3. Using Source A, describe the relationship between real GDP growth and unemployment from 2020 to 2024. [3]
Answer:
- There is an inverse (negative) relationship between real GDP growth and unemployment. [1 mark]
- When real GDP growth was negative in 2020 (−4.1%), unemployment rose to 3.0%. When GDP growth recovered strongly in 2021 (8.9%), unemployment fell to 2.7%. [1 mark]
- This pattern is consistent with Okun's Law, which states that higher economic growth is associated with lower unemployment, as firms hire more workers to meet increased output demands. [1 mark]
Teaching note: This relationship reflects the business cycle. During recessions, firms reduce output and lay off workers; during expansions, firms increase production and hire more workers. Students should reference specific data points from the table.
4. Using Sources A and B, explain two possible reasons why MAS maintained a "slightly restrictive monetary policy stance" in 2024. [4]
Answer:
Reason 1: To contain inflationary pressures. [1 mark]
- Source A shows CPI inflation was 3.2% in 2024, which, while declining from 4.8% in 2023, remained above the historical average. Source B mentions "persistent inflationary pressures in major economies." A restrictive stance (allowing the SGD to appreciate) helps reduce imported inflation by making imports cheaper. [1 mark]
Reason 2: To anchor inflation expectations while supporting sustainable growth. [1 mark]
- Source B states MAS aims to "anchor inflation expectations while supporting sustainable economic growth." With GDP growth at 2.5% in 2024 (moderate but positive) and unemployment low at 2.1%, MAS could afford to maintain a slightly restrictive stance to prevent inflation from becoming entrenched without risking a recession. [1 mark]
Teaching note: MAS uses the exchange rate as its primary monetary policy tool. A "restrictive" stance means allowing the SGD to appreciate, which reduces imported inflation but may hurt export competitiveness. Students must balance these effects.
5. Using Source C, explain how the Progressive Wage Model might affect Singapore's aggregate supply. [4]
Answer:
- The Progressive Wage Model (PWM) raises wages for lower-income workers through mandatory wage floors tied to skills upgrading. [1 mark]
- In the short run, higher wages increase production costs for firms, which could shift the short-run aggregate supply (SRAS) curve leftward, leading to higher prices and lower output. [1 mark]
- However, in the long run, the PWM encourages skills upgrading and productivity improvements (Source C mentions the goal of raising productivity growth). Higher productivity reduces unit labour costs, shifting the long-run aggregate supply (LRAS) curve rightward, increasing potential output. [1 mark]
- The net effect depends on whether the productivity gains from skills upgrading outweigh the higher wage costs. Given that Singapore's productivity growth has been below target (1.2% vs. 2–3%), the PWM aims to address this gap. [1 mark]
Teaching note: Students should distinguish between short-run and long-run effects on aggregate supply. The key concept is that higher wages without productivity gains are inflationary, but higher wages with productivity gains can be expansionary.
Section B: Data Analysis and Application (Questions 6–14)
6. Using the data in Source D and Figure 1, calculate the percentage increase in the RPPI from Q1 2014 to Q1 2024. Show your working. [2]
Answer: Percentage Increase=130.2198.7−130.2×100=130.268.5×100=52.6% [1 mark for correct formula/substitution, 1 mark for correct answer]
Teaching note: The percentage increase formula is (New − Old) / Old × 100. This is a straightforward calculation, but students must show their working to earn full marks.
7. Using Source D and Figure 1, compare the trends in the RPPI and median household income from 2014 to 2024. What does this suggest about housing affordability in Singapore? [4]
Answer:
- Both the RPPI and median household income show upward trends from 2014 to 2024. [1 mark]
- However, the RPPI rose by 52.6% while median household income grew by only 28.4%, meaning housing prices grew significantly faster than incomes. [1 mark]
- The gap between the two lines in Figure 1 widens from 2020 onwards, indicating that the rate of house price growth accelerated relative to income growth during the post-COVID period. [1 mark]
- This suggests that housing affordability has deteriorated over the period, as households need to spend a larger proportion of their income on housing. This is confirmed by Source E, which shows the price-to-income ratio for HDB flats rising from 4.8 to 5.6. [1 mark]
Teaching note: Students must compare the two trends, not just describe them individually. The key insight is the divergence between price growth and income growth, which directly impacts affordability.
8. Explain how the Additional Buyer's Stamp Duty (ABSD) is likely to affect the demand for private housing in Singapore. [3]
Answer:
- ABSD is an additional tax on property purchases, increasing the total cost of buying property. [1 mark]
- This reduces the effective purchasing power of buyers, particularly for second-time buyers and foreign buyers who face higher ABSD rates (up to 60%). [1 mark]
- As a result, the demand curve for private housing shifts leftward, leading to a lower equilibrium price and quantity. The extent of the shift depends on the price elasticity of demand — if demand is price inelastic (as housing often is due to its necessity), the quantity demanded falls proportionally less than the price increase. [1 mark]
Teaching note: ABSD is a demand-side policy tool. Students should explain the transmission mechanism: higher cost → lower purchasing power → leftward shift in demand. The elasticity point adds sophistication.
9. Using a demand and supply diagram, explain how the Total Debt Servicing Ratio (TDSR) framework affects the equilibrium price and quantity in the housing market. [4]
Answer:
- The TDSR limits total monthly debt repayments to 60% of gross monthly income, effectively capping the mortgage amount that buyers can borrow. [1 mark]
- This reduces the effective demand for housing, as buyers cannot borrow as much as they might otherwise. The demand curve shifts leftward from D₁ to D₂. [1 mark]
- On a diagram: the original equilibrium is at price P₁ and quantity Q₁. After the TDSR is imposed, the new equilibrium is at a lower price P₂ and lower quantity Q₂. [1 mark]
<image_placeholder> id: Q9-fig1 type: diagram linked_question: Q9 description: Standard demand and supply diagram for the housing market. Initial demand curve D1 slopes downward, supply curve S slopes upward. Initial equilibrium at (Q1, P1). Demand curve shifts left to D2. New equilibrium at (Q2, P2) with lower price and quantity. Arrow showing leftward shift of demand. labels: X-axis: Quantity of Housing, Y-axis: Price of Housing, D1 (initial demand), D2 (demand after TDSR), S (supply), E1 (initial equilibrium), E2 (new equilibrium), P1, P2, Q1, Q2 values: P1 > P2, Q1 > Q2 must_show: Both demand curves, supply curve, both equilibrium points, clear labels, arrow indicating leftward shift
- The TDSR is effective because it directly targets the ability to pay rather than just the willingness to pay, making it a more targeted cooling measure than ABSD. [1 mark]
Teaching note: Students must draw a clear diagram with correct labels. The key is showing a leftward shift in demand, not a movement along the curve. The TDSR reduces the quantity demanded at every price level.
10. Using Source E, identify two factors that have constrained the supply of housing in Singapore and explain how each factor affects the supply curve. [4]
Answer:
Factor 1: Labour shortages in the construction sector. [1 mark]
- Labour shortages mean that construction firms cannot hire enough workers to build new housing units. This increases the marginal cost of production and reduces the quantity of housing that can be supplied at each price level, shifting the supply curve leftward. [1 mark]
Factor 2: Higher material costs (construction costs rose 35% since 2019). [1 mark]
- Rising material costs increase the cost of building new housing. At any given price, developers are willing to supply fewer units because their profit margins are squeezed. This also shifts the supply curve leftward, contributing to higher equilibrium prices. [1 mark]
Teaching note: Both factors are supply-side constraints. Students should clearly link each factor to a leftward shift in the supply curve, distinguishing this from demand-side factors.
11. Discuss whether the government's cooling measures (ABSD, TDSR, and SSD) have been effective in improving housing affordability in Singapore. Use evidence from Sources D and E to support your answer. [6]
Answer:
Introduction: The government's cooling measures aim to moderate housing price increases and improve affordability. However, evidence suggests their effectiveness has been limited.
Arguments that the measures have been effective:
- The ABSD and TDSR have likely moderated the rate of price increases that would otherwise have been even higher, given strong demand from population growth and low interest rates. [1 mark]
- The SSD discourages speculative short-term flipping of properties, reducing artificial demand pressures. [1 mark]
Arguments that the measures have been ineffective:
- Despite the cooling measures, the RPPI rose by 52.6% from 2014 to 2024 (Source D), and the price-to-income ratio for HDB flats increased from 4.8 to 5.6 (Source E). This suggests affordability has worsened, not improved. [1 mark]
- The measures primarily target demand but do not address the supply constraints identified in Source E (labour shortages, higher construction costs). Without increasing supply, demand-side measures alone cannot significantly improve affordability. [1 mark]
- The TDSR may have unintended consequences, such as pushing buyers toward the rental market or causing them to purchase smaller/cheaper units, which does not necessarily improve overall welfare. [1 mark]
Evaluation: While the cooling measures may have prevented even steeper price increases, they have not been sufficient to improve affordability because they do not address the fundamental supply-side constraints. A more comprehensive approach combining demand management with supply expansion is needed. [1 mark]
Marking guide: 2 marks for arguments supporting effectiveness, 2 marks for arguments against, 2 marks for evaluation and conclusion.
12. Explain the concept of price elasticity of demand for housing and discuss how its value might differ between public housing (HDB flats) and private housing in Singapore. [4]
Answer:
- Price elasticity of demand (PED) measures the responsiveness of quantity demanded to a change in price: PED=%ΔP%ΔQd. [1 mark]
- For public housing (HDB flats), demand is likely to be price inelastic (|PED| < 1) because: (i) housing is a necessity, (ii) HDB flats are subsidised and represent the most affordable option for the majority of Singaporeans, (iii) there are few close substitutes for first-time homebuyers. [1 mark]
- For private housing, demand is likely to be more price elastic (though still relatively inelastic) because: (i) private housing is more of a luxury good, (ii) buyers have more alternatives (HDB flats, renting, or delaying purchase), (iii) the higher absolute price means buyers are more sensitive to price changes. [1 mark]
- The difference in elasticity has policy implications: cooling measures like ABSD will have a larger impact on private housing demand (more elastic) than on public housing demand (more inelastic). [1 mark]
Teaching note: Students must define PED, apply it to both housing types, and explain the reasoning. The key insight is that necessity vs. luxury status and availability of substitutes determine elasticity.
13. Using the concept of market failure, explain why the Singapore government intervenes in the housing market. [4]
Answer:
-
Market failure occurs when the free market fails to allocate resources efficiently. The housing market in Singapore exhibits several forms of market failure: [1 mark]
-
Merit good characteristics: Housing is a merit good — it generates positive externalities for society (stable families, better health outcomes, social cohesion). The free market would under-provide housing relative to the socially optimal level because private developers do not account for these external benefits. [1 mark]
-
Information asymmetry: Buyers may not have full information about property conditions, future price trends, or the true cost of homeownership. This can lead to suboptimal decisions and market inefficiency. [1 mark]
-
Equity concerns: The free market may result in housing being unaffordable for lower-income households, leading to inequality. Government intervention through HDB subsidies and grants addresses this equity objective, ensuring that all citizens have access to affordable housing. [1 mark]
Teaching note: Students should identify specific types of market failure and link them to government intervention. The merit good argument is the most important for housing, but equity and information asymmetry are also valid.
14. Evaluate whether supply-side policies alone would be sufficient to address Singapore's housing affordability challenges. [6]
Answer:
Introduction: Supply-side policies aim to increase the quantity of housing available, but their sufficiency depends on various factors.
Arguments that supply-side policies could be sufficient:
- Increasing the supply of BTO flats and addressing construction bottlenecks (labour shortages, material costs) would shift the supply curve rightward, lowering equilibrium prices and improving affordability. [1 mark]
- If supply increases sufficiently to match or exceed demand growth, prices would stabilise or fall, making housing more affordable without the need for demand-side restrictions. [1 mark]
Arguments that supply-side policies alone are insufficient:
- Time lags: Building new housing takes years. Source E notes that construction costs have risen 35% since 2019, constraining supply expansion. In the meantime, demand-side measures are needed to manage price pressures. [1 mark]
- Demand-side factors: Population growth, low interest rates, and investment demand continue to drive up housing prices. Without demand-side measures (ABSD, TDSR), increased supply might be absorbed by speculative demand rather than improving affordability for genuine homebuyers. [1 mark]
- Land scarcity: Singapore's limited land area means there is a physical constraint on how much supply can be increased, making it impossible to rely solely on supply-side solutions. [1 mark]
Evaluation: Supply-side policies are necessary but not sufficient. A combination of supply expansion (to address the root cause) and demand management (to address short-term pressures) is needed. The government's current approach of using both types of measures is therefore appropriate, but the balance should shift toward supply-side solutions over the medium to long term. [1 mark]
Marking guide: 2 marks for supply-side arguments, 2 marks for limitations, 2 marks for evaluation.
Section C: Extended Data Response (Questions 15–20)
15. Using Table 1, calculate Singapore's total exports in 2022 and the percentage change in total exports from 2021 to 2022. Show your working. [3]
Answer:
Total exports in 2022: Total Exports=Domestic Exports+Re-exports=295.7+378.4=674.1 S$ billion [1 mark]
Percentage change in total exports from 2021 to 2022: Total Exports 2021=268.3+342.1=610.4 S$ billion Percentage Change=610.4674.1−610.4×100=610.463.7×100=10.4% [1 mark for correct working, 1 mark for correct answer]
Teaching note: Total exports = domestic exports + re-exports. Students must add both components before calculating the percentage change. A common mistake is to calculate the percentage change for each component separately.
16. Using Table 1, describe the trend in Singapore's Nominal Effective Exchange Rate (NEER) from 2020 to 2024 and explain what this trend indicates about the Singapore dollar. [3]
Answer:
- The NEER shows a consistent upward trend from 100.0 in 2020 to 106.5 in 2024, representing a 6.5% appreciation of the Singapore dollar over the period. [1 mark]
- The appreciation has been gradual and steady, with annual increases of approximately 1.5–1.7 index points, indicating a managed and deliberate policy approach rather than a sudden shift. [1 mark]
- This trend indicates that the Singapore dollar has strengthened against a trade-weighted basket of currencies. This is consistent with MAS's policy of allowing "gradual and modest appreciation" (Source G) to contain imported inflation while maintaining export competitiveness. [1 mark]
Teaching note: NEER measures the value of the SGD against a basket of trading partners' currencies, weighted by trade shares. An increase means appreciation. Students should describe the trend and link it to MAS policy.
17. Using Sources F and G, explain how the appreciation of the Singapore dollar might affect Singapore's domestic exporters and importers. [4]
Answer:
Effect on domestic exporters:
- Appreciation makes Singapore's exports more expensive in foreign currency terms, reducing their price competitiveness in international markets. [1 mark]
- This could lead to a fall in export volumes, particularly for price-sensitive goods such as electronics (Source B mentions weakening external demand in the electronics sector). Exporters may see reduced revenues and profits. [1 mark]
Effect on importers:
- Appreciation makes imports cheaper in SGD terms, reducing the cost of imported raw materials, intermediate goods, and consumer products. [1 mark]
- This benefits import-dependent firms (e.g., manufacturers importing components) and consumers (cheaper imported goods). However, Source G notes that cheaper imports create mixed effects for domestic producers who compete with imported goods, as they face stiffer price competition. [1 mark]
Teaching note: Students must consider both sides — exporters lose competitiveness while importers gain. The net effect on the trade balance depends on the price elasticities of demand for exports and imports (Marshall-Lerner condition).
18. Using a diagram, explain how MAS manages the exchange rate through its monetary policy. Illustrate the effect of a policy decision to allow gradual appreciation of the Singapore dollar. [5]
Answer:
- MAS manages the SGD exchange rate through the foreign exchange market. It buys and sells SGD against a trade-weighted basket of currencies to maintain the exchange rate within a policy band. [1 mark]
<image_placeholder> id: Q18-fig1 type: diagram linked_question: Q18 description: Supply and demand diagram for the Singapore dollar in the foreign exchange market. Initial demand curve D1 and supply curve S1 intersect at equilibrium exchange rate E1 (e.g., 1.35 SGD/USD). To allow appreciation, MAS reduces the supply of SGD (shifts supply curve left from S1 to S2) or increases demand for SGD (shifts demand right from D1 to D2). New equilibrium at E2 with a stronger SGD (e.g., 1.30 SGD/USD). The diagram should show the policy band as a shaded zone around the equilibrium. labels: X-axis: Quantity of SGD, Y-axis: Exchange Rate (foreign currency per SGD), D1 (initial demand), D2 (demand after policy), S1 (initial supply), S2 (supply after policy), E1 (initial equilibrium), E2 (new equilibrium - appreciation), Policy Band (shaded zone) values: E2 > E1 (appreciation), arrows showing leftward shift of supply or rightward shift of demand must_show: Both supply and demand curves, initial and new equilibrium, policy band zone, clear labels, arrows indicating shifts
- To allow appreciation, MAS can either: (i) reduce the supply of SGD in the foreign exchange market (shift supply curve left from S₁ to S₂), or (ii) increase demand for SGD by attracting capital inflows (shift demand curve right from D₁ to D₂). [1 mark]
- The result is a higher exchange rate (E₁ to E₂), meaning the SGD buys more foreign currency. [1 mark]
- MAS does not target a specific exchange rate but manages the rate within a policy band, allowing it to fluctuate within a range to absorb short-term volatility while maintaining the overall trend. [1 mark]
Teaching note: The diagram is essential. Students should show either a leftward shift in supply or a rightward shift in demand (or both) leading to a higher exchange rate. The policy band concept is unique to Singapore and should be mentioned.
19. Discuss the extent to which Singapore's exchange rate policy has been effective in achieving its macroeconomic objectives. Use evidence from Sources F, G, and H to support your answer. [8]
Answer:
Introduction: Singapore's exchange rate-centred monetary policy aims to achieve price stability, sustainable economic growth, and export competitiveness. Its effectiveness can be evaluated against these objectives.
Effectiveness in achieving price stability:
- Source A shows CPI inflation declined from 6.1% in 2022 to 3.2% in 2024, suggesting that the gradual appreciation of the SGD (NEER rose from 104.2 to 106.5) has helped contain imported inflation. [1 mark]
- Source G confirms that "the gradual and modest appreciation of the Singapore dollar over the past five years has helped to contain imported inflation." [1 mark]
Effectiveness in supporting economic growth:
- Real GDP growth recovered from -4.1% in 2020 to 2.5% in 2024, and unemployment fell to 2.1%, suggesting the policy has supported growth. [1 mark]
- However, growth has been modest (1.1% in 2023, 2.5% in 2024), and Source B notes "weakening external demand," suggesting that the strong SGD may have dampened export-led growth. [1 mark]
Effectiveness in maintaining export competitiveness:
- Source F shows total exports grew from S610.4billionin2021toS674.1 billion in 2022 (10.4% increase), suggesting that export competitiveness has been maintained despite appreciation. [1 mark]
- However, exports fell in 2023 (to S$635.1 billion), possibly reflecting the lagged effect of appreciation combined with weakening global demand (Source H mentions US-China trade tensions). [1 mark]
Limitations:
- The exchange rate policy is a blunt tool — it affects all sectors uniformly, even though some sectors (e.g., electronics) are more exchange-rate sensitive than others (e.g., domestic services). [1 mark]
- Source H highlights that external factors (US-China tensions, supply chain restructuring) create uncertainty that the exchange rate policy alone cannot address. [1 mark]
Evaluation: Overall, Singapore's exchange rate policy has been largely effective in achieving its primary objective of price stability while supporting moderate growth. However, its effectiveness is constrained by external factors and the trade-off between controlling inflation and maintaining export competitiveness. The policy works best when complemented by supply-side measures to enhance productivity and competitiveness. [1 mark]
Marking guide: 2 marks for price stability analysis, 2 marks for growth analysis, 2 marks for export competitiveness, 2 marks for limitations and evaluation.
20. Evaluate the likely impact of US-China trade tensions on Singapore's economy. Consider both the challenges and opportunities for Singapore as a small open economy. [8]
Answer:
Introduction: As a small open economy with trade exceeding 300% of GDP (Source F), Singapore is highly vulnerable to disruptions in global trade flows. US-China trade tensions create both challenges and opportunities.
Challenges:
-
Reduced trade volumes: US-China tariffs and trade restrictions reduce bilateral trade between the two largest economies, which indirectly affects Singapore because both are major trading partners (China: 14.2%, US: 10.5% of total trade — Source H). Reduced trade flows through Singapore's ports and logistics sector could lower re-export revenues. [1 mark]
-
Supply chain disruptions: Trade tensions cause uncertainty, leading firms to delay investment decisions (Source H: "uncertainty has dampened business investment in the region"). This reduces capital inflows and business activity in Singapore. [1 mark]
-
Weaker external demand: If US-China tensions slow global growth, demand for Singapore's exports (particularly electronics and manufactured goods) would fall, reducing GDP growth and potentially increasing unemployment. [1 mark]
Opportunities:
-
Trade diversion: Firms relocating production from China to avoid US tariffs may choose Singapore or the broader ASEAN region. Source H notes that "some manufacturing activities have relocated to Singapore," which could boost FDI and create jobs. [1 mark]
-
Supply chain restructuring: Singapore's strategic location, strong infrastructure, and business-friendly environment position it as an attractive hub for firms diversifying supply chains away from China. This could increase demand for Singapore's logistics, financial, and professional services. [1 mark]
-
Increased demand for Singapore's services: As trade patterns shift, Singapore's role as a financial and trading hub could be enhanced, particularly if it becomes a neutral intermediary for US-China trade. [1 mark]
Evaluation:
- The net impact depends on the duration and severity of the trade tensions. In the short run, the challenges (reduced trade, uncertainty) are likely to dominate. In the medium to long run, if Singapore successfully positions itself as an alternative manufacturing and trading hub, the opportunities could outweigh the challenges. [1 mark]
- Singapore's economic resilience — its diversified economy, strong institutions, and proactive government policies — positions it to weather the challenges. However, as a small open economy, it cannot fully insulate itself from global headwinds. The government's focus on productivity growth and economic diversification (Source C) is a prudent response. [1 mark]
Marking guide: 3 marks for challenges, 3 marks for opportunities, 2 marks for evaluation. Students must demonstrate understanding of Singapore's unique position as a small open economy and use evidence from the sources.
End of Answer Key
Mark Distribution Summary:
| Section | Questions | Marks |
|---|---|---|
| A | 1–5 | 16 |
| B | 6–14 | 36 |
| C | 15–20 | 38 |
| Total | 20 questions | 60 |
Note: Section totals are approximate; individual question marks are as stated.
Free quiz and exam paper access
Enter your details to view this paper
Your access is remembered on this device.