AI Generated Quiz
A Level H2 Economics Data Response Quiz
Free A Level H2 Econs Data Response quiz, HY3 AI version, with questions, answers, and A Level-style practice for Singapore students.
These static practice materials are generated from the site's syllabus and paper-generation workflow, with source and model context shown so students and parents can evaluate the material before use.
Questions
A-Level Economics H2 Quiz - Data Response
Name:
Class:
Date:
Score:
Duration: 60 minutes
Total Marks: 40
Topic: Data Response (syllabus-first practice; not derived from past-year papers)
Instructions:
- Answer all 20 questions.
- Use the extracts, tables, and figures provided.
- Show workings where calculation is required.
- Section A: Data Interpretation (Q1–5)
- Section B: Source-Based Analysis (Q6–13)
- Section C: Evaluation and Synthesis (Q14–20)
Section A: Data Interpretation (Questions 1–5)
Q1. With reference to Table 1 below, describe the trend in renewable energy share of total electricity generation in Country A from 2019 to 2023.
Table 1: Renewable Share of Electricity (%)
| Year | 2019 | 2020 | 2021 | 2022 | 2023 |
|---|---|---|---|---|---|
| Share (%) | 12 | 15 | 19 | 24 | 30 |
[2 marks]
Q2. Using the data in Table 1, calculate the percentage point increase in renewable share between 2019 and 2023. Show your working.
[2 marks]
Q3. With reference to Extract 1, explain one possible reason for the trend described in Q1.
Extract 1: "Country A introduced a carbon tax in 2020 and expanded solar subsidies, leading to a rapid build-up of solar farms."
[2 marks]
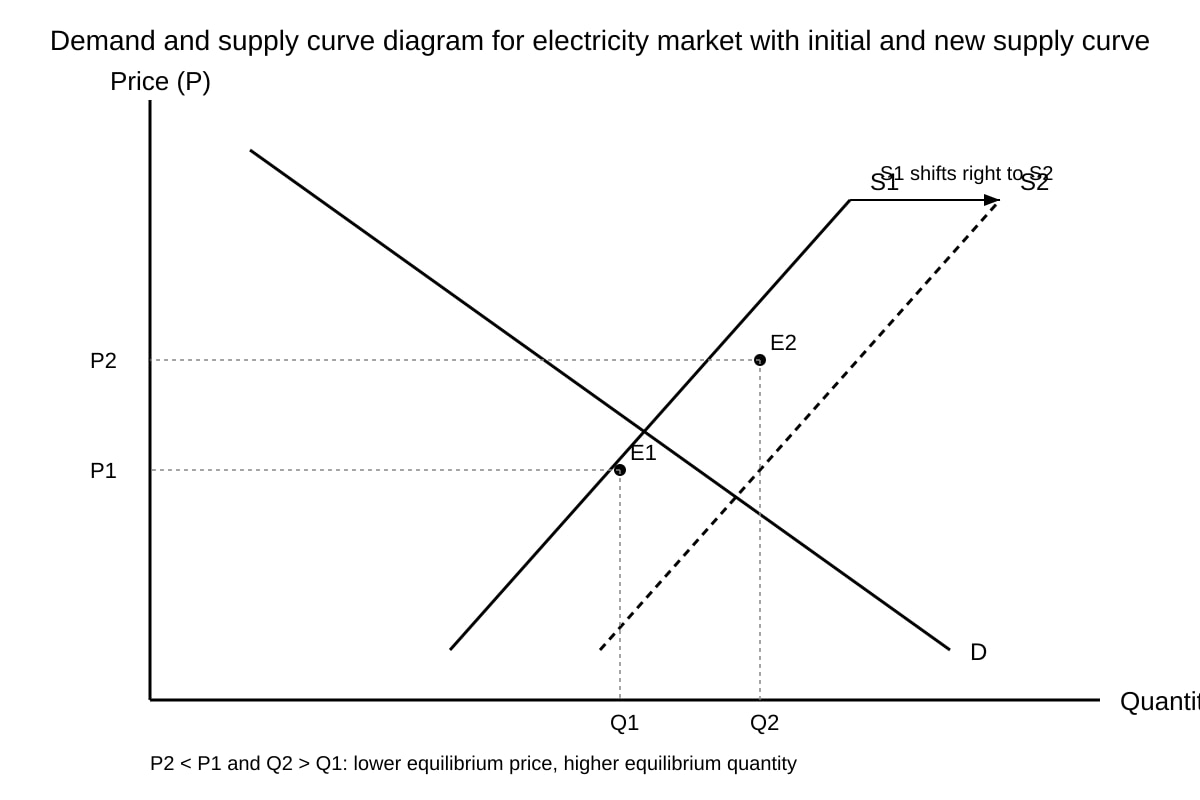
Q4. The figure below shows the demand and supply for electricity in Country A. Use the diagram to explain how a shift in supply from renewable expansion affects equilibrium price and quantity.
Image pending generation: graph for Q4.
[3 marks]
Q5. With reference to Table 2, compare the inflation rates of Country B and Country C in 2022 and 2023.
Table 2: Inflation Rate (%)
| Year | Country B | Country C |
|---|---|---|
| 2022 | 2.1 | 5.8 |
| 2023 | 1.7 | 4.2 |
[2 marks]
Section B: Source-Based Analysis (Questions 6–13)
Q6. With reference to Extract 2, explain how the government's training scheme addresses factor immobility.
Extract 2: "Region X suffered from structural unemployment as coal workers lacked skills for tech jobs. The government funded retraining programmes to help them transition."
[2 marks]
Q7. Using Extract 2, identify one source of cost advantage for firms hiring retrained workers.
[2 marks]
Q8. With reference to Extract 3, explain whether the tariff on imported cars is justified on infant industry grounds.
Extract 3: "Country D imposed 20% tariff on foreign EVs to protect local EV startups that are not yet cost-competitive but show potential for scale."
[4 marks]
Q9. What evidence from Table 3 suggests globalisation slowed from 2018 to 2022?
Table 3: Global Trade Volume Index (2015=100)
| Year | 2018 | 2020 | 2022 |
|---|---|---|---|
| Index | 118 | 109 | 112 |
[2 marks]
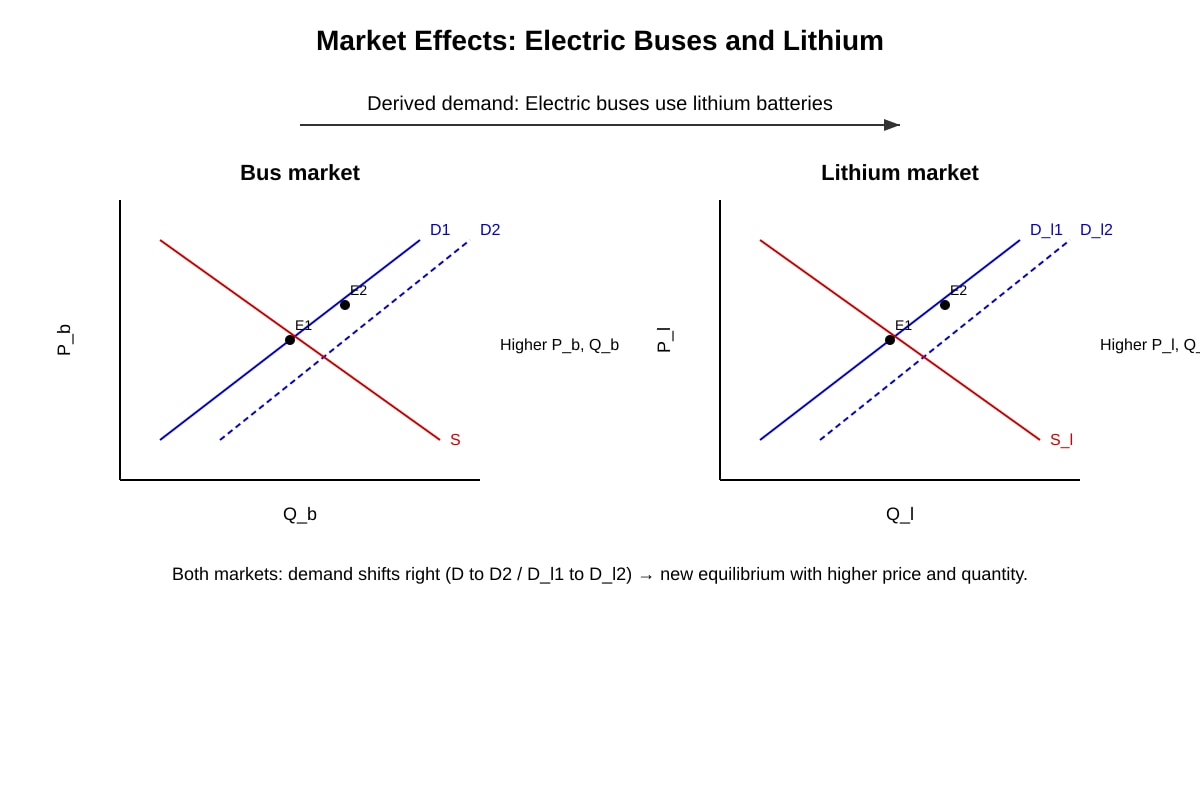
Q10. With reference to Extract 4, use a diagram to explain how a rise in demand for electric buses affects the market for lithium.
Extract 4: "Cities increased orders for electric buses, raising demand for battery metals."
Image pending generation: graph for Q10.
[3 marks]
Q11. Explain how the measures under an Extended Producer Responsibility scheme can improve societal welfare, using Extract 5.
Extract 5: "Singapore's EPR for e-waste requires manufacturers to collect and recycle old devices, reducing landfill and pollution."
[4 marks]
Q12. With reference to Extract 6, explain one revenue reason why fast fashion firms lack incentive to change.
Extract 6: "Fast fashion firms earn high revenue from frequent low-cost collections; switching to sustainable lines would raise costs and risk losing price-sensitive customers."
[3 marks]
Q13. Using Extract 7, explain the factors affecting the government's decision to implement a chip subsidy.
Extract 7: "Country E launched a $50b chip subsidy to reduce reliance on foreign semiconductors, citing national security and job creation."
[4 marks]
Section C: Evaluation and Synthesis (Questions 14–20)
Q14. Evaluate the statement: "It is up to consumers to avoid fast fashion and support sustainable brands to alleviate environmental harm." Use economic concepts.
[6 marks]
Q15. With reference to Table 4, calculate the price elasticity of demand for Product X between Price 10and8, and state whether revenue rises if price falls.
Table 4: Product X
| Price ($) | Quantity demanded |
|---|---|
| 10 | 100 |
| 8 | 140 |
[4 marks]
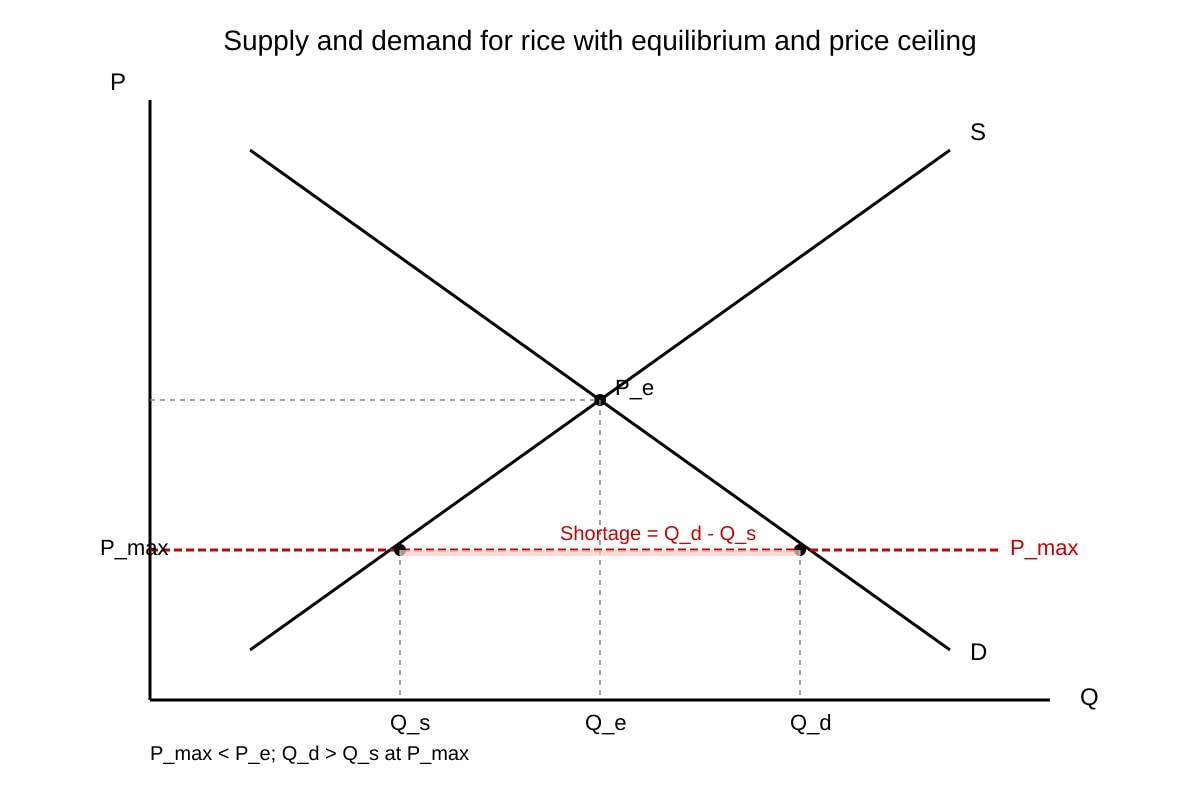
Q16. Using a diagram, explain how a maximum price control on rice could create a shortage, with reference to Extract 8.
Extract 8: "Country F set a max price for rice below equilibrium to help poor households, but mills reduced supply."
Image pending generation: graph for Q16.
[3 marks]
Q17. Discuss whether digital platform Shopee in Country G exhibits monopoly power, using Extract 9.
Extract 9: "Shopee holds 65% e-commerce share in Country G, with strong network effects and high seller lock-in, but low consumer switching costs."
[5 marks]
Q18. With reference to Extract 10, evaluate the effectiveness of exchange rate appreciation in controlling imported inflation.
Extract 10: "Country H allowed currency appreciation to lower import prices amid global oil spikes, but domestic demand inflation persisted."
[5 marks]
Q19. Using Table 5, compute the fiscal multiplier from a 2bspendingrisethatincreasedGDPby6b, and name one leakage.
Table 5: Scenario
| ΔG ($b) | ΔGDP ($b) |
|---|---|
| 2 | 6 |
[3 marks]
Q20. Synthesise: Using Extracts 2 and 11, explain how government intervention can correct market failure and improve welfare.
[4 marks]
Answers
A-Level Economics H2 Quiz - Data Response (Answer Key)
Topic: Data Response
Total Marks: 40
Note: Syllabus-first content generated from LLM-inferred templates; not claimed as past-year exam derived.
Section A: Data Interpretation
Q1. [2 marks] Answer: Renewable share rose steadily from 12% (2019) to 30% (2023), an upward trend of 18 percentage points. Teaching note: Student should describe direction and magnitude from Table 1. Mark: 1 for correct start/end, 1 for noting increase.
Q2. [2 marks] Working: 30% – 12% = 18 percentage points. Answer: 18 percentage points. Teaching note: Simple subtraction; show units. Mark: 1 for working, 1 for answer.
Q3. [2 marks] Answer: Carbon tax raised cost of fossil power, while solar subsidies lowered renewable cost, shifting supply toward renewables. Teaching note: Link Extract 1 policy to incentive function of price mechanism. Mark: 1 for carbon tax, 1 for subsidy.
Q4. [3 marks] Answer: Renewable expansion shifts supply right (S1→S2). Equilibrium price falls (P1→P2), quantity rises (Q1→Q2). Teaching note: Use diagram features from placeholder. Mark: 1 shift, 1 price, 1 quantity.
Q5. [2 marks] Answer: Country B inflation fell from 2.1% to 1.7%; Country C fell from 5.8% to 4.2%; C consistently higher. Teaching note: Compare both years and levels. Mark: 1 each country trend.
Section B: Source-Based Analysis
Q6. [2 marks] Answer: Retraining reduces occupational immobility by giving coal workers new skills, easing structural unemployment. Teaching note: Factor immobility concept. Mark: 1 definition, 1 application.
Q7. [2 marks] Answer: Firms get lower hiring/search costs as workers are pre-skilled via government training. Teaching note: Cost advantage from reduced training expense. Mark: 1 identify, 1 explain.
Q8. [4 marks] Answer: Partly justified: infant industry needs protection to achieve scale (1); but 20% may be excessive (1); risk of inefficiency if not removed (1); lacks proof of future competitiveness (1). Teaching note: Use tariff justification criteria. Mark descriptors: 4 = balanced, 2–3 = one-sided.
Q9. [2 marks] Answer: Index fell from 118 (2018) to 109 (2020) then only 112 (2022), showing stalled trade growth. Teaching note: Read table trend. Mark: 1 fall, 1 incomplete recovery.
Q10. [3 marks] Answer: Bus demand↑ → derived demand for lithium↑ → lithium price and quantity↑ (diagram shows D_l1→D_l2). Teaching note: Derived demand chain. Mark: 1 bus, 1 lithium shift, 1 outcome.
Q11. [4 marks] Answer: EPR internalises externalities (1); reduces pollution (1); conserves resources (1); raises welfare via cleaner environment (1). Teaching note: Market failure correction. Mark: 1 each point.
Q12. [3 marks] Answer: High revenue from volume sales (1); sustainable switch cuts revenue due to cost rise (1); profit motive discourages change (1). Teaching note: Revenue reason from extract. Mark: 1 each.
Q13. [4 marks] Answer: National security (1); reduce foreign dependence (1); job creation (1); industrial scale (1). Teaching note: Extract lists factors. Mark: 1 each.
Section C: Evaluation and Synthesis
Q14. [6 marks] Answer: Consumers can shift demand (2); but info/income barriers exist (2); systemic externalities need gov regulation (2). Teaching note: Evaluate individual vs systemic. Descriptors: 6 = eval, 4 = points only.
Q15. [4 marks] Working: %ΔQ = (140-100)/100 = 40%; %ΔP = (8-10)/10 = -20%; PED = 40/-20 = -2. |PED|>1 so revenue rises when price falls. Answer: PED = -2, revenue rises. Teaching note: Formula PED = %ΔQ/%ΔP. Mark: 2 calc, 2 conclusion.
Q16. [3 marks] Answer: Max price below P_e → Q_d > Q_s → shortage. Diagram shows gap. Teaching note: Price ceiling effect. Mark: 1 ceiling, 1 gap, 1 shortage.
Q17. [5 marks] Answer: High share + network effects suggest power (2); but low switching costs imply contestability (2); conclusion nuanced (1). Teaching note: Monopoly criteria. Mark: as above.
Q18. [5 marks] Answer: Appreciation cuts import price (2); but domestic inflation remains (2); partial effectiveness (1). Teaching note: Policy trade-off. Mark descriptors.
Q19. [3 marks] Working: Multiplier = ΔGDP/ΔG = 6/2 = 3. Leakage: imports. Answer: 3, imports. Teaching note: Multiplier formula. Mark: 2 calc, 1 leakage.
Q20. [4 marks] Answer: Retraining fixes immobility (2); EPR fixes externality (2); both raise welfare. Teaching note: Synthesise extracts. Mark: 2 each.
Free quiz and exam paper access
Enter your details to view this paper
Your access is remembered on this device.